
 Open Access Article
 This Open Access Article is licensed under a Creative Commons Attribution-Non Commercial 3.0 Unported Licence
Hydrogen production via thermocatalytic decomposition of methane using carbon-based catalysts†
Khalida Haruna,
Sushil Adhikari *ab and
Hossein Jahromiab
*ab and
Hossein Jahromiab
aDepartment of Biosystems Engineering, Auburn University, Auburn, Alabama 36849, USA. E-mail: sushil.adhikari@auburn.edu; Fax: +1 334 844 3530; Tel: +1 334 844 3543
bCenter for Bioenergy and Bioproducts, Auburn University, Auburn, Alabama 36849, USA
First published on 10th November 2020
Abstract
Thermocatalytic decomposition (TCD) of methane is one of the most effective methods for pure hydrogen production. Catalysts were selected for TCD of methane in this study to utilize biochar as a catalyst. Among these catalysts, two catalysts (named activated biochar (AB) and heat-treated biochar (HB)) were prepared from Douglas fir, whereas the other four were prepared using commercial activated carbon and zeolite with and without doping ruthenium metal. The catalysts were characterized using XRD, SEM imaging, TEM, H2-TPR, and BET specific surface area and pore size analysis. The Ru doped commercial activated carbon catalyst (Ru–AC) was deactivated continuously during a 60 h reaction run, whereas AB exhibited comparatively stable methane conversion up to 60 h. The methane conversion was 21% for Ru–AC and 51% for AB after 60 h of reaction time at 800 °C. The very high surface area of AB (∼3250 m2 g−1) and its microporosity compared to other catalysts could have resulted in resistance against rapid deactivation. Furthermore, carbon nanotube by-products were observed in TEM images of solid residues that could form due to the presence of alkali metals in the biochar. Carbon nanotube formation could contribute significantly to the extended life of AB.
1 Introduction
One of the significant challenges of today's society is to minimize anthropogenic greenhouse gas emissions while meeting the energy demand of the ever-increasing world population.1–5 To address this issue, hydrogen fuel can be used as an alternative to fossil fuel. Hydrogen produces only water during its controlled oxidation in a fuel cell or in its direct combustion. It is the most abundant element in the whole universe, but unfortunately, it is not available in its purest form on earth. Hence, it is a secondary energy source, and it can be produced from other sources such as natural gas, fossil fuel, biomass, and water.4Water electrolysis is normally used to produce high purity hydrogen; however, this process is uneconomical for industrial use.5 On the other hand, biomass gasification can be used as an industrial source of hydrogen but gasification mostly produces syngas, which is used for producing electricity, wax, higher hydrocarbon, and methanol but not pure hydrogen.6 In the commercial production of hydrogen, a combination of steam reforming reaction and partial oxidation of fossil fuels is used. A large amount of COx (CO, CO2) is produced via reforming and partial oxidation, and requires costly purification steps.7 Methane (CH4) is the main component of natural gas, and around 48% of world's total hydrogen production is coming from natural gas.5 Additionally, methane can be produced from anaerobic digestion of various agricultural and food wastes. Since methane has the highest hydrogen carbon ratio (4![[thin space (1/6-em)]](https://www.rsc.org/images/entities/char_2009.gif) :1), it gives the lowest COx while producing hydrogen in steam reforming and partial oxidation processes.5 To avoid the vast amount of COx production, thermocatalytic decomposition (TCD) of methane has attracted researchers' attention.1,5,7,8 Besides the energy sector, hydrogen has several uses in electrical, glass, pharmaceutical, and fertilizer industries.1–5,9
:1), it gives the lowest COx while producing hydrogen in steam reforming and partial oxidation processes.5 To avoid the vast amount of COx production, thermocatalytic decomposition (TCD) of methane has attracted researchers' attention.1,5,7,8 Besides the energy sector, hydrogen has several uses in electrical, glass, pharmaceutical, and fertilizer industries.1–5,9
Hydrogen produced via TCD of methane can be directly used in hydrogen fuel cell and ammonia production industries without further purifications. Moreover, carbon produced by this method can also be used for different purposes. Fibrous carbon can be used in construction industries and polymer additives industries. According to Lane and Spath,10 the selling price of hydrogen would be $7–21 per GJ based on the price of natural gas and by-product carbon. Steinberg and Chang estimated that the selling price of hydrogen produced by TCD reaction would be $58 per 1000 m3 as opposed to $67 per 1000 m3 via steam reforming of methane.11 The authors concluded that TCD allows for easier separation of hydrogen and produces solid carbon. Dufour et al. studied different hydrogen production process using life cycle assessment tools and reported that TCD is the most environmentally friendly procedure.12 The energy requirement for TCD reaction is 37.8 kJ mol−1 H2 production, whereas 63 kJ mol−1 H2 is needed for the steam reforming reaction.1
However, TCD process needs a suitable and long-lasting catalyst. Carbon deposition on the active surface of the catalyst causes quick deactivation and makes this process unsuitable for commercial applications. Recently, research efforts were diverted towards figuring out a long-lasting catalyst for this process. Catalysts used in TCD reaction can be divided into two major groups: metal and carbonaceous catalysts. Though metal catalysts give very high initial conversion for TCD reaction, they deactivate very fast with time. The formation of metal carbide is a major challenge for metal or metal-based catalysts. The carbonaceous catalyst overcame this problem and has attracted researchers' attention because of better stability.1,4,13 The primary challenge with methane decomposition is sulfur content. Almost every reservoir of NG contains a small portion of the sulfur compounds. These sulfur compounds are poisonous to metal-based catalysts. Carbonaceous catalysts are resistant to sulfur compounds and can absorb sulfur compounds from the feedstock. Activated carbon (AC), carbon black (CB), coal chars, glossy carbon, multi-walled nanotube (MWNT), graphite, fullerenes have been used as a catalyst in TCD reaction.14,15 Because of higher activity and better stability, AC and CB attracted researchers' attention the most. Muradov et al. studied thirty different carbonaceous materials and found that AC and CB are more active than the ordered ones.16 The carbon catalyst activity has the following order: amorphous > turbostractic > graphite.16 Amorphous carbon (AC and activated biochar) is not well-ordered. An irregular array of carbon bonds create free valences, surface defects, and dislocations. These energetic abnormalities increase high energy active sites for the reactant, and these catalysts will give better performance in TCD reaction.17
To utilize the advantages of both metal and carbonaceous catalysts, researchers are trying to add a small amount of metals on carbon materials. Carbon can be reductive at high temperatures. This ability helps metal oxide for in situ reduction during the pretreatment step.18 A carbon catalyst with a small amount of metal on it (doped or genuinely present) increases its activity greatly. Small metal addition on amorphous carbon creates active high energy sites, which attract stable methane molecule and increase conversion. Prasad et al. doped 5% and 10% Pd on activated carbon (AC). AC-Pd10 gave 50% conversion after 4 h of reaction time, whereas AC-Pd5 gave 30% conversion after 4 h of reaction time.19 Zhang et al. doped Ni on coal and CLR (carbon-loaded rubber) based carbon and obtained stable and consistent conversion than only metal, coal, and CLR based carbon at 850 °C. Ni/Al2O3, Ni/SiO2, and CLR gave 40%, 50%, and 20% initial conversion, which decreased to 10% after 3 h of reaction at 850 °C.20 However, Ni-doped on carbon gave 30% initial conversion, which increased to 80% after 8 h of reaction at 850 °C.21 Hierarchical porous carbon (HPC) with Al2O3 gave 27% initial conversion and this conversion increased to 61% after 10 h of reaction time at 850 °C. Fibrous carbon is produced as by-product in the study.21
Douglas fir is one of the widely harvested biomass in the northern part of the United States.22 Wood industries widely use this biomass since it has the highest strength among all softwoods available in the U.S. In the past, different types of char, especially char made from charcoal was used in TCD of methane (as a catalyst for stable conversion). However, biochar (by-product) produced during pyrolysis process has not been investigated in this regard. Azargohar et al. used fast pyrolysis biochar and activated that with KOH to produce activated biochar.23 According to them, activated carbon, which was produced by fast pyrolysis and went through KOH activation, had a surface area 50 times higher than the starting material. Activated biochar produced from Douglas fir had a large surface area and had different metal oxides (K2O, Na2O, CaO, MgO) in its structure, which makes biochar an excellent catalyst for the decomposition of a stable compound.22 ZSM-5 (Zeolite Socony Mobil-5) is one of the widely used catalysts in different industrial applications. Its networking structure makes it unique to perform as a catalyst. The presence of weak and strong acid sites and large surface area and thermal stability makes zeolite perfect support for a high-temperature reaction. ZSM-5 was used in non-oxidative methane conversion by several researchers.24–26 Nahreen et al. used 3% Ru–ZSM-5 catalyst for non-oxidative methane conversion and obtained 44% conversion even after 60 h of reaction at 800 °C.24 On the other hand, Ru shows the highest sulfur resistance among group 8–10 metal,25 and Ru addition increases sulfur resistance of catalyst.26 According to Arcoya et al., group 8–10 metal catalysts show the following order for sulfur resistance, Pt < Pd < Ni ≪ Rh < Ru.25 According to Ryu et al.,26 the addition of Ru increases the catalyst resistance against sulfur poisoning. Stanley et al. used Pt–Ru alloy to improve sulfur resistance for hydrogenation catalysts.27
Considering all the advantages of Ru, ZSM-5, and activated carbon (commercial), the main objective of this study was to examine the effect of activated biochar derived from Douglas fir and compare the performance of ZSM-5 and activated carbon-supported Ru catalysts for TCD reaction. This study has the potential to find an application of biochar (a by-product from biomass thermochemical conversion) for hydrogen production from greenhouse potent gas.
2 Experimental
2.1 Catalyst preparation
3 wt% Ru was doped on ZSM-5 and activated carbon (AC) (commercial) are denoted as Ru–ZSM-5 and Ru–AC, respectively in this paper. Activated biochar and heat-treated biochar produced from Douglas fir biochar are denoted as AB and HB. Details of catalyst preparation are explained in ESI.†2.2 Experimental set-up and procedure
A fixed bed reactor made of Inconel was used for the reaction. Inconel shows better stability than stainless steel in high-temperature applications, and the reactor had 1/2 in (12.7 mm) outer diameter, 3/8 in (9.53 mm) inside diameter and 21 in (533.5 mm) length.Fig. 1 represents the schematic of methane decomposition experimental set-up. Delta V operating system was used for controlling reactor temperature and reactants flow rate. A fixed bed reactor (top-feed) was connected with feed gases cylinders. An electric heater was used to heat the reactor. Product gases were passed through a heat-exchanger, which was cooled by circulating chilled ethylene glycol and water. The product gases were passed through a micro GC to analyze their composition. A known amount of catalyst was placed in the reactor, and the catalysts were tested at 0.1 weight hourly space velocity (WHSV) using 50% N2 and 50% CH4, and product gases were analyzed at 30 min internal. The catalysts were reduced flowing hydrogen at 10 mL min−1 prior to the reaction. Ru–ZSM-5 was reduced at 500 °C for 5 h; Ru–AC was reduced at 600 °C for 5 h; and AC, AB and HB were reduced at 700 °C for 30 min. After the catalyst reduction, the reactor was set to the desired temperature for decomposition experiments. Details of the pyrolysis reactor and its schematic diagram are provided in ESI.†
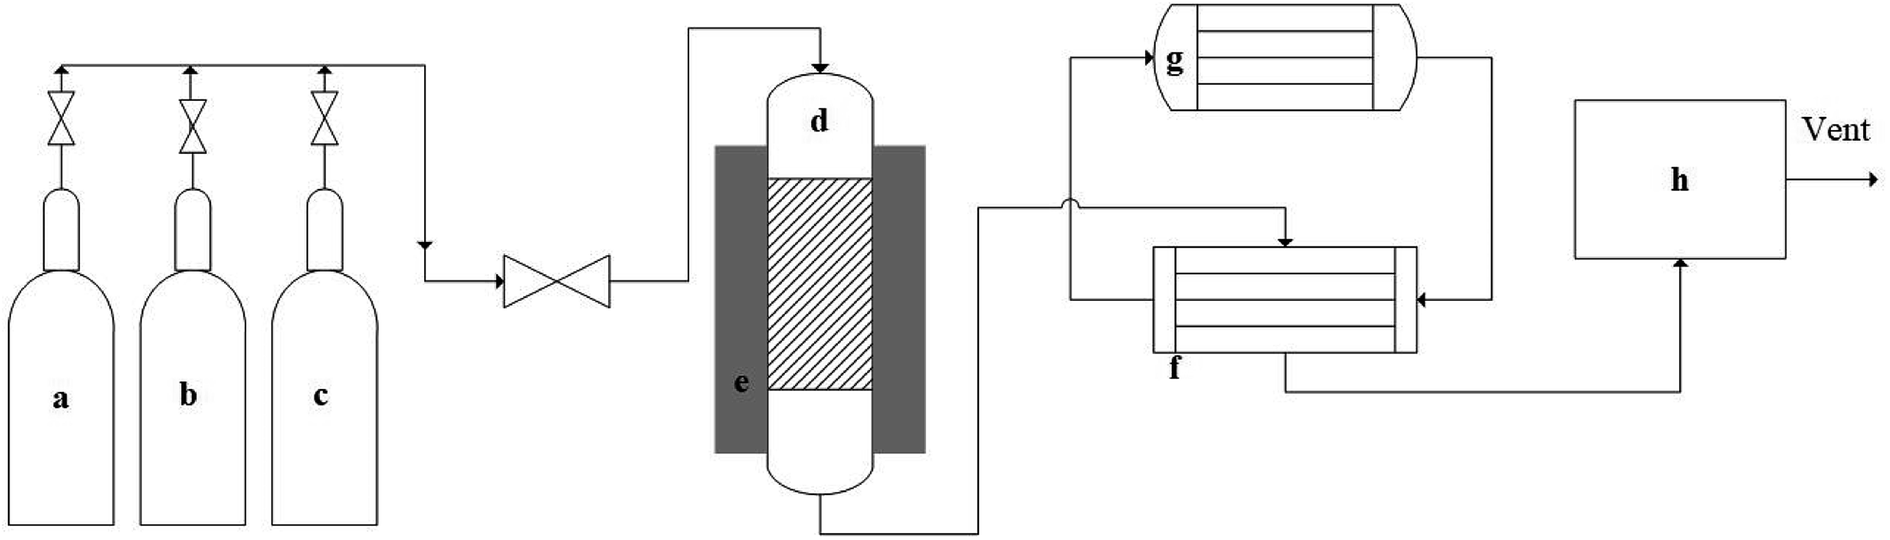 | ||
| Fig. 1 Schematic of experimental set-up for methane decomposition. (a) Nitrogen gas cylinder, (b) hydrogen gas cylinder, (c) methane gas cylinder, (d) fixed bed reactor, (e) electric heater, (f) heat exchanger, (g) chiller, (h) micro-GC. | ||
2.3 Products and catalyst characterization and analysis
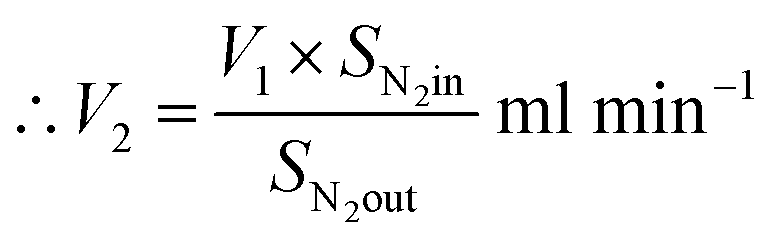
From N2 balances:
| V1 × SN2in = V2 × SN2out |
where, V1 = total inlet flow rate; SN2in = nitrogen inlet concentration; V2 = total product flow rate; SN2out = nitrogen outlet concentration.
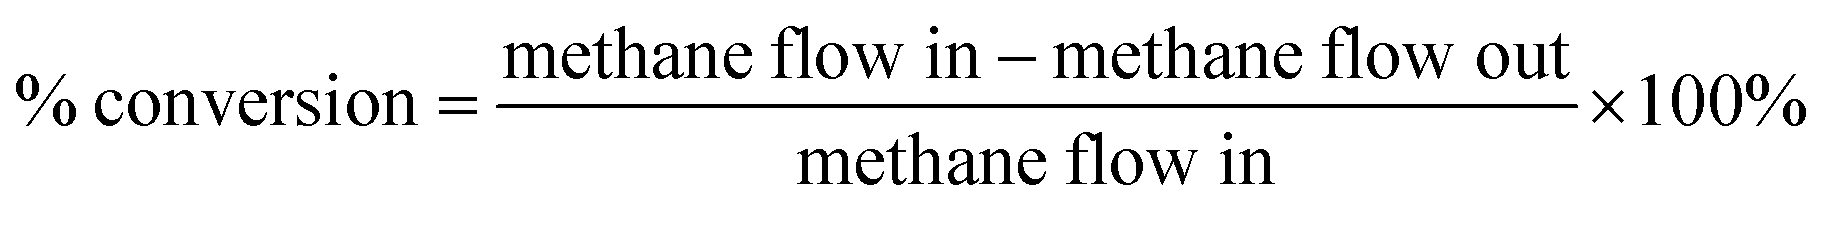
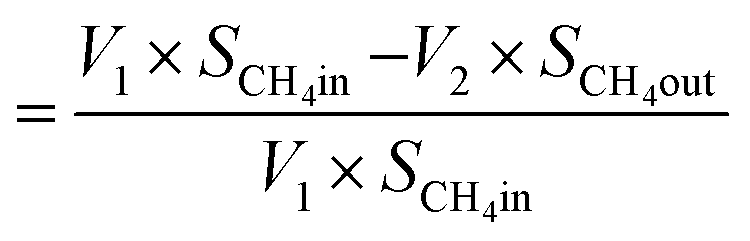
| Now, methane flow in = V1 × SCH4in |
| Methane flow out = V2 × SCH4out |
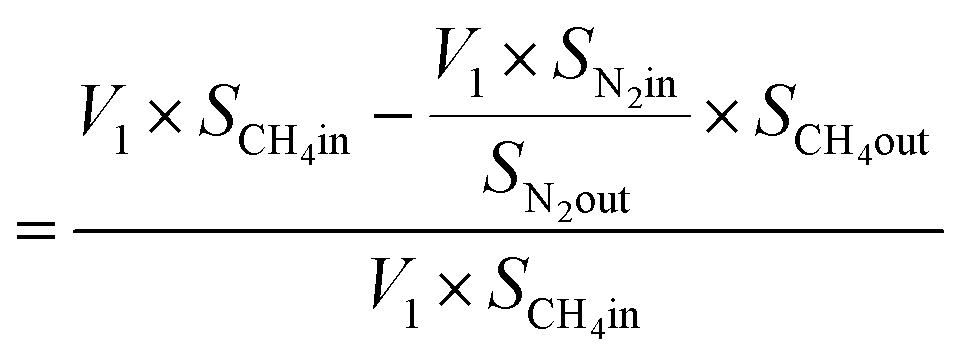
and,
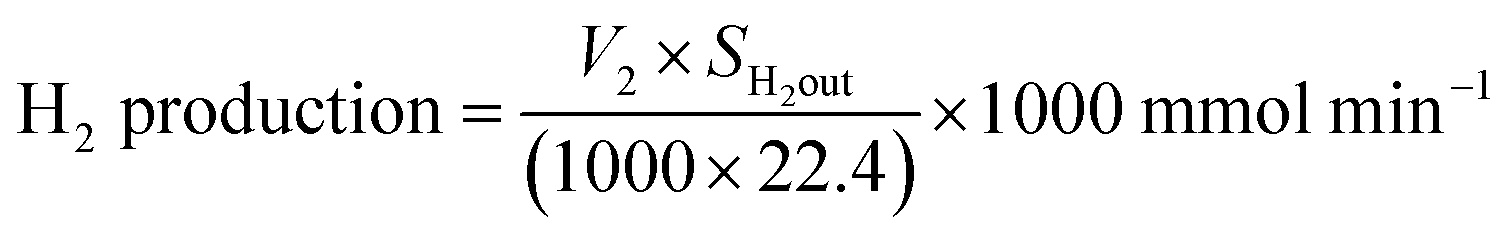
| H2 flow out = V2 × SH2out ml min−1 |
where SH2out = hydrogen outlet concentration.
3 Results and discussions
3.1 Catalyst characterizations
XRD gives an idea about the structure of the catalyst (amorphous and crystalline). Fig. 2(a) represents the XRD pattern for Ru–ZSM-5 and ZSM-5, and sharp peaks in the figure represent the crystalline structure of ZSM-5. The ZSM-5 peaks at 13.59°, 15.14°, 15.91°, 23.38°, 24.16°, 25.63°, and 30.18° that are associated with (102), (131), (022), (051), (313), (323), and (062) planes, respectively. The diffraction peaks matched very well with those reported in the literature and were completely indexed to the ZSM-5 zeolite structure, corresponding to the JCPDS card no. 89-1421. Besides, there are three extra peaks for Ru–ZSM-5 at 28°, 35° and 54°, as these three peaks represent the presence of RuO2 on the catalyst surface.24,28 In the case of Fig. 2(b), broad peaks from 20° to 30° and 40° to 50° indicate the amorphous structure of AC and Ru–AC.29–31 Ru doping did not change the structure of the catalyst, but it just reduced the intensity of the peak. Fig. 2(c) represents the XRD pattern of biochar, HB, and AB. In the XRD pattern for biochar, broad peaks from 20° to 28° and 35° to 50° ensure the amorphous structure. Sharp peaks at 21°, 26°, 50°, 60°, and 68° indicate the presence of turbostratic crystalline carbon and quartz (SiO2) on biochar. A similar pattern was observed for HB with more sharp peaks. Douglas fir biochar has alkali, alkaline earth metals and quartz (SiO2) in its structure.22 The volatile compounds present in biochar were responsible for the reduced height of the peaks. In the case of HB, heat treatment process eliminated all the volatile compounds. Therefore, extra sharp peaks at 36°, 39°, and 43° were observed. All of these peaks indicated the presence of quartz (SiO2).32 On the other hand, a small wide peak from 24° to 26° and a broad peak from 40° to 50° indicated the amorphous structure of AB.30,31 Chemical activation (KOH) eliminated most of the quartz from AB and hence, no quartz peak was observed for AB.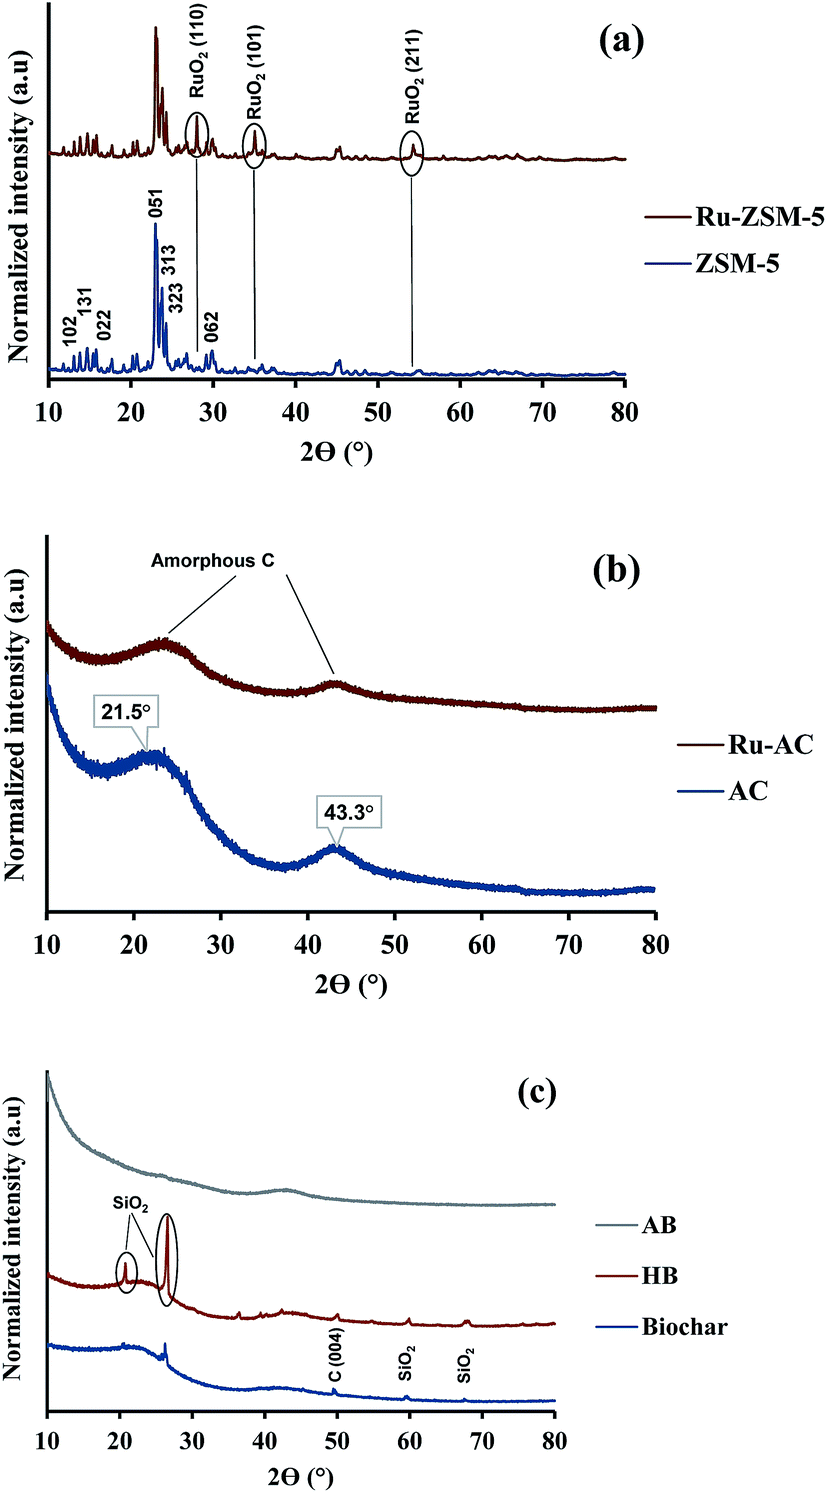 | ||
| Fig. 2 XRD pattern of (a) ZSM-5-based, (b) AC-based, and (c) biochar-based catalysts. | ||
Fig. 3 represents the TPR profiles of different catalysts. There is a small hump at 130 °C for Ru–ZSM-5 which represents the reduction temperature of RuO4. The sharp peak at 189 °C represents the reduction temperature of RuO2. The TPR profile of Ru-oxide was also matched with the literature,24,31 and the reduction was performed at 500 °C for Ru–ZSM-5 catalyst. There is a big sharp peak at 214 °C and a small sharp peak at 327 °C for Ru–AC. These two peaks represent the reduction temperature of RuO4 and RuO2 on AC, respectively. A broad peak at 520 °C represents the presence of impurities on support AC or unknown Ru species.31 To compare this, TPR was performed on AC as well. In order to make sure complete reduction of catalyst occurred prior to methane decomposition, reduction was performed at 600 °C for Ru–AC and at 700 °C for AC. Biochar derived catalysts have ash contents as impurities and some oxygen containing functional groups, and TPR was performed on AB and HB to determine the reduction temperature of those impurities. Ash contents of AB were reduced at 600 °C, whereas ash contents of HB were reduced at 380 °C, 450 °C, and 650 °C (very small humps). The reduction was performed at 700 °C for both of the catalysts (AB and HB). However, carbon catalysts (AC, AB, and HB) showed very small hydrogen consumption. Additionally, small hydrogen consumption for AC, AB and HB could be due to the reduction of oxygen functional groups in those catalysts.
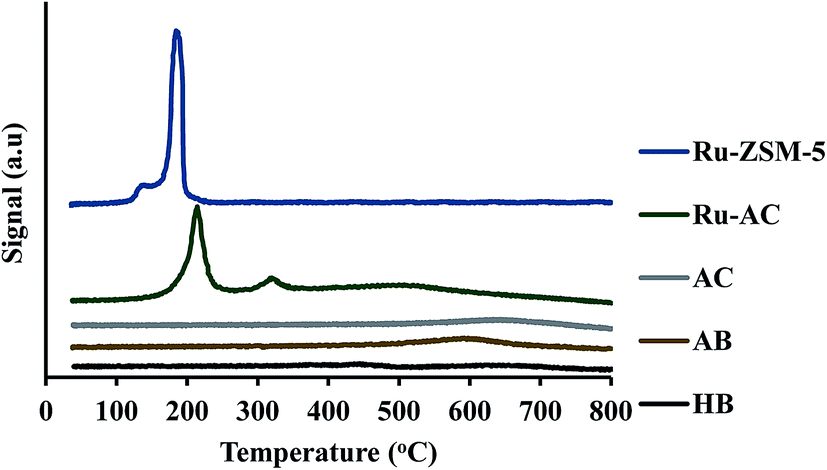 | ||
| Fig. 3 TPR pattern for different catalysts. | ||
ZSM-5 and AC were doped with 3% Ru. The chemisorption was performed to determine the average crystal size of Ru on support. Table 1 represents the chemisorption results for Ru–ZSM-5 and Ru–AC. Ru on AC had slightly higher dispersion, higher specific active surface area and smaller crystallite size. These could be attributed to greater contribution of micropores, mesopores, and macropores to total pore volume in Ru–AC than Ru–ZSM-5 catalyst as discussed later in this document.
| Name of catalysts | Percent of metal dispersion (%) | Specific active metal surface area (m2 g−1) | Average crystallite size (nm) |
|---|---|---|---|
| Ru–ZSM-5 | 2.94 ± 0.08 | 1.07 ± 0.03 | 44.64 ± 1.31 |
| Ru–AC | 3.16 ± 0.04 | 1.15 ± 0.01 | 42.46 ± 0.50 |
Elemental analysis and ash content data are presented in Table 2. In general, biochar and activated biochar have much more carbon than biomass. Around 3.9 ± 0.3%, ash content in AB indicated that chemical activation (KOH) could not eliminate all the alkali and alkaline earth metals. The ash content of HB (7.6 ± 0.3%) was higher than the ash content of biochar (4.8 ± 0.6). Heat-treatment eliminated volatile components and increased the percent of ash content in HB.
| Name | C (%) | H (%) | N (%) | S (%) | Ash (%) |
|---|---|---|---|---|---|
| a ND = not detectable. | |||||
| AB | 84.70 ± 0.5 | 2.80 ± 0.10 | 0.30 ± 0.01 | 0.03 ± 0.02 | 3.9 ± 0.3 |
| HB | 81.9 ± 0.4 | 2.40 ± 0.01 | 0.30 ± 0.01 | ND | 7.6 ± 0.3 |
| Biochar | 84.0 ± 1.0 | 3.70 ± 0.04 | 0.12 ± 0.00 | ND | 4.8 ± 0.6 |
| Biomass | 50.1 ± 0.4 | 7.80 ± 0.05 | 0.02 ± 0.01 | ND | 0.4 ± 0.3 |
| AC | 90.1 ± 0.3 | 1.60 ± 0.10 | 0.30 ± 0.10 | 0.01 ± 0.00 | 4.1 ± 0.4 |
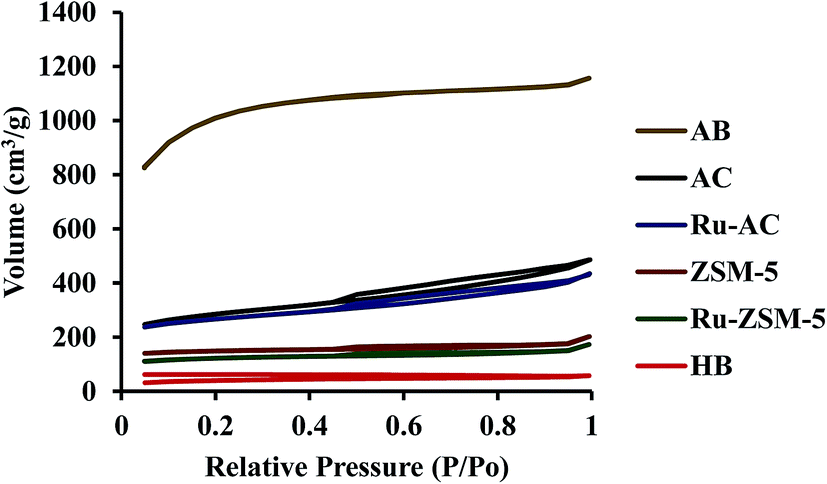
Surface area plays an important role in catalysis. Higher surface area gives higher space for methane molecules to get adsorbed on the catalyst surface. Surface area, pore volume, and average pore size of six catalysts were measured, and presented in Table 3. ZSM-5 and Ru–ZSM-5 showed high micropore structures. Both of the catalysts exhibited type IV isotherm with a hysteresis loop at higher relative pressure (Fig. 4). Initially, capillary condensation of N2 molecules took place on the mesoporous structures of ZSM-5 and Ru–ZSM-5. At high relative pressure (P/Po), N2 desorption from the mesoporous structures became difficult. Therefore, desorption of N2 molecules followed different paths at high P/Po and created a hysteresis loop.30 AC and Ru–AC have micropores and mesopores in their structures, and type IV isotherms were observed for both of the catalysts. AB displayed type I isotherm as it has high microporous structure.
| Name of catalysts | Specific surface area (BET) (m2 g−1) | Pore volume (cm3 g−1) | Average pore size (nm) | |||
|---|---|---|---|---|---|---|
| Micropore | Mesopore | Macropore | Total pore volume | |||
| a Satio–Foley method (SF).b Dollimore–Heal method (DH).c Brunauer–Emmett–Teller (BET).d Density functional theory method (DFT). | ||||||
| Ru–ZSM-5 | 297 ± 0.10 | 0.19 ± 0.00a | 0.07 ± 0.01b | 0.04 ± 0.01b | 0.27 ± 0.01c | 3.65 ± 0.01c |
| ZSM-5 | 363 ± 11.30 | 0.23 ± 0.02a | 0.06 ± 0.01b | 0.04 ± 0.01b | 0.32 ± 0.01c | 3.56 ± 0.01c |
| Ru–AC | 693 ± 3.40 | 0.32 ± 0.01d | 0.26 ± 0.01d | — | 0.65 ± 0.03c | 1.88 ± 0.03c |
| AC | 776 ± 18.60 | 0.35 ± 0.01d | 0.34 ± 0.01d | — | 0.75 ± 0.01c | 1.89 ± 0.02c |
| AB | 3256 ± 42.40 | 1.30 ± 0.03d | 0.29 ± 0.03d | — | 1.78 ± 0.01c | 1.10 ± 0.01c |
| HB | 109 ± 4.20 | — | — | — | 0.09 ± 0.00c | 1.64 ± 0.06c |
 | ||
| Fig. 4 N2 adsorption/desorption profile for different catalysts. | ||
Chemical treatment (KOH) created a microporous structure for AB. Adsorption and desorption isotherms did not match with each other for HB. This type of isotherm indicates that there is no defined pore structure. The reason behind this type of isotherm is that it was easy for N2 molecules to adsorb on the HB surface at high P/Po. At the same time, it was difficult for N2 molecules to desorb from the nonporous structure of HB. Therefore, N2 desorption isotherm followed a different path from the adsorption isotherm. Normally, biochar shows this type of isotherm.33,34 Heat-treatment did not make any changes in N2 adsorption/desorption isotherm for HB. Table 3 presents physical properties of the catalysts tested in this study. Micro, meso, and macropore volumes of different catalysts were calculated by DFT (Density Functional Theory), SF (Satio–Foley), and DH (Dollimore–Heal) methods where appropriate. Micropore and mesopore volumes were subtracted from the total pore volume to calculate macropore volume. Typically, pore diameter less than 2 nm considers as micropore, from 2 nm to 50 nm considers as mesopore and greater than 50 nm considers as macropore.35 ZSM-5 and Ru–ZSM-5 catalysts showed mesopore and micropore. Therefore, the DFT method did not give any results for zeolite catalysts, and the SF method was used to calculate micropore volume for ZSM-5 and Ru–ZSM-5, as SF method only works for micropore. Mesopore and macropore volume of ZSM-5 and Ru–ZSM-5 were calculated by DH method since DH method is widely accepted for calculating mesopore and macropore volume. On the other hand, Ru–AC, AC, and AB showed only micropore and mesopore. Therefore, the DFT method was used for the pore size distribution analysis. HB did not have any defined pore structure. Micropore and mesopore volume could not be calculated for this catalyst. Among the six catalysts, HB gave the lowest surface area (110 ± 5 m2 g−1), whereas AB had the highest surface area (3260 ± 40 m2 g−1). Loading of Ru reduced the surface areas of ZSM-5 and AC. Ru–ZSM-5 had 297 ± 1 m2 g−1 surface area whereas ZSM-5 gave 360 ± 10 m2 g−1. On the other hand, Ru–AC had 690 ± 5 m2 g−1 surface area, and AC had 780 ± 20 m2 g−1 surface area.
Fig. 5 represents SEM image of fresh catalysts. SEM image of fresh ZSM-5 and fresh Ru–ZSM-5 catalysts were captured by using backscatter electrons. By comparing these two images, it is noticeable that white dots are uniformly distributed on Ru–ZSM-5, indicate Ru-metal was uniformly distributed on ZSM-5. Normally, backscatter electrons are used to distinguish two phases in SEM image. A secondary electron detector was used to capture the images of fresh AC and Ru–AC catalysts. Since carbon is a very small molecule, the energy released by backscatter electron cannot be captured on the detector. Therefore, it was not possible to separate Ru and AC phases on SEM. There is no major difference between the SEM images of fresh AC, Ru–AC, AB, and HB. Particle sizes are bigger for AC and Ru–AC. EDS (energy dispersion spectroscopy) analysis was performed to estimate the composition of different catalysts. Tables 4 and 5 represent the composition of Ru–ZSM-5 and Ru–AC. Results from EDS analysis ensured that around 3% Ru was on both catalysts.
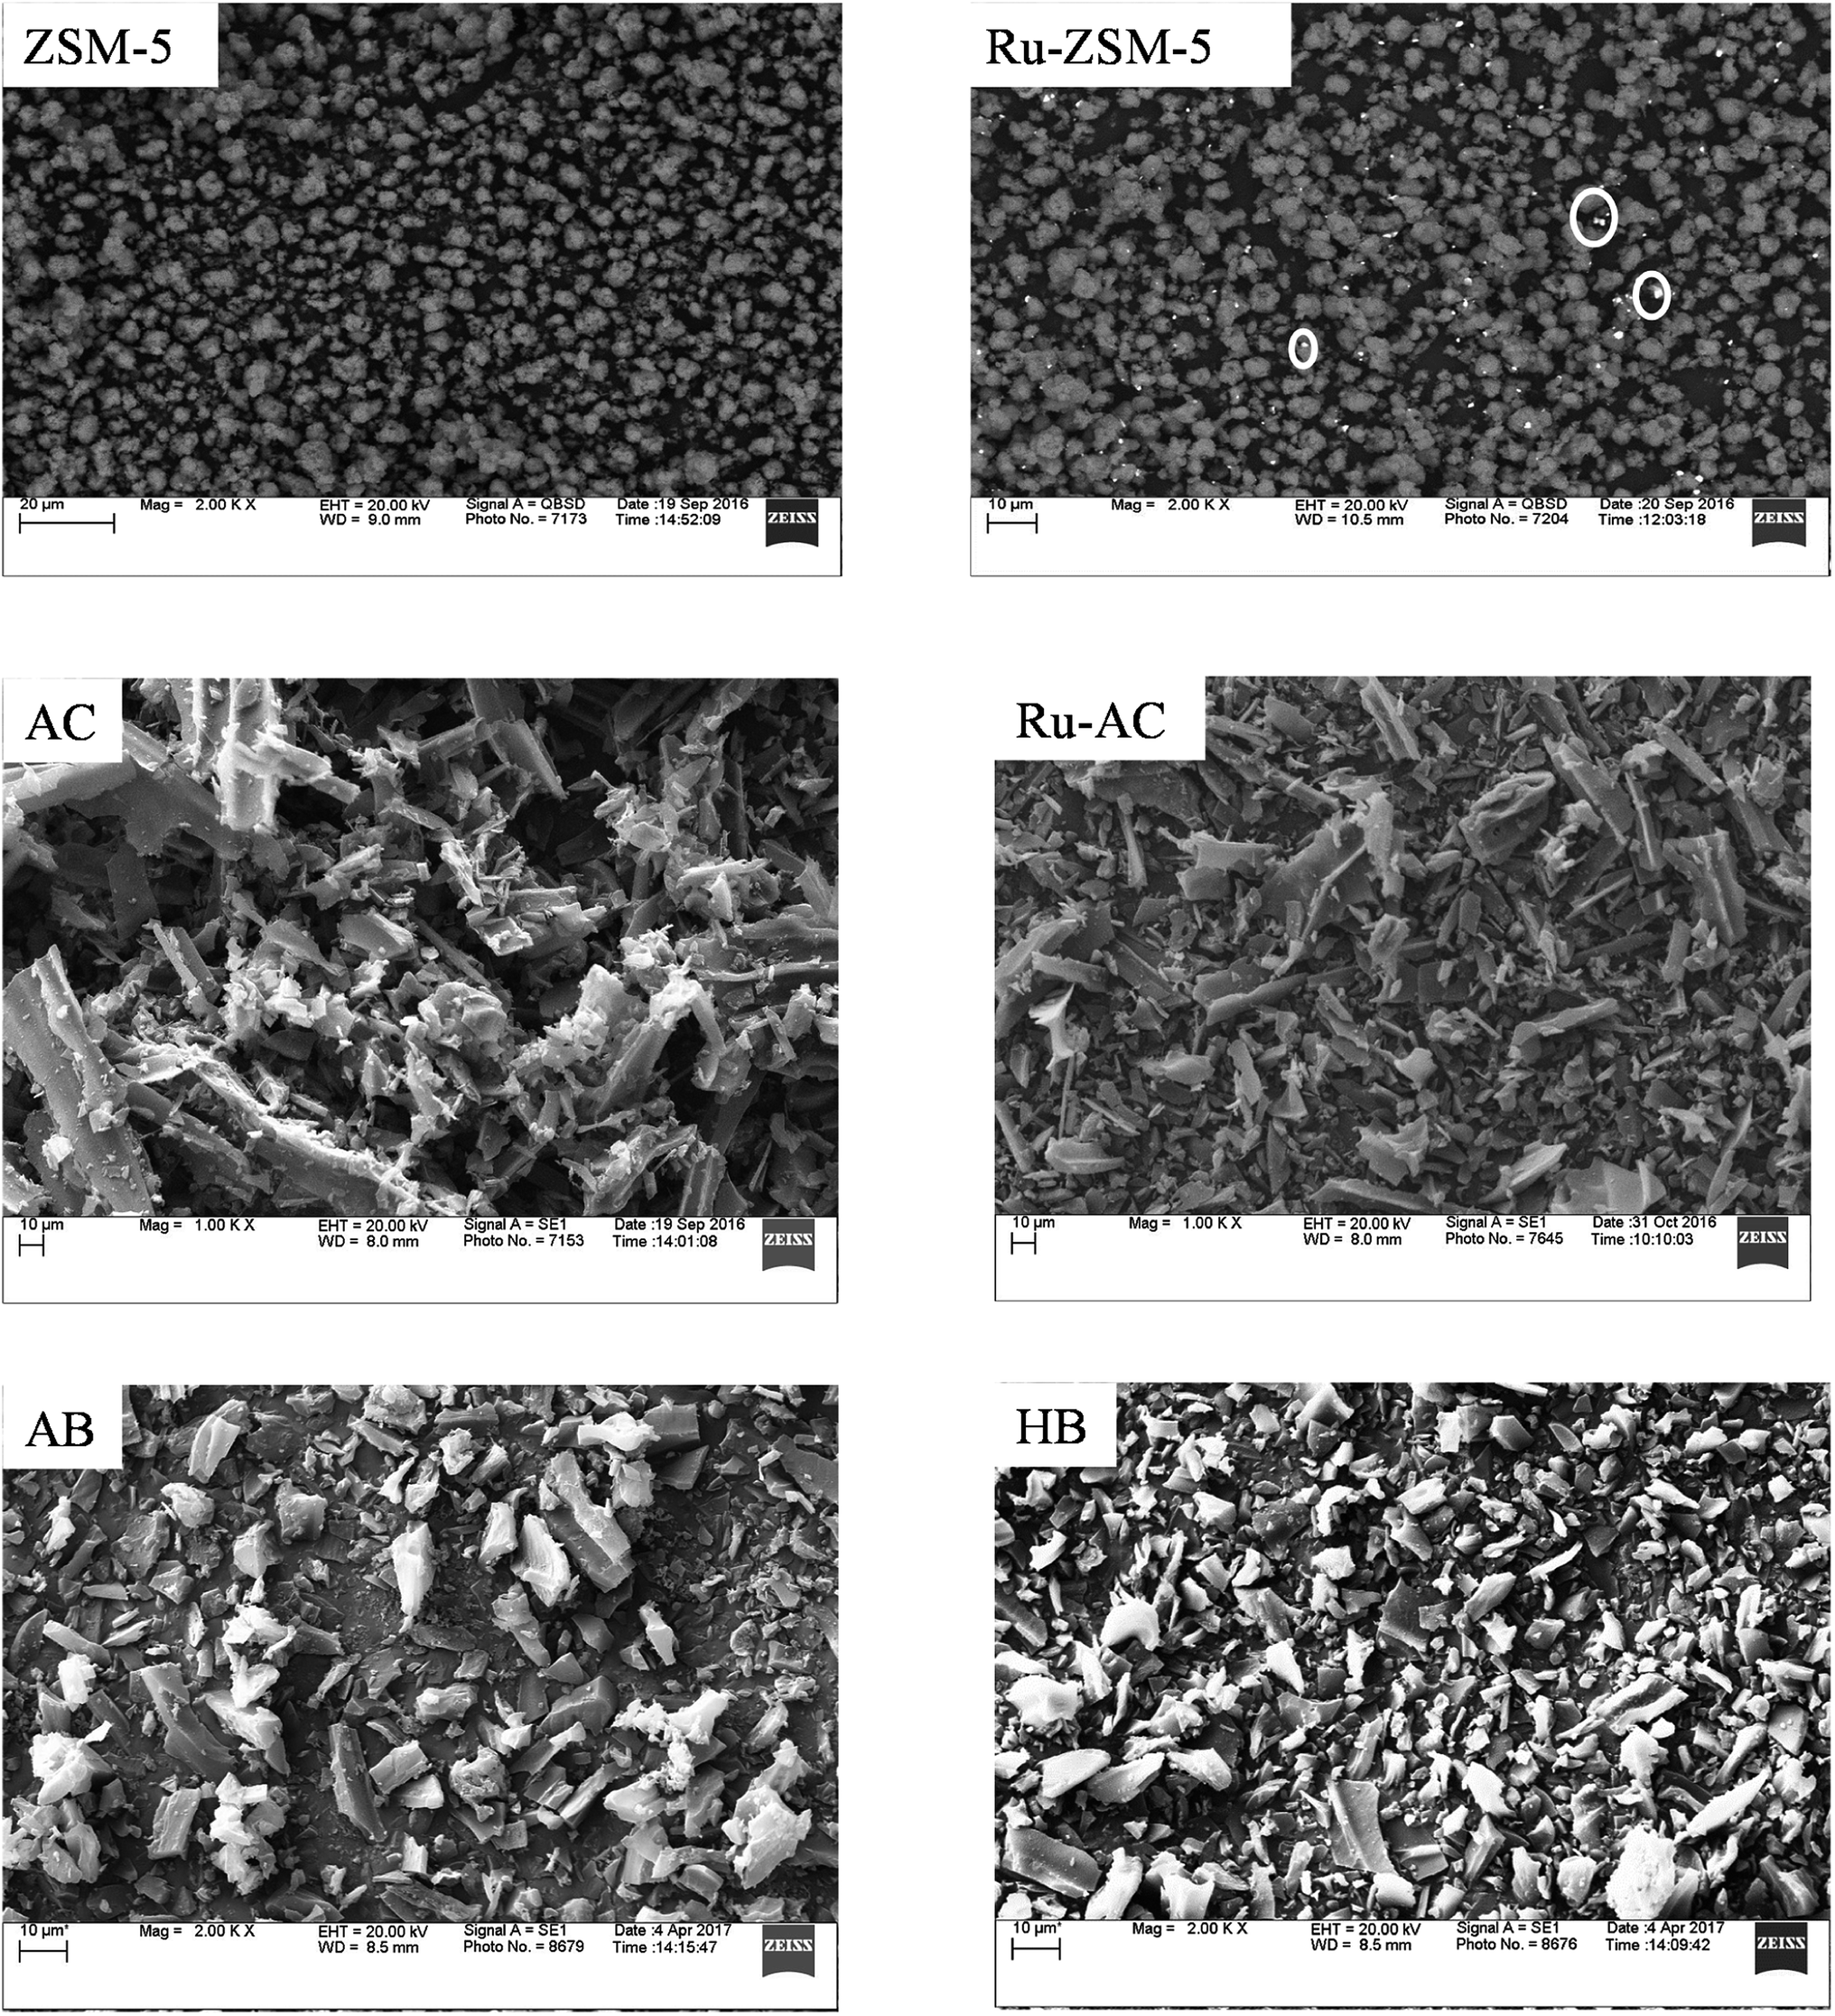 | ||
| Fig. 5 SEM image of fresh catalysts. | ||
| Element | Weight% | Atomic% |
|---|---|---|
| O | 58.09 ± 0.12 | 71.50 ± 0.10 |
| Al | 2.09 ± 0.06 | 2.09 ± 0.06 |
| Si | 36.05 ± 0.14 | 25.42 ± 0.12 |
| Ru | 3.01 ± 0.02 | 0.59 ± 0.01 |
| Element | Weight% | Atomic% |
|---|---|---|
| C | 86.69 ± 1.16 | 91.37 ± 0.94 |
| O | 10.44 ± 1.14 | 8.27 ± 0.93 |
| Ru | 2.90 ± 0.07 | 0.36 ± 0.01 |
3.2 Reaction results
Fig. 6 represents the total amount of hydrogen produced in the reaction. Hydrogen production graph followed the same sequence as the conversion graph. Initial hydrogen yields were low in every case. According to literature,1 most of the activated carbon has carbon–oxygen groups in structure. Product hydrogen gas might have been consumed by these functional group in first few hours of reaction although very little hydrogen was consumed by the carbon based catalysts as seen from the TPR results. Ru–ZSM-5 gave 0.14 mmol min−1 of hydrogen production, whereas ZSM-5 gave 0.07 mmol min−1 of hydrogen production after 8 h of reaction time. Ru–AC produced 0.26 mmol min−1 of hydrogen whereas AC produced 0.18 mmol min−1 of hydrogen after 8 h of reaction time. AB produced 0.23 mmol min−1 of hydrogen production after 8 h of the reaction. In the case of HB, it was 0.14 mmol min−1, same as Ru–ZSM-5 after 8 h of the reaction. Hydrogen yields were above 90% for all of the catalysts at 800 °C and 0.1 WHSV.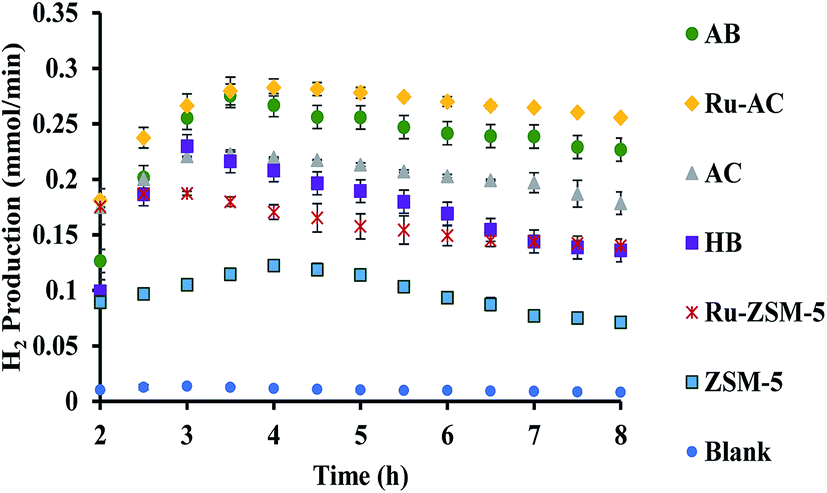 | ||
| Fig. 6 H2 production results for different catalysts at 800 °C and 0.1 WHSV. | ||
Methane conversion for different catalysts at 800 °C and 0.1 WHSV is presented in ESI (Fig. S9†). Blank run indicates the reaction without any catalyst at 800 °C in an empty reactor. Around 2–3% methane was converted in a blank run. Normally, methane should not be converted at that temperature without any catalyst.4 However, the reactor has Ni and Fe as its components and that might have caused a small conversion of methane. ZSM-5 gave 21% conversion after 8 h of reaction time. After being doped with Ru, ZSM-5 gave 40% conversion at the same time of reaction. Ru enhanced the catalytic activity of ZSM-5 by 20%. Ru metal particles give electron to zeolite surface sites, and zeolite channels confined with small particles are electron deficient. This electrophilic character enhance the activity of zeolite supported catalyst.36 On the other hand, AC alone gave 51% conversion after 8 h of reaction time, whereas Ru–AC gave 73% conversion at the same amount of reaction time. Methane conversion for AB was 69% after 8 h of reaction time. The high surface area and the presence of ash contents on the structure of AB were probably the reasons for this higher conversion. Just HB gave 41% conversion after the same time of reaction time. HB has a low surface area compared to Ru–ZSM-5 and ZSM-5. Additionally, the influence of feeding rate at 0.4 WHSV suggested good methane conversion and hydrogen production on AB and Ru–AC performed the best (see Fig. S9 in ESI†).
Among six different catalysts, AB and Ru–AC exhibited the highest conversions after 8 h of reaction time. Therefore, these catalysts were tested to determine long-term catalytic stability. Fig. 7 shows methane conversion reaction results on AB and Ru–AC for 60 h. Methane conversion was higher for Ru–AC than AB for the first 14 h. However, the conversion was decreasing steadily with time and after 60 h, the methane conversion was 21%. Although the methane conversion was decreasing rapidly for the first 10 h with AB, the conversion remained pretty stable after that and the conversion was 51% at the end of 60 h run.
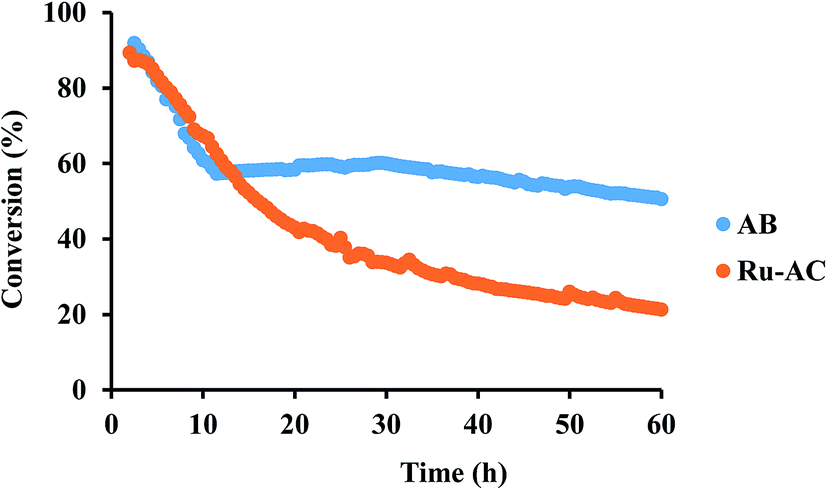 | ||
| Fig. 7 Catalytic behavior of Ru–AC and AB at 800 °C and 0.1 WHSV in 60 h reaction run. | ||
Metal–support interaction plays an important role in CNT growth as well as catalyst deactivation. If metal–support interaction is weak, then metal particles detach from the support. Detach metal particles localize at the tip of the nanotubes. This type of phenomena causes separation of the metal particles from support and catalyst deactivates with time. For strong metal–support interaction, the metal particle does not separate from support and the deactivation rate is slow.37 Since Ru–AC catalyst was prepared by the wet impregnation method, weak metal–support interaction presented between Ru and AC. Production of nanotube (Fig. 8) caused separation of Ru particles from AC. With time, Ru particles were covered by carbon. All these phenomena were responsible for deactivation in the long run. Ash contents are part of biochar structure. In case of AB, strong metal–support interaction presented between ash content and carbon. CNTs growth (Fig. 8) could not separate the metal particle from carbon support. As a catalyst, Ru always exhibits good conversion but Ru–AC has a comparatively low surface area (693 m2 g−1). AB has a large surface area (3256 m2 g−1). This large surface area accommodated product carbon for the long reaction time. AB has 82% microporous structure. According to Krzyżyński et al. higher surface area and higher pore volume give higher resistant to catalyst deactivation.38 Ashok et al. and Dhunker and Ortmann concluded that methane decomposition mainly occur at micropores.39–41 According to Kim et al., methane decomposition rate is higher for smaller particles and it occurs on outer shell of catalyst particles.42 For larger particles, pore mouth blocked by carbon deposition while inner area remain intact. After 8 h of reaction, the surface area of AB was reduced to 1893 m2 g−1 (Table 6). Surface area reduction by 8 h of reaction was 170 m2 g−1 h−1 whereas surface area reduction by rest of 52 h of reaction was 22 m2 g−1 h−1. After 60 h of reaction, AB still had higher surface area (746 m2 g−1) than fresh Ru–AC (693 m2 g−1). Product CNTs have catalytic ability for methane conversion. Several researchers had used CNTs as catalyst for methane conversion.1,4,16,43 Product carbon create new active sites for TCD by growing outside of catalyst pore.1 Product CNTs took part in auto catalysis.20,21 The initial high surface area and the CNTs growth in AB could contribute to a stable conversion pattern in the long reaction run. Ru–AC showed 50% micropore and 50% mesopore in its structure whereas mainly micropores were contributed for methane conversion.38,39 Sometimes, mouth of larger pores block with product carbon without using the inside surface area.42 Though Ru–AC had comparable methane conversion in the beginning, the effect of Ru addition diminished in the long run. Because of lower conversion, production of CNTs were also low and those CNTs were attached with catalyst pores (blocked active pore of catalyst). Therefore, auto catalysis reaction rate was comparatively low for Ru–AC.
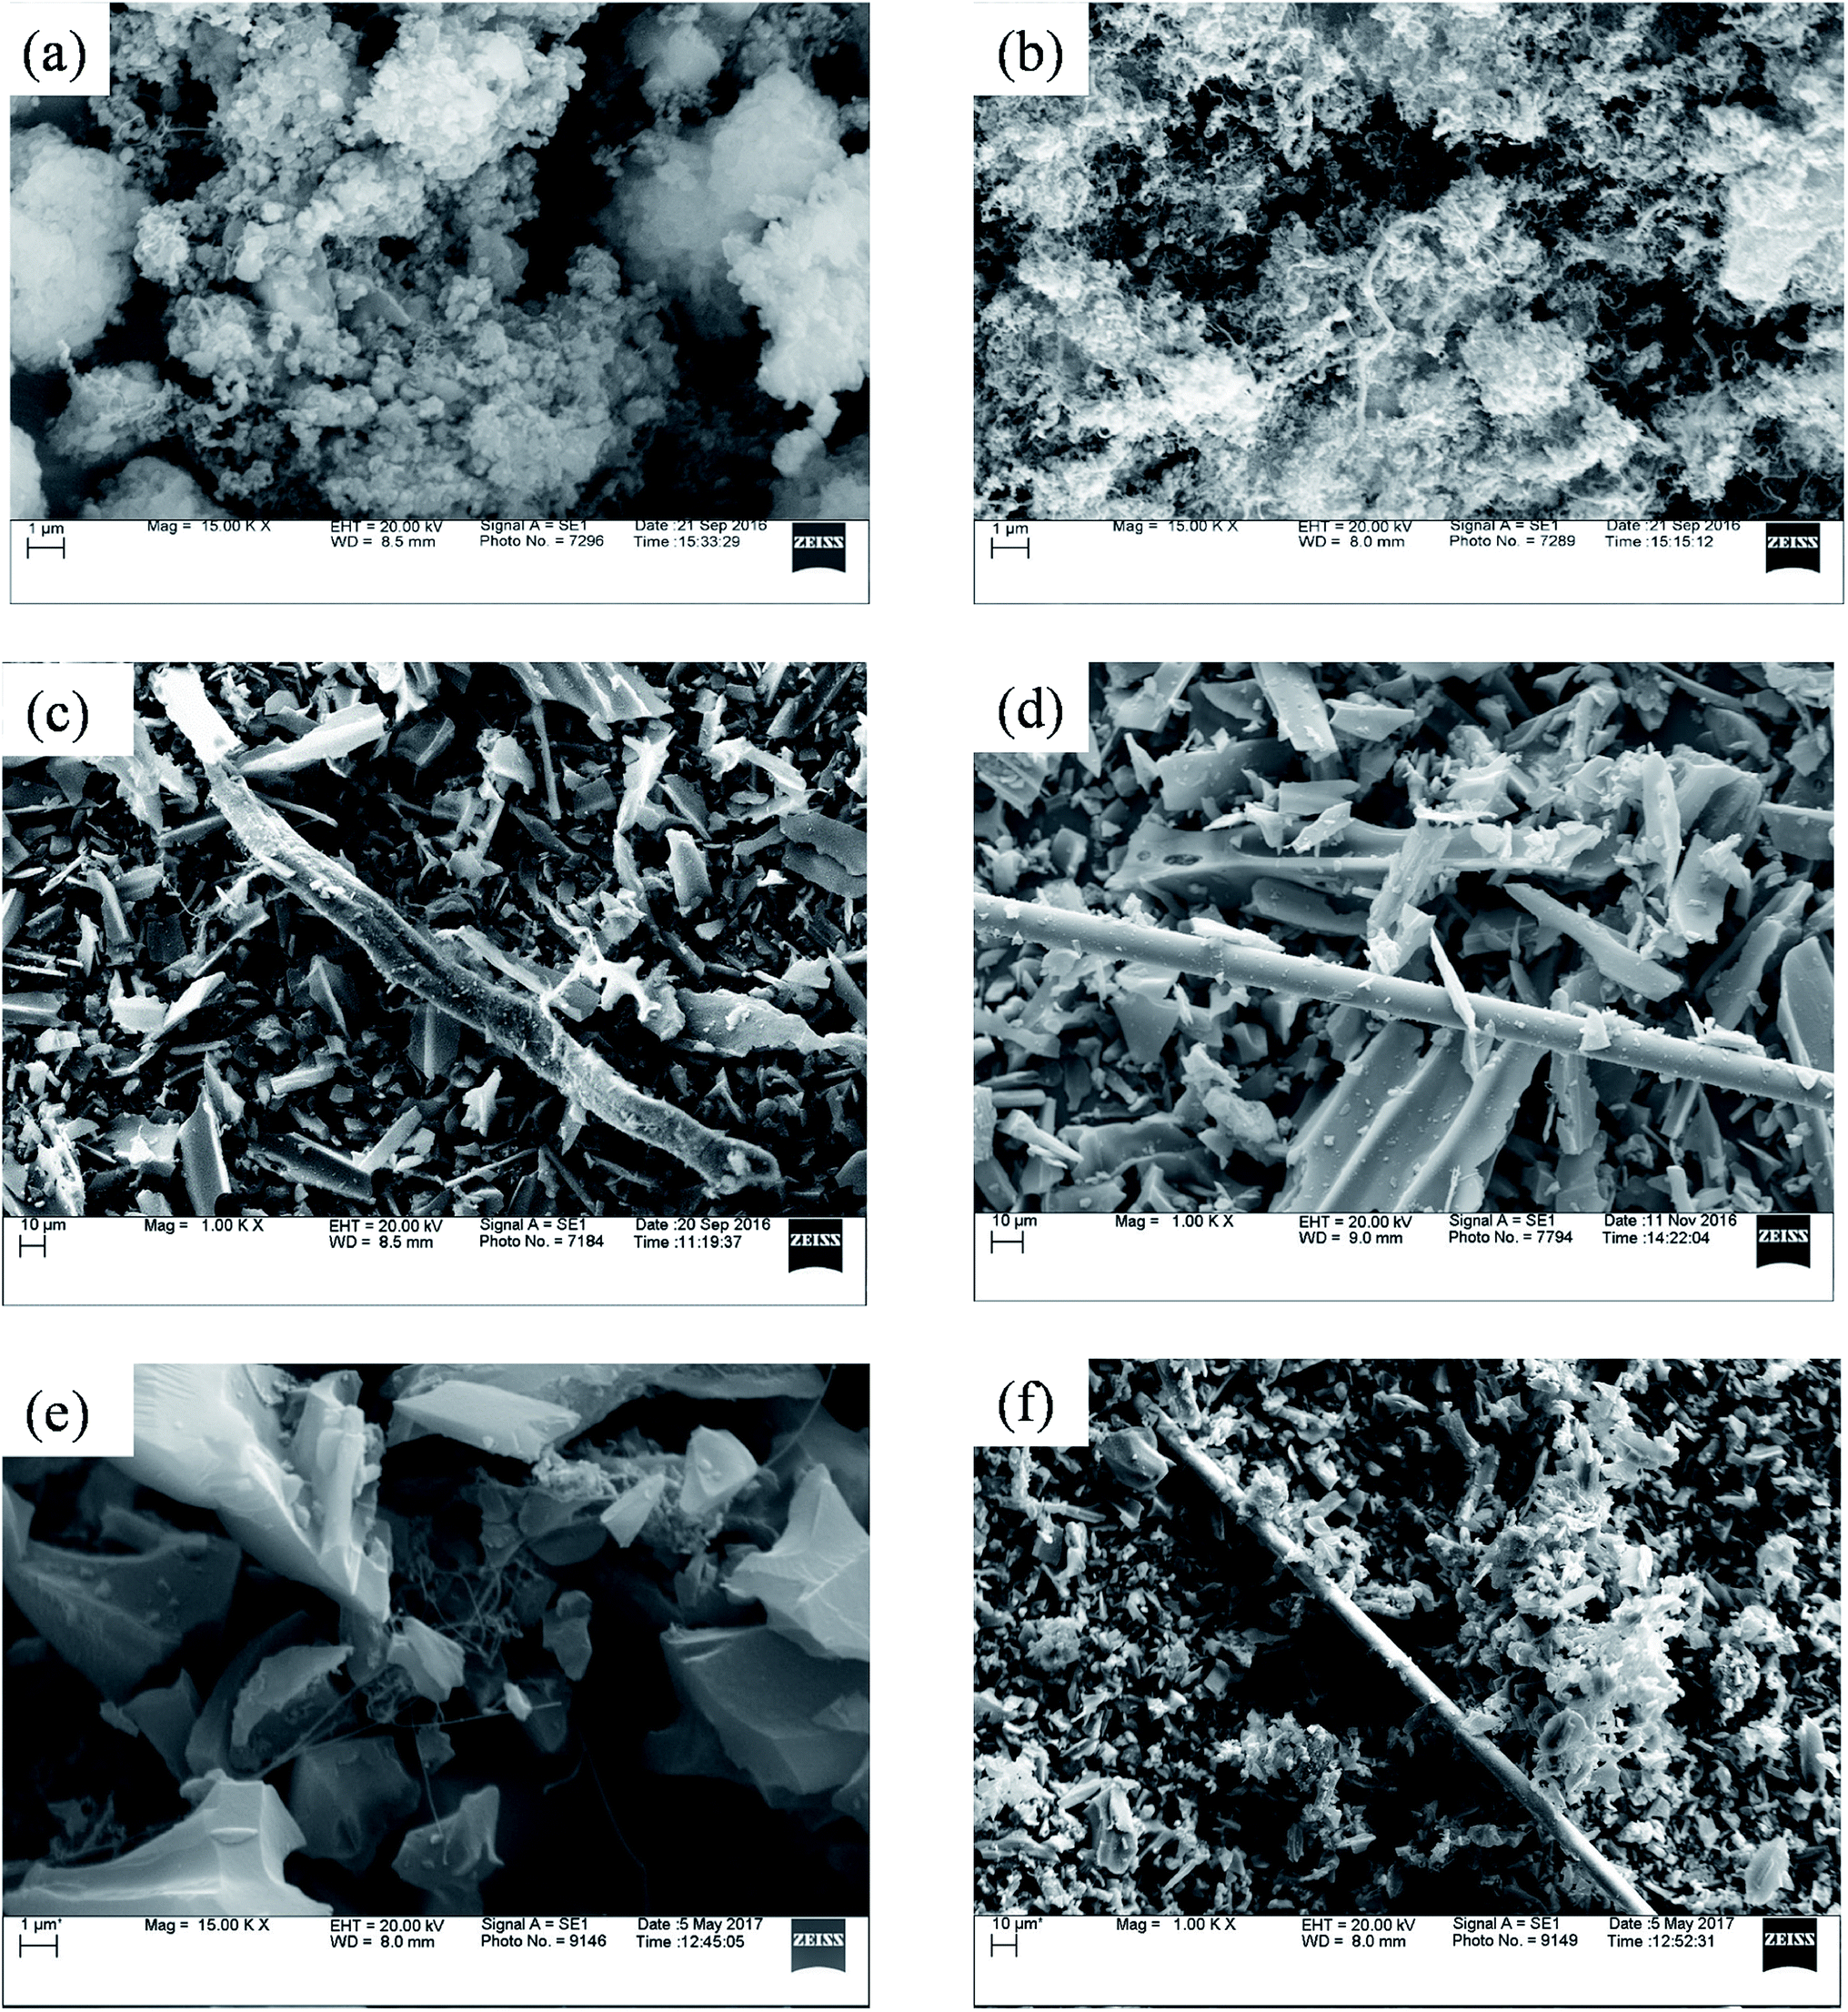 | ||
| Fig. 8 SEM image of spent catalysts at 800 °C and 0.1 WHSV: (a) spent ZSM-5 after 8 h, (b) spent Ru–ZSM-5 after 8 h, (c) spent AC after 8 h, (d) spent Ru–AC after 60 h, (e) spent AB after 60 h, (f) spent HB after 8 h. | ||
| Name | Specific surface area (BET) (m2 g−1) | Pore volume (cm3 g−1) (DFT) | ||
|---|---|---|---|---|
| Micropore | Mesopore | Total pore | ||
| Fresh AB | 3256 | 1.30 | 0.29 | 1.59 |
| After 8 h | 1893 | 0.74 | 0.22 | 0.96 |
| After 60 h | 746 | 0.29 | 0.10 | 0.39 |
3.3 Carbon produced in reaction
Carbon produced in the reactions were analyzed by SEM and TEM. Fig. 8 represents the SEM image of different spent catalysts after reaction at 800 °C. A big tube structure with lots of small tube structures were observed in this SEM image. Fig. 9 represents the TEM image of different spent catalysts after reaction at 800 °C. After analyzing SEM (Fig. 8(a) and (b)) and TEM (Fig. 9(a) and (b)) image, it was confirmed that carbon nano-tubes (CNTs) were producing with ZSM-5 and Ru–ZSM-5 catalysts. For the TEM image of these two catalysts, produced carbons were separated from the catalysts and crushed to fine powder. In zeolite, metal ions are impregnated only in ion exchange and are accessible only for the small molecule, which has the diameter less than pore diameter and the only product with the small diameter less than pore diameter can exit pore channel of the catalyst. So, CNTs growth can be possible only on the outer surface metal particle of zeolites. That is why zeolite gives less conversion as well as less CNTs. Because catalyst surface is easily blocked with CNTs and become non-accessible within few hours of reactions.44,45 After analyzing SEM (Fig. 8(c) and (d)) and TEM (Fig. 9(c) and (d)) images, it can be concluded that carbon produced by AC had a turbostratic structure whereas 3% Ru doping on AC caused CNT production. For TEM analysis, spent catalysts were crushed to fine powder, and from SEM (Fig. 8(e)) and TEM (Fig. 9(e)) image of AB, it can be concluded that CNTs were produced by AB. The similar SEM image was observed for HB (Fig. 8(f)) as observed for Ru–AC (Fig. 8(d)). However, it was not possible to observe any CNTs in the TEM image.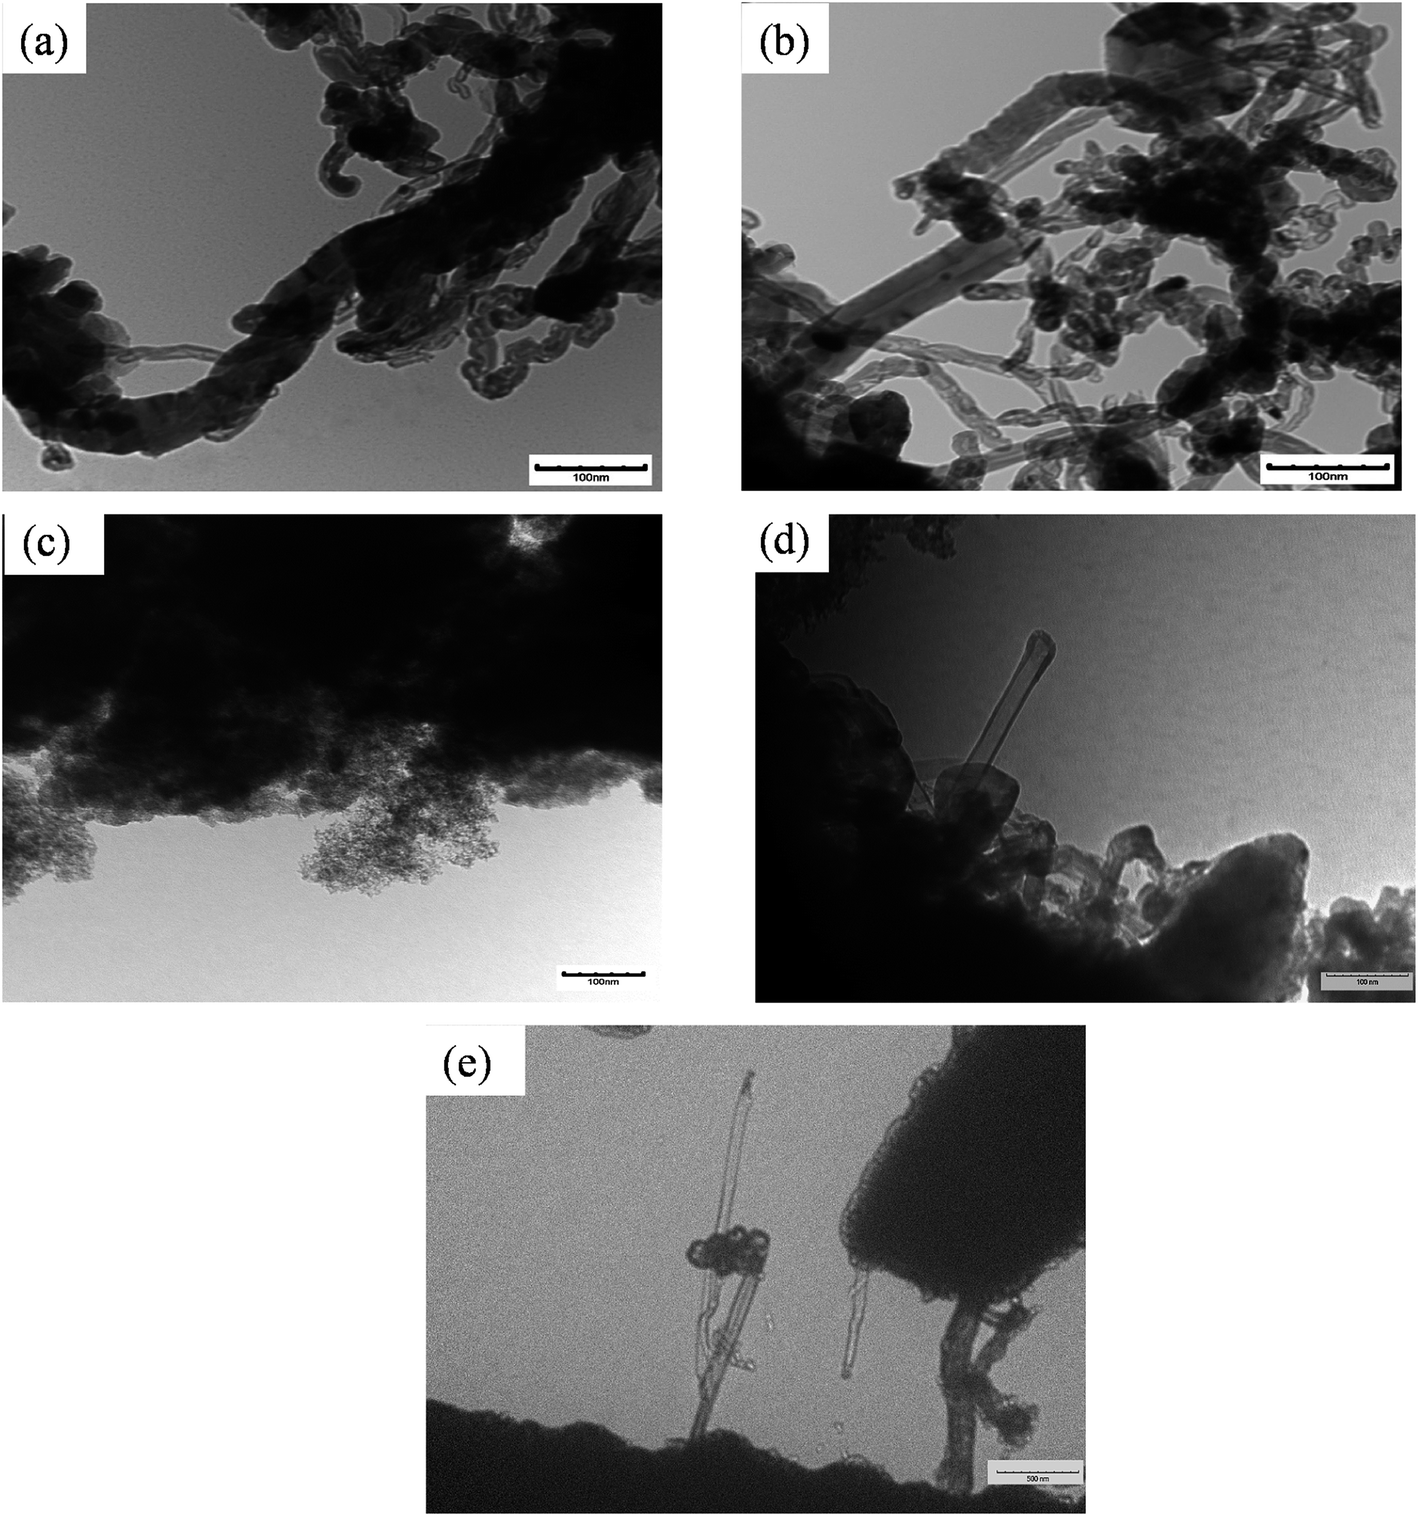 | ||
| Fig. 9 TEM image of spent catalysts: (a) spent ZSM-5 after 8 h, (b) spent Ru–ZSM-5 after 8 h, (c) spent AC after 8 h, (d) spent Ru–AC after 60 h, and (e) spent AB after 60 h. | ||
4 Conclusions
Six catalysts were studied for TCD of methane at 800 °C and atmospheric pressure in a fixed bed reactor. The results showed that 3% Ru enhanced the activity of both ZSM-5 and activated carbon. On the other hand, activated biochar (AB) exhibited similar conversion as Ru–AC. Among the six catalysts, Ru–AC and AB showed the highest conversion. Ru–AC achieved 21% methane conversion; whereas, AB gave 51% conversion after 60 h of reaction time. It can be concluded that biochar derived from Douglas fir has a great potentials to be used as a catalyst for TCD of methane to produce hydrogen.Conflicts of interest
There are no conflicts to declare.Acknowledgements
This work was supported by the Alabama Agricultural Experiment Station and the Hatch Program (ALA014-1-19068) of the National Institute of Food and Agriculture, U.S. Department of Agriculture.References
- H. F. Abbas and W. W. Daud, Hydrogen production by methane decomposition: a review, Int. J. Hydrogen Energy, 2010, 35(3), 1160–1190 CrossRef CAS.
- J. D. Holladay, J. Hu, D. L. King and Y. Wang, An overview of hydrogen production technologies, Catal. Today, 2009, 139(4), 244–260 CrossRef CAS.
- R. Ramachandran and R. K. Menon, An overview of industrial uses of hydrogen, Int. J. Hydrogen Energy, 1998, 23(7), 593–598 CrossRef CAS.
- U. Ashik, W. W. Daud and H. F. Abbas, Production of greenhouse gas free hydrogen by thermocatalytic decomposition of methane – a review, Renewable Sustainable Energy Rev., 2015, 44, 221–256 CrossRef CAS.
- Y. Li, D. Li and G. Wang, Methane decomposition to COx-free hydrogen and nano-carbon material on group 8–10 base metal catalysts: a review, Catal. Today, 2011, 162(1), 1–48 CrossRef CAS.
- R. Lan, J. T. Irvine and S. Tao, Ammonia and related chemicals as potential indirect hydrogen storage materials, Int. J. Hydrogen Energy, 2012, 37(2), 1482–1494 CrossRef CAS.
- R. M. Navarro, M. Pena and J. Fierro, Hydrogen production reactions from carbon feedstocks: fossil fuels and biomass, Chem. Rev., 2007, 107(10), 3952–3991 CrossRef CAS.
- H. Jahromi and F. A. Agblevor, Hydrodeoxygenation of pinyon-juniper catalytic pyrolysis oil using red mud-supported nickel catalysts, Appl. Catal., B, 2018, 236, 1–12 CrossRef CAS.
- V. Patil, S. Adhikari, P. Cross and H. Jahromi, Progress in the solvent depolymerization of lignin, Renewable Sustainable Energy Rev., 2020, 133, 110359 CrossRef CAS.
- J. Lane and P. Spath, Technoeconomic analysis of the thermocatalytic decomposition of natural gas, National Renewable Energy Lab., Golden, CO, US, 2001 Search PubMed.
- M. Steinberg and H. C. Cheng, Modern and prospective technologies for hydrogen production from fossil fuels, Int. J. Hydrogen Energy, 1989, 14(11), 797–820 CrossRef CAS.
- J. Dufour, D. Serrano, J. Galvez, J. Moreno and C. Garcia, Life cycle assessment of processes for hydrogen production. Environmental feasibility and reduction of greenhouse gases emissions, Int. J. Hydrogen Energy, 2009, 34(3), 1370–1376 CrossRef CAS.
- H. Jahromi and F. A. Agblevor, Hydrodeoxygenation of aqueous-phase catalytic pyrolysis oil to liquid hydrocarbons using multifunctional nickel catalyst, Ind. Eng. Chem. Res., 2018, 57(39), 13257–13268 CrossRef CAS.
- A. Malaika and M. Kozłowski, Influence of ethylene on carbon-catalysed decomposition of methane, Int. J. Hydrogen Energy, 2009, 34(6), 2600–2605 CrossRef CAS.
- A. Dufour, A. Celzard, V. Fierro, E. Martin, F. Broust and A. Zoulalian, Catalytic decomposition of methane over a wood char concurrently activated by a pyrolysis gas, Appl. Catal., A, 2008, 346(1–2), 164–173 CrossRef CAS.
- N. Muradov, Catalysis of methane decomposition over elemental carbon, Catal. Commun., 2001, 2(3–4), 89–94 CrossRef CAS.
- M. H. Kim, E. K. Lee, J. H. Jun, S. J. Kong, G. Y. Han and B. K. Lee, et al., Hydrogen production by catalytic decomposition of methane over activated carbons: kinetic study, Int. J. Hydrogen Energy, 2004, 29(2), 187–193 CrossRef CAS.
- P. Jana, A. Víctor, J. M. Coronado and D. P. Serrano, Cobalt based catalysts prepared by Pechini method for CO2-free hydrogen production by methane decomposition, Int. J. Hydrogen Energy, 2010, 35(19), 10285–10294 CrossRef CAS.
- J. S. Prasad, V. Dhand, V. Himabindu, Y. Anjaneyulu, P. K. Jain and B. Padya, Production of hydrogen and carbon nanofibers through the decomposition of methane over activated carbon supported Pd catalysts, Int. J. Hydrogen Energy, 2010, 35(20), 10977–10983 CrossRef CAS.
- J. Zhang, L. Jin, Y. Li and H. Hu, Ni doped carbons for hydrogen production by catalytic methane decomposition, Int. J. Hydrogen Energy, 2013, 38(10), 3937–3947 CrossRef CAS.
- J. Zhang, L. Jin, Y. Li, H. Si, B. Qiu and H. Hu, Hierarchical porous carbon catalyst for simultaneous preparation of hydrogen and fibrous carbon by catalytic methane decomposition, Int. J. Hydrogen Energy, 2013, 38(21), 8732–8740 CrossRef CAS.
- S. Link, S. Arvelakis, M. Hupa, P. Yrjas, I. Külaots and A. Paist, Reactivity of the biomass chars originating from reed, Douglas fir, and pine, Energy Fuels, 2010, 24(12), 6533–6539 CrossRef CAS.
- R. Azargohar and A. Dalai, The direct oxidation of hydrogen sulphide over activated carbons prepared from lignite coal and biochar, Can. J. Chem. Eng., 2011, 89(4), 844–853 CrossRef CAS.
- S. Nahreen, S. Praserthdam, S. Perez Beltran, P. B. Balbuena, S. Adhikari and R. B. Gupta, Catalytic upgrading of methane to higher hydrocarbon in a nonoxidative chemical conversion, Energy Fuels, 2016, 30(4), 2584–2593 CrossRef CAS.
- A. Arcoya, X. L. Seoane, N. S. Figoli and P. C. L'Argentiere, Relationship between sulphur resistance and electronic state of the metal on supported palladium catalysts, Appl. Catal., 1990, 62(1), 35–45 CrossRef CAS.
- C. K. Ryu, M. W. Ryoo, I. S. Ryu and S. K. Kang, Catalytic combustion of methane over supported bimetallic Pd catalysts: effects of Ru or Rh addition, Catal. Today, 1999, 47(1–4), 141–147 Search PubMed.
- J. N. Stanley, K. Worthington, F. Heinroth, A. F. Masters and T. Maschmeyer, Reversible bimetallic Pt-Ru alloy hydrogenation catalysts with improved sulfur tolerance, Chemeca 2011: Engineering a Better World, Sydney Hilton Hotel, NSW, Australia, 18–21 September 2011, p. 593 Search PubMed.
- S. Kaliaguine, A. Adnot and G. Lemay, A model for the quantitative analysis of ESCA intensity ratios for supported catalysts with partial surface segregation, J. Phys. Chem., 1987, 91(11), 2886–2890 CrossRef CAS.
- D. Serrano, J. Botas, J. Fierro, R. Guil-López, P. Pizarro and G. Gómez, Hydrogen production by methane decomposition: origin of the catalytic activity of carbon materials, Fuel, 2010, 89(6), 1241–1248 CrossRef CAS.
- L. Jin, H. Si, J. Zhang, P. Lin, Z. Hu and B. Qiu, et al., Preparation of activated carbon supported Fe–Al2O3 catalyst and its application for hydrogen production by catalytic methane decomposition, Int. J. Hydrogen Energy, 2013, 38(25), 10373–10380 CrossRef CAS.
- P. K. Vanama, A. Kumar, S. R. Ginjupalli and V. C. Komandur, Vapor-phase hydrogenolysis of glycerol over nanostructured Ru/MCM-41 catalysts, Catal. Today, 2015, 250, 226–238 CrossRef CAS.
- S. R. Teixeira, A. Souza, A. F. V. Peña, R. Lima and Á. G. Miguel, Use of charcoal and partially pirolysed biomaterial in fly ash to produce briquettes: sugarcane bagasse, Altern. Fuel, 2011, 346 Search PubMed.
- X. Zhao, W. Ouyang, F. Hao, C. Lin, F. Wang and S. Han, et al., Properties comparison of biochars from corn straw with different pretreatment and sorption behaviour of atrazine, Bioresour. Technol., 2013, 147, 338–344 CrossRef CAS.
- G.-G. Choi, S.-J. Oh, S.-J. Lee and J.-S. Kim, Production of bio-based phenolic resin and activated carbon from bio-oil and biochar derived from fast pyrolysis of palm kernel shells, Bioresour. Technol., 2015, 178, 99–107 CrossRef CAS.
- K. Sing, The use of nitrogen adsorption for the characterisation of porous materials, Colloids Surf., A, 2001, 187, 3–9 CrossRef.
- P. Somasundaran, Encyclopedia of surface and colloid science, CRC Press, 2006 Search PubMed.
- E. Lamouroux, P. Serp and P. Kalck, Catalytic routes towards single wall carbon nanotubes, Catal. Rev., 2007, 49(3), 341–405 CrossRef CAS.
- S. Krzyżyński and M. Kozłowski, Activated carbons as catalysts for hydrogen production via methane decomposition, Int. J. Hydrogen Energy, 2008, 33(21), 6172–6177 CrossRef.
- J. Ashok, M. Subrahmanyam and A. Venugopal, Development of methane decomposition catalysts for COx free hydrogen, Catal. Surv. Asia, 2008, 12(3), 229 CrossRef CAS.
- A. M. Dunker and J. P. Ortmann, Kinetic modeling of hydrogen production by thermal decomposition of methane, Int. J. Hydrogen Energy, 2006, 31(14), 1989–1998 CrossRef CAS.
- H. Jahromi and F. A. Agblevor, Hydrotreating of guaiacol: a comparative study of Red mud-supported nickel and commercial Ni/SiO2-Al2O3 catalysts, Appl. Catal., A, 2018, 558, 109–121 CrossRef CAS.
- M. H. Kim, E. K. Lee, J. H. Jun, G. Y. Han, S. J. Kong and B. K. Lee, et al., Hydrogen production by catalytic decomposition of methane over activated carbons: deactivation study, Korean J. Chem. Eng., 2003, 20(5), 835–839 CrossRef CAS.
- R. Guil-Lopez, J. Botas, J. Fierro and D. Serrano, Comparison of metal and carbon catalysts for hydrogen production by methane decomposition, Appl. Catal., A, 2011, 396(1–2), 40–51 CrossRef CAS.
- K. Hernadi, A. Fonseca, J. Nagy, D. Bemaerts, A. Fudala and A. Lucas, Catalytic synthesis of carbon nanotubes using zeolite support, Zeolites, 1996, 5(17), 416–423 CrossRef.
- K. Hernadi, A. Fonseca, J. Nagy, D. Bernaerts and A. Lucas, Fe-catalyzed carbon nanotube formation, Carbon, 1996, 34(10), 1249–1257 CrossRef CAS.
Footnote |
| † Electronic supplementary information (ESI) available: Commercial catalyst information, catalyst preparation and catalyst characterization methods. See DOI: 10.1039/d0ra07440c |
| This journal is © The Royal Society of Chemistry 2020 |