 Open Access Article
Influence of the ion content of CaCl2-ionised polyamide-66 nucleator on the crystalline nucleation of poly(ethylene terephthalate) through ion–dipole interactions
Yuanfu
Tian
,
Jinqiang
Tan
,
Yixin
Wu
,
Zhiyuan
Song
,
Qian
Tao
,
Xuan
Zheng
,
Tao
Hu
,
Xinghou
Gong
and
Chonggang
Wu
 *
*
Hubei Provincial Key Laboratory of Green Materials for Light Industry, Collaborative Innovation Centre of Green Light-weight Materials and Processing and School of Materials and Chemical Engineering, Hubei University of Technology, Wuhan, Hubei 430068, P. R. China. E-mail: cgwu@mail.hbut.edu.cn
First published on 15th September 2020
Abstract
Polyamide (PA)-66 is successfully ionised with various weight fractions of CaCl2 to prepare PA-66 ionenes bearing different ion contents (ICs). The PA-66 ionenes against PA-66 are incorporated as heterogeneous nucleators into poly(ethylene terephthalate) (PET) to effectively promote PET crystallisation. Compared to the PET/PA-66 (95/5 wt/wt), the PET/PA-66 ionenes (95/5) markedly improve the crystallisation rate and degree of crystallinity. Notably, as the IC of the PA-66 ionene rises from 0 to 11.4 mol%, the nucleation efficiency first increases and then decreases. This may be attributed to the introduction of strong ion–dipole interactions between the CaCl2-coordinating amides of the PA-66 ionenes and the esters of the PET matrices as the IC increases, which gradually boosts the PET/PA-66 ionene interfacial compatibility to create finer nucleator crystals with a denser distribution, thereby steadily enhancing the nucleation efficiency. However, once the IC exceeds 6.5 mol%, the dramatically improved interfacial compatibility causes greatly more and thicker amorphous interphase, which inhibits PET crystallisation. The results indicate that the PA-66 ionene containing 6.5 mol% of Ca2+ is a promising nucleator to maximise the crystallisation acceleration of PET due to the moderate interfacial compatibility by medium-concentration ion–dipole interactions.
Introduction
Poly(ethylene terephthalate) (PET) is a typical semi-crystalline polymer that has been extensively used in fibres, beverage bottles, films and engineering components on account of its superior heat resistance, electrical insulation and mechanical properties. Nevertheless, there are still many drawbacks in the PET moulding process, such as a slow crystallisation rate and long moulding cycle, which result in relatively low mechanical strength, weak impact resistance and poor surface gloss in PET products. These shortcomings severely restrict the high-performance engineering applications of PET. Therefore, many investigations have focused on improving the crystallinity of PET by modifying its nucleation via the incorporation of small amounts (≤5.0 wt%) of heterogeneous nucleators (e.g. ceramic fillers,1,2 organic small molecules3,4 and organic polymers5,6) to facilitate the crystalline nucleation rate of PET. However, the crystallisation rate and degree of crystallinity of PET matrices nucleated by some ceramic fillers and organic small molecules are not significantly increased, and the mechanical properties are generally reduced. This unsatisfactory result is presumably due to the immiscibility of the ceramic fillers with PET, resulting in the poor dispersion of fillers in the PET matrix, and the high reactivity of the organic small molecules, which leads to the degradation of the PET chains.Among all the studied PET nucleators, organic polymers are advanced nucleators that have the potential to maximally promote PET crystallisation, mainly because of their good compatibility. Numerous attempts have been made to enhance PET nucleation using organic polymers such as crystalline polymers [polyamide (PA)-66,7,8 PA-6 (ref. 9) and polylactic acid10], amorphous polymers [e.g. poly(bisphenol-A carbonate) (PC),11,12 poly(m-xylylene adipamide–co–isophthalamide)13 and hyperbranched aliphatic polyester14], liquid-crystalline polymers [e.g. poly(ethylene terephthalate–ran–hydroxybenzoic acid)15 and poly(4-hydroxybenzoic acid–ran–6-hydroxy-2-naphthoic acid)16] and ionomers [e.g. Na-salt poly(ethylene–co–acrylic acid)5 and Na-salt poly(styrene–co–acrylic acid)17] as nucleators. Nevertheless, the enhanced crystallinity of the organic polymer-nucleated PET matrix remains far from its equilibrium value, probably because of the morphological restriction of wide phase size and small number density of the dispersed nucleating agents. Under these circumstances, researchers have attempted to further boost the compatibility between PET and polymer-based nucleators by modifying the PET/nucleator interface with the goal of enhancing the nucleation and thus maximally improving PET crystallinity. For example, researchers13 investigated the compatibilization of PET with PA nucleators by introducing a third compatibilizer directly into the systems. However, the degree of crystallinity of PET was not conspicuously elevated, likely due to the insufficient coupling concentration of the compatibilizers. Other researchers have managed to improve the interfacial compatibility of PET/PC nucleator systems by prolonging the blending time12 and/or adding catalyst18 to accelerate ester amide interchange reactions at the interface. However, satisfactory results were not obtained, possibly because the interchange reactions reduced the tacticity of the macromolecular chains in either of the polymers.
Improving the compatibility of binary polymer blends through ion–dipole interactions (IDIs), as proposed by Eisenberg and colleagues,19,20 offers an idea for the compatibilization of PET and polymer-based nucleators. In this study, to boost the interfacial compatibility of PET/PA-66 and thus maximise PET crystallinity, PA-66 was ionised by CaCl2 to obtain PA-66 ionenes with different ion contents, thereby introducing controllable strong IDIs between the ionic groups of the PA-66 ionenes and the ester groups of the PET matrix. The crystalline properties of the PET matrices nucleated with PA-66 ionenes containing various ion contents were investigated and compared with those of the PET matrix nucleated with PA-66. Based on the results, we determined the optimum ion content of PA-66 ionene for increasing the nucleation rate and crystallinity of the PET matrix, and we also proposed a corresponding mechanism.
Experimental
Materials
PET resin (commodity-grade base material, CZ-302) was supplied by Jiangsu Xingye Polytech Co., Ltd. (China). PA-66 resin (injection-grade base material, 101 L) was acquired from DuPont (USA). Formic acid (analytical reagent, ≥98.0%) and acetone (analytical reagent, ≥99.5%) were obtained from Sinopharm Chemical Reagents Co., Ltd. (Shanghai, China). Methanol (analytical reagent, ≥99.5%) and CaCl2 (analytical reagent, ≥99.0%) were offered by Shanghai Titan Scientific Co., Ltd. (China). KBr (specpure reagent) was provided by Aladdin Industrial Corp. (China). Prior to use, the PET and PA-66 resins were dried at 120 °C under vacuum for at least 12 h.Ionisation of PA-66 with CaCl2
To obtain 2.0 wt% of CaCl2-ionised PA-66 (2.0 wt% CaCl2–PA-66), in which 2.0 wt% refers to the amount of CaCl2 in PA-66 per 100 parts by weight, the predetermined weight, well-dried PA-66 (2.0000 g) and CaCl2 (0.0400 g) were dissolved in 50 mL and 10 mL of formic acid, respectively. The CaCl2 solution was then pipetted into the PA-66 solution. After vigorous stirring at room temperature (RT) for 2 h, the reaction solution was dripped into acetone/methanol (1200 mL, 9/1 v/v) to precipitate a white product, which was subsequently Büchner filtrated and repeatedly washed with acetone/methanol (9/1 v/v). Finally, the product was dried at 60 °C for at least 24 h under vacuum. In the same way, 0 wt% CaCl2–PA-66 (i.e. non-ionised PA-66), 5.0 wt% CaCl2–PA-66 and 10.0 wt% CaCl2–PA-66 were prepared to acquire CaCl2–PA-66 ionenes with different ion contents (ICs).Fourier transform infrared spectroscopy of PA-66 ionene
To corroborate the successful ionisation of PA-66, the Fourier transform infrared (FTIR) absorption spectra of the ionised products were detected and compared to that of PA-66 using an FTIR spectrometer (Bruker, Tensor II) in transmission mode in the mid-IR range (4000 to 500 cm−1). To prepare the KBr pellet samples, either well-dried PA-66 powder or a powder of the ionised product (2.0 mg) was ground with anhydrous KBr (100 mg) using a pestle and mortar. The ground mixture was then compression-moulded using a hydraulic press at RT.Inductively coupled plasma optical emission spectrometry of PA-66 ionene
To verify the IC of CaCl2 quantitatively and compare the ICs of CaCl2-ionised PA-66 ionenes to that of PA-66, inductively coupled plasma optical emission spectrometry (ICP-OES; Agilent, 730 spectrometer) was used to determine the Ca concentrations. The sample (0.1–0.15 g) was placed into a 50 mL Teflon digestion tube. Subsequently, a mixture of hydrochloric acid (1 mL)/hydrofluoric acid (1 mL)/concentrated nitric acid (5 mL) was poured into the tube, which was then capped and placed in a stainless-steel reactor and put into an oven. The solution in the oven was kept for 5 h at 200 °C and then air-cooled to RT. The cooled solution was then transferred into a 25 mL volumetric flask, to which deionised water was therefore added until the constant volume. The solution was then allowed to tumble and left overnight to homogenise the solution. Finally, the Ca concentration of each sample solution was assessed by ICP-OES based on the calibration curve constructed using standard Ca2+ aqueous solutions. The IC of CaCl2 was further calculated as follows: | (1) |
Differential scanning calorimetry of PA-66 ionene
To further confirm the successful occurrence of the PA-66 ionisation, the differential scanning calorimetry (DSC) curves of the ionised products against that of the PA-66 were examined using a DSC instrument (PerkinElmer, DSC 8000) upon its calibration in temperature and heat flow with an indium standard under a N2 atmosphere of 30 mL min−1. The sample (5.0 mg) was encapsulated in an aluminum pan for the DSC measurements, followed by heating to 275 °C, cooling to RT, and heating again to 275 °C, all at a rate of 10 °C min−1.Melt-blending of PET and PA-66 ionene
PA-66 ionene-nucleated PETs (i.e. PET/PA-66 ionene (95/5 wt/wt) blends), were prepared by melt-blending followed by extrusion using a twin-screw mini-compounder (Haake Minilab). During melt-blending, the barrel temperature was 265 °C, the recirculation time was 3 min, and the screw speed was 100 rpm. The PA-66 ionene-nucleated PET products with different ICs were vacuum-dried at 60 °C for at least 24 h. For comparative purposes, PET and PET/PA-66 (95/5) were prepared using the same blending procedure.Differential scanning calorimetry of PA-66 ionene-nucleated PET
To analyse the melt crystallisation behaviours of the PA-66 ionene-nucleated PETs as opposed to that of the PA-66-nucleated PET and neat PET, the DSC thermograms were recorded using the DSC instrument mentioned above. The samples (5.0 mg) were encapsulated, heated to 275 °C, cooled to 0 °C, and then heated to 285 °C, all at a rate of 60 °C min−1. The degree of crystallinity (Xc) of the PET matrix was estimated from its melt crystallisation enthalpy (ΔHmc) using the following equation: | (2) |
Nonisothermal crystallisation kinetics of PA-66 ionene-modified PET
To study the nonisothermal crystallisation kinetics of the PA-66 ionene-nucleated PETs against that of the PA-66-nucleated PET and neat PET, DSC measurements were conducted as described in the previous section. The kinetic parameters of all samples were analysed based on the first cooling curve using the Jeziorny approach. The relative degree of crystallinity (Xt) at the instantaneous temperature T during the crystallisation process can be calculated as follows: | (3) |
 | (4) |
| 1 − Xt = exp(−Zttn), | (5) |
ln(−ln(1 − Xt)) = n![[thin space (1/6-em)]](https://www.rsc.org/images/entities/char_2009.gif) ln ln![[thin space (1/6-em)]](https://www.rsc.org/images/entities/char_2009.gif) t + ln t + ln![[thin space (1/6-em)]](https://www.rsc.org/images/entities/char_2009.gif) Zt. Zt. | (6) |
Since Avrami's approach is generally used to analyse the primary crystallisation stage of isothermal crystallisation, Jeziorny modified the Avrami equation with a cooling rates θ to make it more suitable for nonisothermal crystallisation behaviours.23 The corrected crystallisation rate constant (Zc) is given by
 | (7) |
Hence, the half-time of crystallisation (t1/2) can then be represented by
t1/2 = (ln![[thin space (1/6-em)]](https://www.rsc.org/images/entities/char_2009.gif) 2/Zc)1/n. 2/Zc)1/n. | (8) |
Wide-angle X-ray diffraction of ionised PA-66-nucleated PET
A precalculated amount of PA-66 ionene-nucleated PETs, PA-66-nucleated PET or PET was placed into a Linkam THMS 600 heating stage equipped with a temperature controller. The sample was held at 275 °C for 1 min while gradually melt-pressing it into a disc-shaped sample with a thickness of 40 μm and a diameter of 10 mm. Subsequently, the sample was cooled to RT at a 60 °C min−1 rate and analysed using a PANalytical Empyrean X-ray diffractometer at 40 mA and 45 kV in reflection mode using Cu Kα radiation (1.5406 Å wavelength). All samples were scanned in the 2θ scattering range of 10 to 50° at a rate of 4° min−1.Polarised optical microscopy of ionised PA-66-modified PET
A small particle (2.0 mg) of PA-66 ionene-nucleated PETs, PA-66-nucleated PET or PET was sandwiched between a glass slide and a glass cover and then placed onto a heating stage stabilised at 275 °C for 1 min. The fully melted sample was pressed into a film with a thickness of approximately 40 μm. Afterwards, the film was cooled to 140 °C at 60 °C min−1, and its crystal morphology was observed using a Leica DM 2500P polarised optical microscope equipped with a digital camera. The obtained microscopy images were taken as the temperature lessened from 200 to 140 °C.Results and discussion
Evidence of the successful ionisation of PA-66 with CaCl2
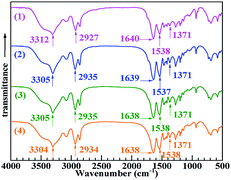
Fig. 1 shows the FTIR absorption spectra (spectra 2–4) of PA-66 (presumably PA-66 ionenes) modified with 2.0, 5.0 and 10.0 wt% of CaCl2, respectively. The spectrum of PA-66 (spectrum 1) is shown for comparison. All spectra were normalised with respect to the C–H antisymmetric stretching band of the –CH2– groups at around 2927 cm−1, for which the intensity remained basically unchanged after the slight modification of the amide groups. In spectrum 1 (PA-66), the peaks at 1371, 1538, 1640 and 3312 cm−1 are attributed to the C–N stretching, N–H in-plane bending, C![[double bond, length as m-dash]](https://www.rsc.org/images/entities/char_e001.gif) O stretching and N–H stretching of the amide groups [–C(
O stretching and N–H stretching of the amide groups [–C(![[double bond, length as m-dash]](https://www.rsc.org/images/entities/char_e001.gif) O)–NH–], respectively. Upon modifying PA-66 with various contents of CaCl2, the amide group absorption peaks were affected by CaCl2 modification-induced structural changes. Notably, the intensities of the bands corresponding to N–H in-plane bending and C
O)–NH–], respectively. Upon modifying PA-66 with various contents of CaCl2, the amide group absorption peaks were affected by CaCl2 modification-induced structural changes. Notably, the intensities of the bands corresponding to N–H in-plane bending and C![[double bond, length as m-dash]](https://www.rsc.org/images/entities/char_e001.gif) O stretching around 1538 and 1639 cm−1, respectively, increased slightly, probably due to the formation of a coordination structure between Ca2+ ions and carbonyl O atoms. The wavenumber of the N–H stretching band decreased from 3312 cm−1 to 3305, 3305 or 3304 cm−1, likely due to the combined effects of steric hindrance24 and induction.25 These results confirm the successful ionisation of PA-66 with CaCl2 to obtain CaCl2–PA-66 ionenes.
O stretching around 1538 and 1639 cm−1, respectively, increased slightly, probably due to the formation of a coordination structure between Ca2+ ions and carbonyl O atoms. The wavenumber of the N–H stretching band decreased from 3312 cm−1 to 3305, 3305 or 3304 cm−1, likely due to the combined effects of steric hindrance24 and induction.25 These results confirm the successful ionisation of PA-66 with CaCl2 to obtain CaCl2–PA-66 ionenes.
To further verify the successful preparation of CaCl2–PA-66 and quantify the IC(CaCl2) values of these ionenes, the Ca contents of 2.0 wt% CaCl2–PA-66, 5.0 wt% CaCl2–PA-66 and 10.0 wt% CaCl2–PA-66 relative to PA-66 were measured by ICP-OES. Based on the above FTIR spectra, two assumptions were made in the quantitative IC calculations: each CaCl2 molecule is complexed with the two carbonyl O atoms from any two amide groups of PA-66;26 and both amide groups of any participating structural repeat unit are ionised to form an ionised structural repeat unit. Hence, the IC(CaCl2) values of the four samples were counted by eqn (1), and the resulting data are presented in Table 1. It is read that, the IC(CaCl2) values of 2.0 wt% CaCl2–PA-66, 5.0 wt% CaCl2–PA-66 and 10.0 wt% CaCl2–PA-66 were 2.3, 6.5 and 11.4 mol%, respectively. These values are approximately two orders of magnitude higher than that of PA-66 (0.028 mol%). These results fully confirm the successful ionisation reactions of PA-66 with different fractions of CaCl2; hence, the prepared PA-66 ionenes were labelled as 2.3 mol% CaCl2–PA-66, 6.5 mol% CaCl2–PA-66 and 11.4 mol% CaCl2–PA-66.
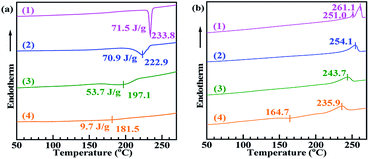
Fig. 2 shows the DSC thermograms of 2.3 mol% CaCl2–PA-66 (trace 2), 6.5 mol% CaCl2–PA-66 (trace 3) and 11.4 mol% CaCl2–PA-66 (trace 4) as opposed to that of PA-66 (trace 1). It is seen that from Fig. 2a, as the PA-66 IC increased from 0 to 11.4 mol%, the crystallisation temperature (Tmc) reduced progressively from 233.8 to 181.5 °C, and the crystallisation peak broadened. This indicates that the rate of crystallisation reduced with PA-66 ionisation, likely due to the decreased chain regularity caused by random ionic reaction. In addition, ΔHmc diminished monotonically from 71.5 until 9.7 J g−1 with increasing IC, suggesting that the degree of crystallisation was markedly decreased by the chain randomisation. Moreover, as reflected in Fig. 2b, the melting temperature (Tm) also gradually descended with increasing IC due to the reduced crystallinity, resulting in the formation of more imperfect PET spherulites. This evidence of the gradual decline in crystallinity strongly suggests that the ionisation was successful.
Optimum ion content of CaCl2-ionised PA-66 nucleator to maximise PET crystallinity
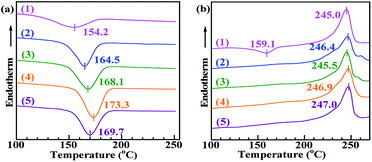
The DSC thermograms of neat PET, PET/PA-66 (95/5), PET/2.3 mol% CaCl2–PA-66 (95/5), PET/6.5 mol% CaCl2–PA-66 (95/5) and PET/11.4 mol% CaCl2–PA-66 (95/5) samples (traces 1–5, respectively) in the first cooling and second heating cycles (both recorded at a rate of 60 °C min−1) are shown in Fig. 3. The detailed DSC data of the crystallisation properties are summarised in Table 2. The Tm and melting enthalpy (ΔHm) values of all the PET matrices were similar, likely because the nucleation modifiers had little effect on the ultimate (i.e. post-recrystallisation) degree of PET crystallinity. Notably, the Tmc and ΔHmc values of the PA-66-nucleated PET matrix increased with temperature from 18.4 J g−1 at 154.2 °C to 25.2 J g−1 at 164.5 °C. Consequently, the PA-66-nucleated PET displayed an increased Xc and a reduced degree of supercooling (ΔT) compared to neat PET. In addition, the recrystallisation peak was weakened beyond recognition in the second DSC heating cycle. These indicate that PA-66 acted as a valuable heterogeneous nucleator that effectively increased the crystallisation rate and degree of crystallinity of the PET matrix.| Composition | T mc (°C) | ΔHmc (J g−1) | T cc (°C) | T m (°C) | ΔHm (J g−1) | ΔT (°C) | X c (%) |
|---|---|---|---|---|---|---|---|
| a All data are derived from the differential scanning calorimetry (DSC) curves measured at a rate of 60 °C min−1. b The data are indiscernible from the DSC curves. | |||||||
| (1) PET | 154.2 | 18.4 | 159.1 | 245.0 | 29.7 | 90.8 | 15.6 |
| (2) PET/PA-66 | 164.5 | 25.2 | —b | 246.4 | 29.4 | 81.9 | 22.6 |
| (3) PET/2.3 mol% CaCl2–PA-66 | 168.1 | 28.2 | —b | 245.5 | 30.0 | 77.1 | 25.2 |
| (4) PET/6.5 molt% CaCl2–PA-66 | 173.3 | 32.2 | —b | 246.9 | 32.2 | 73.6 | 28.8 |
| (5) PET/11.4 mol% CaCl2–PA-66 | 169.7 | 28.9 | —b | 247.0 | 29.3 | 77.3 | 25.9 |
More importantly, as shown in Fig. 3a and Table 2, as the PA-66 IC increased monotonically from 0 to 2.3 to 6.5 mol% (traces 2–4, respectively), the Tmc and ΔHmc values of the PET matrix increased steadily with temperature from 25.2 J g−1 at 164.5 °C to 32.2 J g−1 at 173.3 °C, and the ΔT further decreased by 8.3 °C. Meanwhile, the melt crystallisation peak narrowed gradually, and Xc elevated from 22.6% to 28.8%. These suggest that the ionisation of PA-66 effectively promoted PET crystallisation. However, when the PA-66 IC increased further to 11.4 mol% (trace 5), Tmc, ΔHmc and Xc all decreased, the crystallisation peak became broader, and while ΔT rose. These results disclose that a PA-66 ionene with a moderate IC can serve as a more positive, effective heterogeneous nucleator to reinforce the melt crystallinity of the PET matrix. Among the studied ionenes, the PA-66 ionene containing 6.5 mol% Ca2+ was the most promising option to maximise its nucleation, perhaps by introducing an appropriate amount of IDIs, as discussed in detail in the mechanism section.
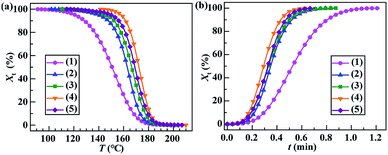
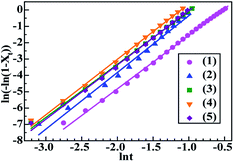
To analyse the nonisothermal crystallisation kinetics of PA-66 ionene-nucleated PETs, several important kinetic parameters were extracted from the DSC curves (Fig. 3a). The variations of the relationships between Xt and T for the five PETs were assessed based on eqn (3), and the results are shown in Fig. 4a. By combining eqn (3) and (4), the plots of Xtvs. t were obtained for all samples (Fig. 4b). All traces in Fig. 4a and b have the same shape, indicating the retardation effect of cooling rate on the melt crystallisation.21 Subsequently, Xt was expressed as a function of t based on eqn (5), which was further transformed into the double-logarithmic form shown in eqn (6). The plots of ln(−ln(1 − Xt)) vs. ln![[thin space (1/6-em)]](https://www.rsc.org/images/entities/char_2009.gif) t and their least-squares linear fits (regression coefficients R2 were typically 0.998) are depicted in Fig. 5. The slopes and vertical intercepts of the plots in Fig. 5 represent n and ln
t and their least-squares linear fits (regression coefficients R2 were typically 0.998) are depicted in Fig. 5. The slopes and vertical intercepts of the plots in Fig. 5 represent n and ln![[thin space (1/6-em)]](https://www.rsc.org/images/entities/char_2009.gif) Zt, respectively; it should be noted that, for a typical comparison, the range of Xt was set to less than 80%, which mainly corresponds to the primary crystallisation process of the PET matrix.
Zt, respectively; it should be noted that, for a typical comparison, the range of Xt was set to less than 80%, which mainly corresponds to the primary crystallisation process of the PET matrix.
The Jeziorny kinetic parameters (n, Zt, Zc and t1/2) for the five PETs were calculated and are shown in Table 3. It is observed that with the addition of the PA-66 and PA-66 ionenes, the value of n changed only slightly from 3.3 to 3.5. This demonstrates that, for all five samples, the nucleation and crystal growth mechanisms were similar, and the crystal growth process produced three-dimensional spherulites.27 Compared to neat PET, PET/PA-66 (95/5) showed a higher Zc and a lower t1/2, again demonstrating that the presence of PA-66 can effectively heighten the melt crystallisation rate of the PET matrix, even at the fast cooling rates of 60 °C min−1. For the PET/CaCl2–PA-66 (95/5) sample, as the CaCl2–PA-66 IC increased from 2.3 to 6.5 mol%, Zc increased, while t1/2 descended, indicating the PA-66 ionenes more significantly enhanced the melt crystallisation rate of the PET matrix than PA-66. However, 11.4 mol% CaCl2–PA-66-nucleated PET exhibited a lower Zc and larger t1/2 than 6.5 mol% CaCl2–PA-66-nucleated PET, suggesting a decrease in the crystallisation rate of the PET matrix. Altogether, these results conclusively indicate that 6.5 mol% CaCl2–PA-66 is a promising nucleator to maximise the heterogeneous nucleation and accelerate the melt crystallisation of the PET matrix. This may be related to two competing effects of the prominent CaCl2–PA-66/PET interfacial compatibilization resulting from the introduced IDIs. The enhanced interfacial compatibility increased the fineness and distribution density of ionene nucleators in the PET matrix (positive dispersed morphological effect). Meanwhile, the improved compatibility vastly expanded and thickened the amorphous interlayers (negative interfacial morphological effect). Clearly, when the IC was 6.5 mol%, the positive effect greatly predominated over the negative effect. In contrast, once IC exceeded 6.5 mol%, the negative interfacial effect gradually became predominant.
| Composition | t 1/2 (min) | n | Z t | Z c |
|---|---|---|---|---|
| a All parameters are derived from the curve fittings shown in Fig. 5. | ||||
| (1) PET | 0.53 | 3.272 | 5.596 | 1.029 |
| (2) PET/PA-66 | 0.37 | 3.468 | 22.554 | 1.053 |
| (3) PET/2.3 mol% CaCl2–PA-66 | 0.34 | 3.252 | 24.048 | 1.054 |
| (4) PET/6.5 mol% CaCl2–PA-66 | 0.30 | 3.394 | 43.465 | 1.065 |
| (5) PET/11.4 mol% CaCl2–PA-66 | 0.33 | 3.319 | 26.471 | 1.056 |
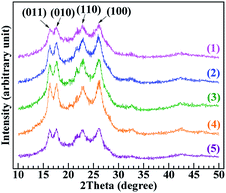
The crystallinity and crystal structure of neat PET, PET/PA-66 (95/5), PET/2.3 mol% CaCl2–PA-66 (95/5), PET/6.5 mol% CaCl2–PA-66 (95/5) and PET/11.4 mol% CaCl2–PA-66 (95/5) (traces 1–5, respectively) were investigated by wide-angle X-ray diffraction (WAXD). As shown in Fig. 6, the five PETs exhibited similar peak positions. The peaks in the 2θ ranges of 16.3–16.4, 17.6–17.7, 22.8–23.1 and 26.1–26.4° can be assigned to the (011), (010), (110) and (100) crystallographic planes of the PET matrix, respectively.28,29 The detailed 2θ values from the (hkl) planes are shown in Table 4. These results reflect that the five PETs had similar crystal structures (i.e. a triclinic crystal system with a planar chain conformation),30 implying that the crystal form was little interfered by the introduction of PA-66 or its ionenes with various ICs.
| Composition | (hkl) | 2θ (°) | d hkl (Å) | L hkl (nm) | X c (%) |
|---|---|---|---|---|---|
| a All data are obtained from the wide-angle X-ray diffractograms shown in Fig. 6. | |||||
| (1) PET | (011) | 16.35 | 5.42 | 12.1 | 17.3 |
| (010) | 17.67 | 5.02 | 12.5 | ||
| (110) | 22.79 | 3.90 | 11.1 | ||
| (100) | 26.08 | 3.41 | 10.3 | ||
| (2) PET/PA-66 | (011) | 16.33 | 5.42 | 11.5 | 24.5 |
| (010) | 17.72 | 5.00 | 13.2 | ||
| (110) | 23.06 | 3.85 | 11.4 | ||
| (100) | 26.28 | 3.39 | 11.1 | ||
| (3) PET/2.3 mol% CaCl2–PA-66 | (011) | 16.25 | 5.45 | 11.7 | 26.0 |
| (010) | 17.61 | 5.03 | 12.6 | ||
| (110) | 23.04 | 3.86 | 11.2 | ||
| (100) | 26.37 | 3.38 | 9.8 | ||
| (4) PET/6.5 mol% CaCl2–PA-66 | (011) | 16.39 | 5.38 | 12.3 | 29.7 |
| (010) | 17.60 | 5.03 | 13.2 | ||
| (110) | 22.95 | 3.87 | 12.8 | ||
| (100) | 26.15 | 3.41 | 9.9 | ||
| (5) PET/11.4 mol% CaCl2–PA-66 | (011) | 16.33 | 5.42 | 11.5 | 26.8 |
| (010) | 17.73 | 5.00 | 13.1 | ||
| (110) | 22.81 | 3.89 | 13.0 | ||
| (100) | 26.33 | 3.38 | 10.6 | ||
With the help of Jade software, the crystal structures and degrees of crystallinity of the five PETs were quantitatively studied using the following equations. The interplanar (i.e. Bragg) spacing (dhkl) was estimated using Bragg's law,
λ = 2dhkl![[thin space (1/6-em)]](https://www.rsc.org/images/entities/char_2009.gif) sin sin![[thin space (1/6-em)]](https://www.rsc.org/images/entities/char_2009.gif) θ, θ, | (9) |
 | (10) |
 | (11) |
| Ic = I(011) + I(010) + I(110) + I(100), | (12) |
As shown in the calculation results listed in Table 4, the dhkl values associated with the (hkl) planes of the five PETs were similar, reflecting that the unit-cell parameters of the PET triclinic crystal lattice remained mostly unchanged upon the inclusion of PA-66 or its ionenes with various ICs to induce heterogeneous nucleation. In addition, the Lhkl of the PET matrix, as a larger length scale of crystal structure, varied little between the (hkl) planes upon the introduction of heterogeneous nucleators. These results suggest that the crystal growth mechanism of the PET matrix was hardly changed by the introduction of heterogeneous nucleators, although it did affect the crystallinity and hence the crystalline morphology of PET by changing the nucleation mechanism. The Xc values of the PET matrices were calculated from the data in Fig. 6 using eqn (11) and (12). Xc improved monotonically from 17.3% to 29.7% in the order of neat PET, PET/PA-66 (95/5), PET/2.3 mol% CaCl2–PA-66 (95/5) and PET/6.5 mol% CaCl2–PA-66 (95/5). This corroborates that the PET crystallinity was obviously improved by the PA-66 nucleation, and further heightened by the PA-66 ionenes nucleation. However, when the IC of the PA-66 ionene reached 11.4 mol%, Xc began to descend. This verifies that the appropriate ionisation of PA-66 can more effectively enhance its heterogeneous nucleation and thus maximise the crystallinity of the PET matrix, in accordance with the Xc data derived from the DSC curves.
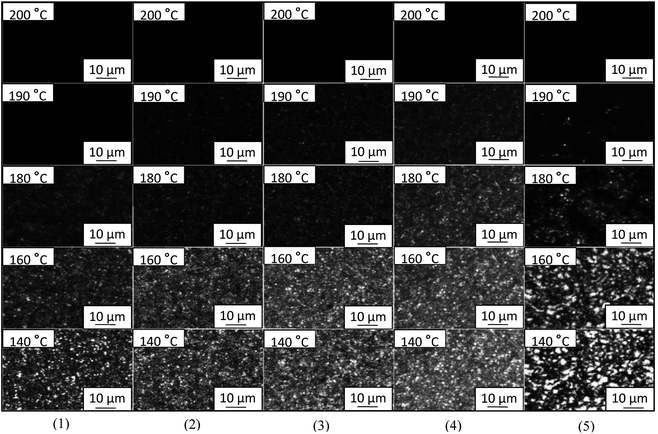
To study the effects of PA-66 ionenes with different IC values on the crystalline morphology of PA-66-modified PET and further demonstrate the maximum reinforcement of melt crystallinity under the optimal PA-66 IC, polarised optimal microscopy (POM) analyses were carried out for neat PET, PET/PA-66 (95/5), PET/2.3 mol% CaCl2–PA-66 (95/5), PET/6.5 mol% CaCl2–PA-66 (95/5) and PET/11.4 mol% CaCl2–PA-66 (95/5) during cooling from 200 to 140 °C at a rate of 60 °C min−1 (images 1–5, Fig. 7 respectively). In all the images shown in Fig. 7, the bright spots represent anisotropic crystallised regions (e.g. spherulites), whereas the dark background indicates the isotropic amorphous domains of the PET matrices. For each of the five PETs, as nonisothermal melt crystallisation proceeded (i.e. as temperature decreased), the mutually impinged spherulites became steadily enriched (i.e. the instantaneous degree of crystallinity gradually improved). Specifically, all the five PETs exhibited fully dark fields at 200 °C, apparently due to the molten and amorphous state of the PET matrix. When cooled further to 190 °C, some PET crystals emerged in both the ionene-nucleated PETs (images 3, 4 and 5) and the PA-66-nucleated PET (image 2), whereas neat PET (image 1) remained in a fully amorphous state. This difference confirms that the incorporation of PA-66 or its ionenes with various ICs effectively promoted the nucleation of crystalline PET and thus remarkably accelerated its crystallisation rate.
When the temperature decreased further to 180 °C or lower, a few crystals appeared in neat PET (image 1) as a result of homogeneous nucleation; these crystals were obviously sparser and coarser than those nucleated heterogeneously by PA-66 (image 2). More importantly, compared to the PA-66 nucleator (image 2) in the same temperature range (180–140 °C), the ionised PA-66 nucleators with ICs of 2.3 and 6.5 mol% (images 3 and 4, respectively) resulted in considerably thicker and smaller PET crystals because of the finer and more densely distributed ionene nucleators. This can be attributed to the IDI-based improvement in compatibility between the nucleators and the PET matrix, which increased the Xc value of PET, as shown in Tables 2 and 4. However, when the IC was further increased to 11.4 mol%, the ionene nucleator visibly thinned out the grown PET crystals (cf. images 5 and 4), in agreement with the reduced Xc of PET (Tables 2 and 4). This is presumably attributed to the strikingly enhanced interfacial effect resulting from the highly concentrated IDIs, as discussed earlier. Overall, the 6.5 mol% CaCl2–PA-66 was the most promising nucleator to maximise the melt crystallisation rate of the PET matrix. The POM results are all consistent with the DSC and WAXD analyses presented above.
Mechanism of the effect of PA-66 nucleator ionisation on the crystalline nucleation of PET via ion–dipole interactions
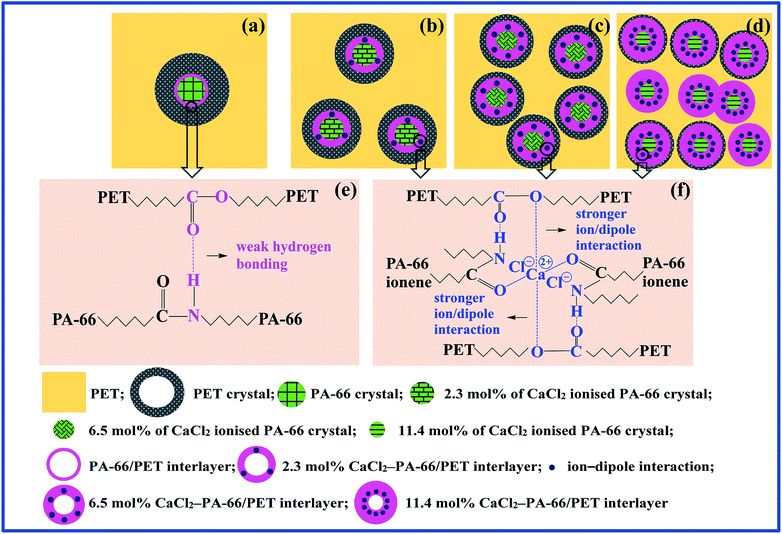
Based on the above analyses, the mechanism of the effect of PA-66 nucleator ionisation on the crystalline nucleation of PET was preliminarily established. Scheme 1 shows the mechanisms by which PET/PA-66 (Scheme 1a and e), PET/2.3 mol% CaCl2–PA-66 (Scheme 1b and f), PET/6.5 mol% CaCl2–PA-66 (Scheme 1c and f) and PET/11.4 mol% CaCl2–PA-66 (Scheme 1d and f) affect nucleation. Scheme 1a–d and Scheme 1e and f represent the crystalline nucleation morphologies and interfacial chain-segmental interactions, respectively. In the PET matrix nucleated by PA-66 (Scheme 1a), PA-66 crystallisation obviously occurred earlier than the crystallisation of the PET matrix (cf.Fig. 2a and 3a) and then the PA-66 crystals acted as a heterogeneous nucleator to facilitate the crystallisation of the PET matrix. In the PA-66/PET amorphous interlayers, hydrogen bonds may form between the amide H atoms of PA-66 and the carbonyl O atoms of PET, as shown in Scheme 1e. Each hydrogen bond is basically composed of ionic and covalent components (amide–ester dipole–dipole attraction and O–H bonding, respectively). The hydrogen bonds improve the PA-66/PET interfacial compatibility, which explains the enhanced crystallinity of PET nucleated by the PA-66 particles.In comparison, in the interlayers of the PET matrices nucleated by PA-66 ionenes with different IC values (Scheme 1b–d), stronger Ca+–PET IDIs replace some of the weak hydrogen bonds, and the concentration of IDIs steadily rises with increasing IC. As shown in Scheme 1f, each IDI consists of ionic and covalent components; that is, ion–dipole attraction between a CaCl2–PA-66 amide-connected (1/2)Ca2+–Cl− ion pair and a PET ester, and O–H and O–Ca bonds, respectively, both of which are dramatically strengthened relative to the hydrogen bond shown in Scheme 1e. This suggests that the IDIs obviously thicken the interlayers and boost the interfacial compatibility of CaCl2–PA-66/PET, thereby reducing the size of dispersed CaCl2–PA-66 crystals while increasing their number density. This effect greatly accelerates the heterogeneous nucleation rate of the PET matrix, resulting in denser and finer PET crystals relative to PA-66/PET (cf.Scheme 1b–d with Scheme 1a).
Notably, as IC increases monotonically from 2.3 to 11.4 mol%, the nucleation efficiency of CaCl2–PA-66 first increases and then reduces, revealing an optimum IC of approximately 6.5 mol%. This may be explained by the increase in amorphous PET domains with increasing IC, which is attributed to the remarkably thickened interlayers and enlarged interfacial area. Compared to the PET/2.3 mol% CaCl2–PA-66 and PET/6.5 mol% CaCl2–PA-66, the interlayers in PET/11.4 mol% CaCl2–PA-66 are drastically thickened and interfacial compatibility is strikingly boosted, resulting in a much larger amorphous component (cf.Scheme 1d with Scheme 1b and c). The amorphous domains are close to each other and even overlay, limiting the nucleation and crystal growth of the remainder of the PET matrix on the CaCl2–PA-66 crystals. In other words, the dispersed morphological effect (i.e. the facilitation of nucleation by thick, fine dispersed PA-66 crystals) prevails over the interfacial morphological effect (i.e. the inhibition of nucleation by amorphous interlayers) at ICs of 2.3 and 6.5 mol%, as described above (Scheme 1b and c), and the nucleation efficiency of PA-66 ionenes steadily increases with IC. When IC reaches 11.4 mol% (Scheme 1d), the uptrend of the interfacial effect is immensely greater than that of the dispersed effect, causing the nucleation efficiency of 11.4 mol% CaCl2–PA-66 to be lower than that of 6.5 mol% CaCl2–PA-66.
Conclusions
PA-66 ionenes containing different contents (2.3, 6.5 and 11.4 mol%) of Ca2+ ions in their backbone chains were successfully prepared via the solution reaction of PA-66 with 2.0, 5.0 and 10.0 wt% of CaCl2 in formic acid, respectively, as confirmed by FTIR spectroscopy, ICP-OES and DSC analyses. Each of the PA-66 ionenes against PA-66 (both at 5.0 wt%) was incorporated into PET by melt blending. Based on DSC analyses, the determination of nonisothermal crystallisation kinetic parameters, WAXD measurements and POM observations, PA-66 and its ionenes acted as heterogeneous nucleators of PET to accelerate melt crystallisation, although their nucleation efficiencies were different. As IC increased from 0 to 2.3 to 6.5 mol%, the nucleation efficiency of CaCl2–PA-66/PET increased steadily, as confirmed by the gradual increases in Tmc, ΔHmc, Xc and Zc, decreases in ΔT and t1/2, and remarkably thicker and smaller PET crystals. This may be explained by the replacement of weak hydrogen bonds with strong IDIs in the interlayers, which enhances the interfacial compatibility to create finer CaCl2–PA-66 nucleators with a denser distribution, thereby resulting in much thicker and probably smaller PET crystals. When IC further rose from 6.5 to 11.4 mol%, the IDIs were reinforced, leading to stronger interfacial compatibility and hence better nucleator dispersion of CaCl2–PA-66/PET; however, the PET crystallinity was not further improved, likely because the stronger IDIs markedly thickened the interlayers and enlarged the interfacial area, resulting in more amorphous PET domains. These amorphous portions overlapped each other, restricting the nucleation and growth of the remaining PET matrix on the CaCl2–PA-66 crystals. Consequently, the optimum IC of CaCl2–PA-66 nucleator to maximally raise the crystallisation rate and degree of crystallinity of the PET matrix was 6.5 mol%. These results provide a valuable reference for selecting the ion type and content of ionised nucleator to maximise the heterogeneous nucleation efficiency of commercial PET resin/nucleator.Conflicts of interest
There are no conflicts of interest to declare.Acknowledgements
The authors acknowledge with gratitude the support from the Natural Science Foundation of the Hubei Province, China (2014CFA094), the National Natural Science Foundation of China (51703053) and the Technology Foundation for Selected Overseas Scholar, Ministry of Human Resources and Social Security, China ([2013]277). We also thank Charlesworth for its linguistic assistance during the preparation of this manuscript.Notes and references
- T. Wu and Y. Ke, Thin Solid Films, 2007, 515, 5220 CrossRef CAS.
- W. Hao, X. Wang, Y. Wen and Z. Kang, Polym. Test., 2012, 31, 110 CrossRef CAS.
- R. Legras, C. Bailly, M. Daumerie, J. M. Dekoninck, J. P. Mercier, V. Zichy and E. Nield, Polymer, 1984, 25, 835 CrossRef CAS.
- K. Bouma and R. J. Gaymans, Polym. Eng. Sci., 2001, 41, 466 CrossRef CAS.
- Y. Yu, Y. Yu, M. Jin and H. Bu, Macromol. Chem. Phys., 2000, 201, 1894 CrossRef CAS.
- W. Grasser, H. W. Schmidt and R. Giesa, Polymer, 2001, 42, 8517 CrossRef CAS.
- L. Z. Pillon, J. Lara and D. W. Pillon, Polym. Eng. Sci., 1987, 27, 984 CrossRef CAS.
- M. R. Kamal, M. A. Sahto and L. A. Utracki, Polym. Eng. Sci., 1982, 22, 1127 CrossRef CAS.
- S. Fakirov, M. Evstatiev and J. M. Schultz, Polymer, 1993, 34, 4669 CrossRef CAS.
- H. A. Topkanlo, Z. Ahmadi and F. A. Taromi, Iran. Polym. J., 2018, 27, 13 CrossRef CAS.
- V. E. Reinsch and L. Rebenfeld, J. Appl. Polym. Sci., 1996, 59, 1913 CrossRef CAS.
- W. Zheng, Z. Qi and F. Wang, Polym. Int., 2003, 34, 307 CrossRef.
- Y. S. Hu, V. Prattipati, S. Mehta, D. A. Schiraldi, A. Hiltner and E. Baer, Polymer, 2005, 46, 2685 CrossRef CAS.
- J. Jang, J. H. Oh and S. I. Moon, Macromolecules, 2000, 33, 1864 CrossRef CAS.
- K. Yoshikai, K. Nakayama and M. Kyotani, J. Appl. Polym. Sci., 1996, 62, 1331 CrossRef CAS.
- J. Seppälä, M. Heino and C. Kapanen, J. Appl. Polym. Sci., 1992, 44, 1051 CrossRef.
- S. Tang and Z. Xin, Polymer, 2009, 50, 1054 CrossRef CAS.
- L. Z. Pillon and L. A. Utracki, Polym. Eng. Sci., 2004, 24, 1300 CrossRef.
- A. Eisenberg and M. Hara, Polym. Eng. Sci., 1984, 24, 1306 CrossRef CAS.
- M. Hara and A. Eisenberg, Macromolecules, 1984, 17, 1335 CrossRef CAS.
- J. W. Chung, S. B. Son, S. W. Chun, T. J. Kang and S. Y. Kwak, J. Polym. Sci., Part B: Polym. Phys., 2008, 46, 989 CrossRef CAS.
- M. Avrami, J. Chem. Phys., 1939, 7, 1103 CrossRef CAS.
- A. Jeziorny, Polymer, 1978, 19, 1142 CrossRef CAS.
- R. N. Jones, W. F. Forbes and W. A. Mueller, Can. J. Chem., 1957, 35, 504 CrossRef CAS.
- Y. Mido, Bull. Chem. Soc. Jpn., 1973, 46, 782 CrossRef CAS.
- D. X. Liu, Q. Zheng, S. J. Lu, C. Li, P. Lu and J. Yu, J. Appl. Polym. Sci., 2015, 132, 41513 CrossRef.
- R. Phillips and J.-A. E. Månson, J. Polym. Sci., Part B: Polym. Phys., 1997, 35, 875 CrossRef CAS.
- U. Köncke, H. G. Zachmann and F. J. Baltá-Calleja, Macromolecules, 1996, 29, 6019 CrossRef.
- S. M. A. Jafari, R. Khajavi, V. Goodarzi, M. R. Kalaee and H. A. Khonakdar, J. Appl. Polym. Sci., 2019, 136, 47569 CrossRef.
- S. Fakirov, E. W. Fischer and G. F. Schmidt, Macromol. Chem. Phys., 1975, 176, 2459 CrossRef CAS.
- J. E. Johnson, J. Appl. Polym. Sci., 1959, 2, 205 CrossRef CAS.
| This journal is © The Royal Society of Chemistry 2020 |

