 Open Access Article
Enhanced photoelectrochemical biosensing performance for Au nanoparticle–polyaniline–TiO2 heterojunction composites†
Bingdong Yana,
Xiaoru Zhaoa,
Delun Chena,
Yang Caoa,
Chuanzhu Lvc,
Jinchun Tu a,
Xiaohong Wang
 *a and
Qiang Wu
 *b
*b
aState Key Laboratory of Marine Resource Utilization in the South China Sea, School of Materials Science and Engineering, Hainan University, Haikou 570228, P. R. China. E-mail: wangxiaohong@hainu.edu.cn
bSchool of Tropical Medicine and Laboratory Medicine, Key Laboratory of Emergency and Trauma of Ministry of Education, Hainan Medical University, Haikou 571199, P. R. China. E-mail: wuqiang001001@aliyun.com
cResearch Unit of Island Emergency Medicine, Chinese Academy of Medical Sciences (No. 2019RU013), Hainan Medical University, Haikou 571199, P. R. China
First published on 10th December 2020
Abstract
A new photoelectrochemical (PEC) sensing platform comprising TiO2 nanotube arrays (TiONTAs), polyaniline (PANI), and gold nanoparticles (AuNPs) was successfully fabricated. After loading the enzyme, this Au–PANI–TiONTA electrode showed excellent response to glucose at a linear range of 2–36 mM with a 0.02 mM detection limit. Good PEC performance was obtained due to the following advantages of the material: high visible-light harvesting ability for excellent light trapping capacity of PANI and AuNPs, good separation of the photo-induced charges related to the specific Au–PANI–TiONTA heterostructure, efficient electrode surface reaction kinetics derived from the large specific surface area of TiONTAs and improved electrode catalytic activity. This work proposed a new and general PEC enzymatic format and can be extended to prepare different PEC biosensors for biomolecules such as DNA, proteins and substrates of oxidases.
1. Introduction
Photoelectrochemical (PEC) analysis as a burgeoning analytical tool offers a potent way of biochemical analysis, environmental monitoring, and clinical diagnosis.1 Because of the different kinds of excitation and detection signals, PEC sensors possess inherent high sensitivity and low detection limit.2 Fundamentally, PEC detection contains three processes: the absorption of luminous energy by the modified nanomaterial to generate electrons and holes, the separation of photon-generated carriers, and the migration of these carriers to the surface of the material to participate in the surface catalytic reaction. These processes correspond to the light-harvesting capability, charge separation efficiency, and surface reaction kinetics of the electrode material, respectively.3 Therefore, the composition and structural design of materials is crucial.One-dimensional TiO2 nanotubes are marvelous candidates for PEC biosensors due to their surface effects, small size effects, macro quantum tunnel effects, specific surface area as well as electronic properties.4 These effects do not only facilitate the surface reactions of TiO2 nanotubes by making the system kinetics more efficient but also can induce entirely new thermodynamic reaction pathways.5 Furthermore, the form of an array can endow the 1D TiO2 nanotubes with high mechanical strength, significant signal collection ability, and easy miniaturization.6,7 Hence, this work synthesized a self-organized TiO2 nanotube array (TiONTA) via typical anodic oxidation as a substrate to build the PEC biosensor platform.
The application of TiO2 materials in PEC sensors is generally restricted by their limited response to ultraviolet light and fast recombination of carriers.8 Coupling TiO2 with organic polymer materials containing the conjugative π structure is an effective solution to this problem.9 The electrochromic properties of PANI can promote the visible-light absorption of the electrode.10 The conjugate quinone structure of PANI can trap abundant photoexcited carriers to retard the recombination of electrons and holes.11 Thus, PANI has been introduced into photoelectrochemical sensing for lactose detection,12 which confirms that PANI can be used as an active ingredient for the photoelectrochemical analysis. Moreover, AuNPs have been frequently utilized in PEC biosensors because of their excellent biocompatibility and affinity with biological macromolecules and photoelectric properties.13 Free electrons in AuNPs can substantially absorb light to stimulate the PEC process.
Therefore, integrating AuNPs with wide-bandgap semiconductors, such as ZnO2 or TiO2, can improve the performance of photoelectric sensing.14 In addition, the local surface plasmon resonance effect of gold particles under light15 has also made AuNPs favorable for photoelectrochemical sensing.16 The gold particles in the system can generate “hot” electrons under light conditions. The Fermi level of these electrons is higher than the TiO2 substrate conduction band, which facilitates the plasmonic “hot” electron transfer to the TiO2 electrode and leaves “holes” on the Au surface. The free “holes” help in the absorption of OH− in the PBS solution and provide more AuOH active sites, which is critical for glucose oxidation.17
Herein, a novel photoelectrode for PEC biosensing, which is composed of TiONTAs, PANI, and AuNPs, was successfully built. The good PEC performance was obtained because of the high visible-light absorption, efficient photoelectric conversion efficiency, and catalytic activity. A one-dimensional TiO2 nanotube array with a high specific surface area was exploited to accommodate a substantial load of PANI and AuNPs, which could retain the catalytic activity of the enzyme. Moreover, the introduction of PANI would minimize the bandgap of TiO2 to avoid possible damage of enzymes by UV light. These biosensors showed excellent performance for the direct detection of blood glucose without any pretreatment, indicating promising application in POCT (point-of-care testing).
2. Experimental section
2.1. Materials and reagents
Ti foils (99.5%) were acquired from Alfa Aesar Company. An aniline monomer (99.5%) was purchased from J&K Scientific, Ltd., Beijing, China. Glucose oxidase (GOx) was obtained from Shanghai Bioengineering Co. Ltd. HAuCl4·3H2O was purchased from Sigma-Aldrich, USA. Diethylene glycol (DEG), HCl, CH3CH2OH, C6H12O6 and other reagents were purchased from Guangzhou Chemical Reagent Factory. All materials were used without further purification.2.2. Apparatus
The XRD characterization was performed using a D8 Tool XRD powder diffractometer. The PEC electrodes were observed through a SU8010 field emission scanning electron microscope (SEM, Hitachi, Japan) and JEM-2100 transmission electron microscope (TEM, JEOL Ltd., Japan). XPS data were characterized by Thermo Scientific ESCALAB250 using an Al target. The light absorption capacity of the material was surveyed via a UV-vis absorption spectrophotometer (JASCO, UV-550). Fourier transform infrared (FTIR) spectrometry was performed with KBr in the range of 4000–400 cm−1 (Thermo Fisher Scientific, Waltham, MA, USA). The Raman spectra of the samples were recorded at 514 nm via a reflex laser Raman spectrograph (Renishaw Corporation). The PEC tests were performed in the PBS buffer (pH 7.0) on an electrochemical workstation (CHI Instruments, Chenhua, Shanghai, China). The light source was a 500 W Xenon lamp equipped with a UV-cutoff filter (>380 nm). The PEC tests were performed with a classic three-electrode system using a GOx@Au–PANI–TiONTA modified Ti foil, Ag/AgCl, and Pt foil as the working, reference, and counter electrodes, respectively.2.3. Preparation of TiONTA and PANI–TiONTA electrodes
TiONTA were prepared via anodization following a previously described method.18 After surface treatment by acetone, ethanol, and deionized (DI) water, the foils were dried with pure N2 gas. The titanium substrate was anodized by a voltage-stabilized source (MS-1002D) with a titanium gauze counter electrode. Anodization was performed at 20 V for 1 h in an ethylene glycol solution containing 0.1 M HN4F and 1 M water. Thereafter, the TiONTA electrode was washed with water, dried in N2, and aged at 400 °C in air for 3 h at a heating rate of 2 °C per minute. Before electrodeposition, the TiONTA electrode was allowed to stand for 1 h in a solution containing 0.1 M aniline. Electrodeposition was carried out in a three-electrode system in a solution containing 0.05 M aniline and 0.5 M H2SO4 at 1 V. The electrode was washed with acetone and water and dried at 60 °C.2.4. Fabrication of the GOx@Au–PANI–TiONTA composite electrode
The GOx@Au–PANI–TiONTA electrodes were prepared by immersing the PANI–TiONTA composite in 50 mL of HAuCl4 (0.01 mg mL−1) in a quartz beaker. The mixture was deoxidized with N2 gas for 30 min and illuminated by UV lamps (20 W) a few times. Then, the Au–PANI–TiONTA electrode was rinsed with water and purged with N2. The electrodeposition and photodeposition times were optimized before the tests (Fig. S1 and S2†). GOx was loaded onto the electrode by transferring 20 mL of 1.0 mg mL−1 GOx on the one side of the Au–PANI–TiONTA electrode and dried in air at 4 °C.3. Results and discussion
3.1. Design strategy of the GOx@Au–PANI–TiONTA biosensor
The PEC system was fabricated, as illustrated in Scheme 1A. TiONTA was prepared via the anodic oxidation treatment. PANI was then grown on TiONTA via electrochemical polymerization. PANI in this system could attract AuCl4− on its protonated secondary amines for AuNP deposition. Thereafter, AuNPs were successfully attached to TiONTA with polyaniline through photodeposition for the loading of GOx.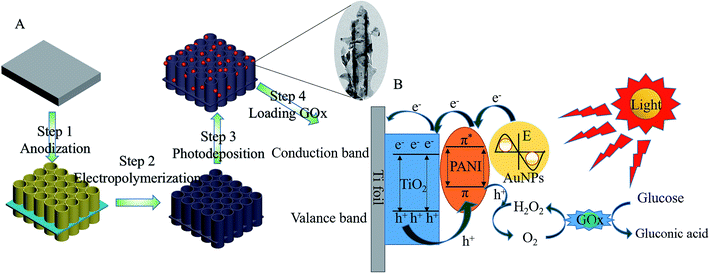 | ||
| Scheme 1 (A) Preparation of GOx@Au–PANI–TiONTA and (B) detection of glucose at the GOx@Au–PANI–TiONTA Ti foil electrode. | ||
3.2. Characterization of TiONTA, PANI–TiONTA, and Au–PANI–TiONTA composites
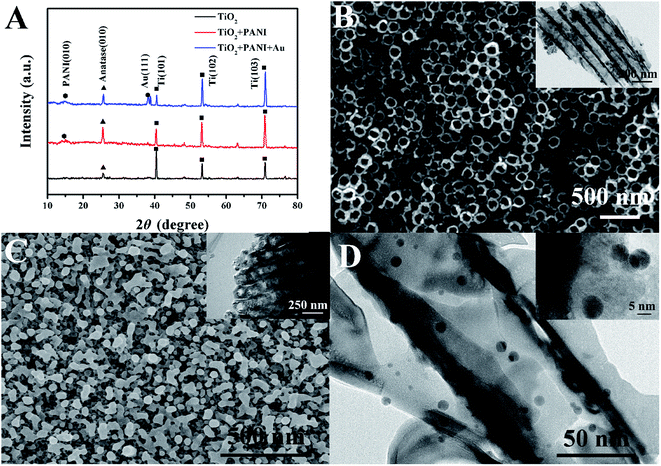
The crystal phases of TiONTA, PANI–TiONTA and Au–PANI–TiONTA were first analyzed via XRD patterns (Fig. 1A). The diffraction peaks of TiONTA located at 38.4°, 40.2°, 62.9°, 70.9°, 76.6° and 53.0° corresponded well with the Ti diffraction peaks in JCPDS no. 44-1294. The diffraction peak at 25.4° could confirm the presence of the anatase phase in TiONTA (JCPDS no. 73-1764). Moreover, the new diffraction peak located at 14.5° proved the presence of PANI (JCPDS no. 49-2499).19 The weak and broad peaks indicated the presence of leucoemeraldine structures (C6H5N)n. An evident peak at 38.2° occurred in the XRD pattern of Au–PANI–TiONTA, which coincided with Au (111) according to JCPDS no. 04-0784. Thus, a ternary composite composed of TiONTA, PANI, and AuNPs was successfully confirmed.The morphology and structure of TiONTA, PANI–TiONTA, and Au–PANI–TiONTA composites were observed via SEM and TEM. As shown in Fig. 1B, a highly ordered TiONTA was obtained after anodization. The morphology of TiONTA presented in the TEM image is consistent with that shown in the SEM image (inset in Fig. 1B). The interior diameter of tubiform nanostructures was approximately 80 nm with a definite marginal structure. After PANI was deposited, the top of the TiO2 nanotube array was covered by a PANI layer, and the interior diameter of tubiform nanostructures became smaller (Fig. 1C). The TEM image shows that the inner wall of the TiO2 nanotubes was filled with PANI (inset in Fig. 1C). The combination of gold nanoparticles and the PANI–TiONTA composite structure was revealed by the TEM image of the Au–PANI–TiONTA composite (Fig. 1D). Numerous dark nanoparticles were observed on the inner TiO2 nanotube wall, suggesting that AuNPs were successfully deposited onto the TiONTA–PANI composite. The TEM image also demonstrated that the average particle size of AuNPs was approximately 5 nm (inset in Fig. 1D). AuNPs were tightly bound to the TiO2 tube via PANI. The large surface area provided a place for surface reactions, and the hierarchical heterogeneous structure provided a high-speed channel for electron transfer and substance diffusion.
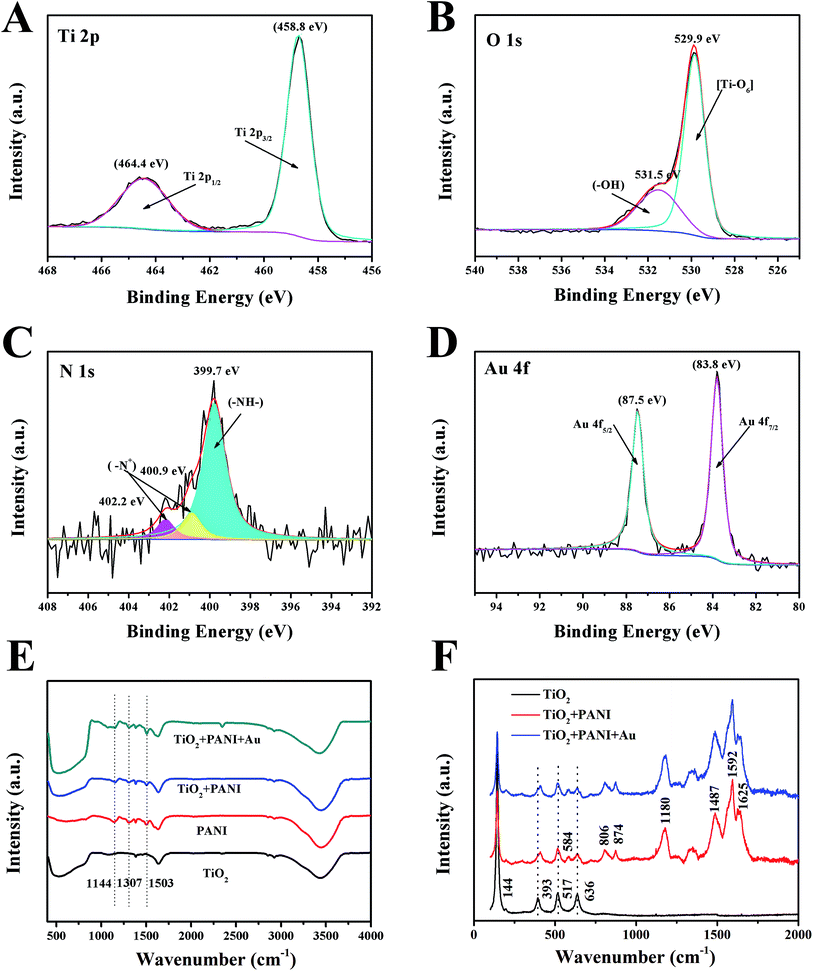
The XPS spectrum of Au–PANI–TiONTA showed that the electrode was composed of Ti, O, C, N, and Au elements (Fig. S3†). The high-resolution XPS spectrum of Ti 2p revealed two peak components at the binding energies of 458.8 and 464.4 eV (Fig. 2A), corresponding to Ti 2p3/2 and Ti 2p1/2.20 The spectrum of O 1s showed two peaks located at 531.5 and 529.9 eV (Fig. 2B), which were assigned to the Ti–OH species and the lattice oxygen [Ti–O6] species, respectively. The peaks of titanium and oxygen revealed the characteristics of typical titanium dioxide compounds. The N 1s spectrum indicated that the PANI characteristic peak was composed of an amine peak at 399.7 eV and two high-energy tail peaks at 400.9 and 402.2 eV (Fig. 2C),21 which was due to the positively charged N atoms with a continuous distribution of binding energy or positively charged N atoms in different surroundings arising from inter- and intra-chain charge distributions.22 The N 1s peak at 400.9 eV suggested a highly conductive state of PANI. The Au 4f7/2 and Au 4f5/2 spin-orbital splitting photoelectron peaks are located at 83.8 and 87.6 eV (Fig. 2D), respectively, corresponding well to the standard binding energy of Au.21 These results of the elemental analysis were consistent with the results obtained from XRD measurements.
The structural information of TiONTAs, PANI, PANI–TiONTA and Au–PANI–TiONTA composites were further investigated through FTIR spectrometry (Fig. 2E). The FTIR spectrum of TiONTA showed its broadband at ∼3400 cm−1, which is attributed to the O–H stretching vibration of the surface hydroxyl group. The broad absorption at 400–800 cm−1 was due to the Ti–O–Ti bridging vibration and Ti–O stretching.10 PANI displayed three characteristic peaks at 1144, 1307, and 1503 cm−1, which is attributed to the C–H in-plane bending vibration of the substituted benzene, C![[double bond, length as m-dash]](https://www.rsc.org/images/entities/char_e001.gif) C stretching vibration of quinoid and benzenoid rings, and N
C stretching vibration of quinoid and benzenoid rings, and N![[double bond, length as m-dash]](https://www.rsc.org/images/entities/char_e001.gif) P
P![[double bond, length as m-dash]](https://www.rsc.org/images/entities/char_e001.gif) N (P represented the quinoid ring) stretching, respectively.23 The spectrum of PANI–TiO2 exhibited the characteristic peaks of PANI and TiO2. Furthermore, the characteristic FTIR bands for PANI at 1144, 1037, and 1503 cm−1 showed a redshift in different degrees. In particular, the characteristic band at 1144 cm−1 of C–H in-plane bending vibration of the substituted benzene shifted to 1154 cm−1 because the strong N–O bonding between PANI and TiO2 nanotubes confined the chain vibration of PANI.10 However, Au nanoparticles, which deposited onto PANI–TiO2, did not produce any typical FTIR absorption but caused a tiny positive shift. To further confirm the interaction between polyaniline and titanium dioxide, Raman tests were also performed. After PANI was deposited on TiO2, a new band was found at 584 cm−1 and the peak at 393 cm−1 redshifted (Fig. 2F). In addition, the deposition of AuNPs did not cause a significant shift in the Raman characteristic peaks.
N (P represented the quinoid ring) stretching, respectively.23 The spectrum of PANI–TiO2 exhibited the characteristic peaks of PANI and TiO2. Furthermore, the characteristic FTIR bands for PANI at 1144, 1037, and 1503 cm−1 showed a redshift in different degrees. In particular, the characteristic band at 1144 cm−1 of C–H in-plane bending vibration of the substituted benzene shifted to 1154 cm−1 because the strong N–O bonding between PANI and TiO2 nanotubes confined the chain vibration of PANI.10 However, Au nanoparticles, which deposited onto PANI–TiO2, did not produce any typical FTIR absorption but caused a tiny positive shift. To further confirm the interaction between polyaniline and titanium dioxide, Raman tests were also performed. After PANI was deposited on TiO2, a new band was found at 584 cm−1 and the peak at 393 cm−1 redshifted (Fig. 2F). In addition, the deposition of AuNPs did not cause a significant shift in the Raman characteristic peaks.
3.3. Photoelectrochemical analysis of TiONTA, PANI–TiONTA, and Au–PANI–TiONTA composites
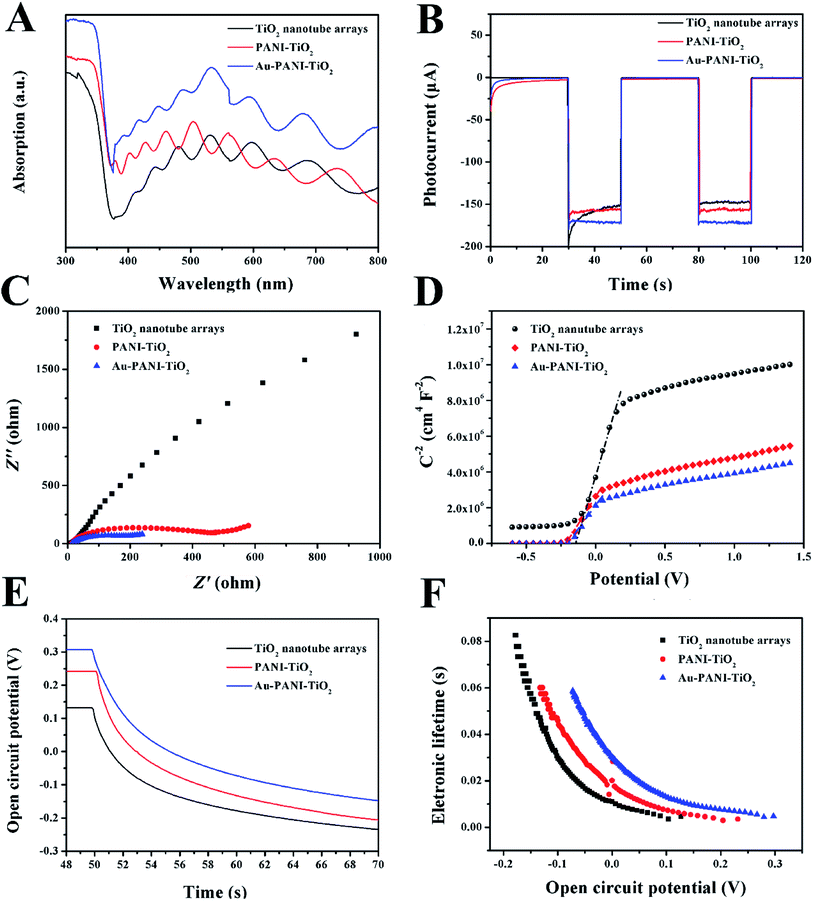
The light absorption of TiONTA, PANI–TiONTA and Au–PANI–TiONTA composites was analyzed via UV-vis diffuse reflectance spectroscopy. The TiONTA samples showed a strong UV absorption with an absorption edge at 380 nm (Fig. 3A), which could be attributed to the electron transition of anatase from the valence band to the conduction band. A strong absorption between 380 and 450 nm could be observed when PANI was deposited on the TiONTAs. This absorption was probably due to the HOMO and LUMO orbit transitions of PANI.3 When AuNPs were deposited onto the PANI–TiO2 composite, the absorption in the visible-light region was promoted. The poor absorption in the visible region of intrinsic titanium dioxide was mitigated in the presence of AuNPs and PANI.The photocurrents of TiONTA-, PANI–TiONTA-, and Au–PANI–TiONTA-modified electrodes were recorded to evaluate the photoelectric conversion efficiency (Fig. 3B). These electrodes displayed a negligible current in the absence of illuminance and a sudden increase in photocurrent after they were illuminated by intermittent visible incident light. The photocurrent of PANI–TiONTA was ∼6% higher than that of TiONTA because of the heterostructure of PANI–TiONTA. PANI might prevent electron–hole recombination, thereby facilitating electron migration from TiONTA to the substrate. The Au–PANI–TiONTA electrodes presented a photoresponse ∼10% higher than that of the TiONTA electrode because of the ability of AuNPs to enhance the visible-light absorption and improve electrode conductivity. The results of light absorption and light response corroborated the advantage of the Au–PANI–TiONTA composite in photoelectric conversion efficiency and signal collection.
To understand the reason for enhanced PEC performance, the intrinsic electron properties of these electrodes were studied. The high electron transfer property of the Au–PANI–TiO2 electrode was further explored by electrochemical impedance measurements, as shown in Fig. 3C. A typical frequency from 100 kHz to 0.1 Hz and a 5 mV alternating current disturbance was chosen for the EIS test. The high-frequency intercept of the curve on the real axis verified the solution resistance (Rsol), which was close for TiONTA, PANI–TiONTA, and Au–PANI–TiONTA electrodes because the electrolyte was the same. The radius of the small semicircle in the high-frequency range could reflect the charge-transfer resistance in the depletion layer.32 The charge-transfer resistance of the Au–PANI–TiO2 electrode was much smaller than that of TiONTA and PANI–TiO2 composites, indicating that the presence of polyaniline and Au particles accelerated the electron transfer on the electrode surface.24
The carrier density (ND) of the electrodes was calculated via the capacitance measurement following eqn (1),25
 | (1) |
 | (2) |
The lifetime of the photogenerated carriers was studied via an open circuit potential (OCP) method. When the electrode was illuminated by light, the photogenerated electron–hole pair accumulated on the cathode and anode to generate photovoltage. The OCP of TiONTA, PANI–TiO2, and Au–PANI–TiO2 electrodes were ∼135, ∼240, and ∼310 mV, respectively. When the illumination disappeared, the OCP decayed because of the recombination of the photogenerated electron–hole pair (Fig. 3E). The Au–PANI–TiO2 electrode exhibited a slower OCP decrement than that of TiONTA and PANI–TiO2 electrodes. The precise electron lifetime was calculated by eqn (3):
 | (3) |
3.4. Analytical performance of the GOx@Au–PANI–TiO2-based biosensor for glucose
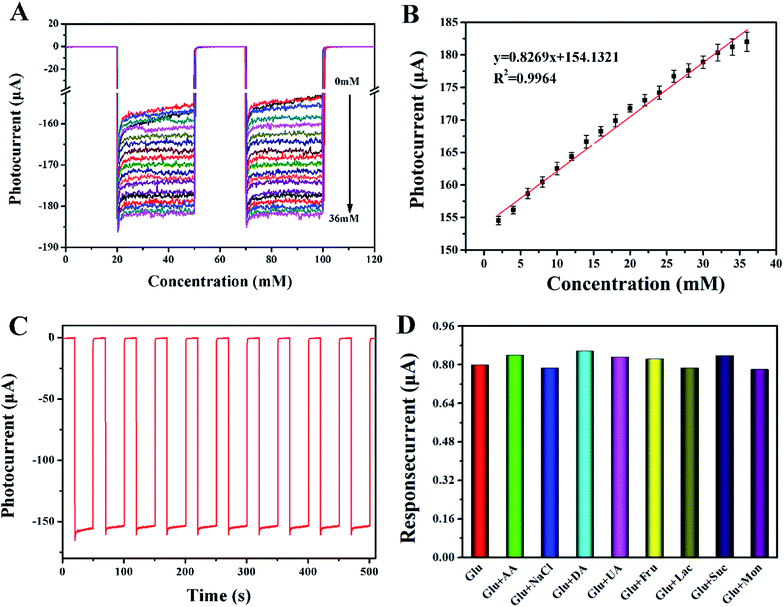
According to previous reports, 0.2 V was selected as the test voltage. As shown in Fig. 4A, the photocurrent increased gradually when 2 to 36 mM glucose was added. The plot of photocurrent versus the glucose concentration showed good linearity with a slope (sensitivity) of 0.83 μA mM−1 and a correlation coefficient of 0.992 (Fig. 4B). The detection limit calculated with 3S/N was 0.02 mM. The distinct detection mechanism is shown in Scheme 1B. GOx immobilized on the Au–PANI–TiONTA electrode could oxidize glucose into gluconic acid and reduce O2 to H2O2. When the Au–PANI–TiONTA electrode was irradiated under visible light, the free electrons in AuNPs were excited to form “hot” electrons and move to the LUMO orbit of PANI. These electrons, together with electrons excited from the HOMO orbit of PANI, jumped to the conduction band of anatase, and the holes generated in the valence band of TiO2 migrated to the HOMO orbit of PANI to produce the photocurrent upon the cyclic oxidation of H2O2 to O2. The catalytic process of GOx and the photocurrent response can be described as follows.26| GOx(FAD) + glucose → GOx(FADH2) + glucose acid | (4) |
| GOx(FADH2) → GOx(FAD) + H2O2 | (5) |
 | (6) |
| 2h+VB + H2O2 → O2 + 2H + (anode) |
| 2e+CB + 2H+ + H2O2 → 2H2O (cathode) |
The repeatability of the GOx@Au–PANI–TiO2-based biosensor for glucose was examined at 2 mM glucose by 10 intervals of intermittent visible light. As shown in Fig. 4C, the relative standard deviation (RSD) for the photocurrent response was 1.53%. The results verified that the signal of the GOx@Au–PANI–TiO2-modified electrode was stable. The possible interference on glucose detection was also evaluated with several kinds of interfering components coexisting in blood samples, such as ascorbic acid, NaCl, dopamine, uric acid, fructose, Lac, sucrose, and mannose. The photocurrent of the GOx@Au–PANI–TiO2-based biosensor was tested at 2 mM glucose and its mixture with 0.2 mM of interfering components. As shown in Fig. 4D, the current variation upon the presence of interfering components was less than 5%, suggesting the satisfactory anti-interference property of the PEC biosensor.
Different from the performances of those previously reported glucose biosensors (Table 1), the proposed biosensor showed a detectable concentration range from 2 to 36 mM, which was just the range of glucose in practical clinic blood samples. To confirm the practicability of the proposed biosensor, the recovery tests were performed by adding glucose in real human serum samples. The results indicated an acceptable recovery (Table S2†). Thus, this PEC biosensor was superior to those biosensors and could be used directly for POCT of blood glucose without any pretreatment.
4. Conclusion
A ternary PEC biosensor was developed by the deposition of PANI and AuNPs on TiONTA and affinity immobilization of GOx. The composition and structure of the composites were characterized by SEM, TEM, XRD, XPS, FTIR, UV-vis and Raman spectroscopic techniques. In the presence of PANI and AuNPs, the TiONTA showed an enhanced photoelectric response, which has been explained through electrochemical characterization from the perspective of electron transfer impedance, carrier density, and carrier lifetime. The GOx@Au–PANI–TiO2-based biosensor exhibited satisfactory performance at a low bias voltage under visible light in a range of blood glucose concentration, indicating its potential application in clinical diagnosis. Furthermore, when GOx was substituted by other oxidases or the oxidases were labeled to DNA or antibody, the proposed PEC platform could be extended for the preparation of different PEC biosensors for the substrates of oxidases, nucleic acids and proteins.Conflicts of interest
The authors declare that they have no known competing financial interests or personal relationships that could have appeared to influence the work reported in this paper.Acknowledgements
This research was financially supported by the Finance Science and Technology Project of Hainan Province (No. ZDYF2018106, ZDYF2019161, and 2019RC221), the National Natural Science Foundation of China (No. 51762012, 81860373, 51862006 and 82060386), CAMS Innovation Fund for Medical Sciences (No. 2019-I2M-5-023), Key Laboratory Open Project Fund of Emergency and Trauma of Ministry of Education (No. KLET-201910), Key Laboratory Open Project Fund of Hainan University (No. 2018008).References
- W. W. Zhao, J. J. Xu and H. Y. Chen, Photoelectrochemical bioanalysis: the state of the art, Chem. Soc. Rev., 2015, 44, 729–741 Search PubMed.
- W. W. Zhao, J. J. Xu and H. Y. Chen, Photoelectrochemical enzymatic biosensors, Biosens. Bioelectron., 2017, 92, 294–304 Search PubMed.
- F. Cao, J. Xiong, F. Wu, Q. Liu, Z. Shi, Y. Yu, X. Wang and L. Li, Enhanced photoelectrochemical performance from rationally designed anatase/rutile TiO2 heterostructures, ACS Appl. Mater. Interfaces, 2016, 8, 12239–12245 Search PubMed.
- J. Bai and B. Zhou, Titanium dioxide nanomaterials for sensor applications, Chem. Rev., 2014, 114, 10131–10176 Search PubMed.
- P. Roy, S. Berger and P. Schmuki, TiO2 Nanotubes: Synthesis and Applications, Angew. Chem., Int. Ed., 2011, 50, 2904–2939 Search PubMed.
- C. Li, Q. Kang, Y. Chen, J. Li, Q. Cai and S. Yao, Analyst, 2010, 135, 2806–2810 Search PubMed.
- Q. Kang, L. Yang, Y. Chen, S. Luo, L. Wen, Q. Cai and S. Yao, Anal. Chem., 2010, 82, 9749–9754 Search PubMed.
- J. Li, X. Li, Q. Zhao, Z. Jiang, M. Tadé, S. Wang and S. Liu, Polydopamine-assisted decoration of TiO2 nanotube arrays with an enzyme to construct a novel photoelectrochemical sensing platform, Sens. Actuators, B, 2018, 255, 133–139 Search PubMed.
- S. Bhadra, D. Khastgir, N. K. Singha and J. H. Lee, Progress in preparation, processing, and applications of polyaniline, Prog. Polym. Sci., 2009, 34, 783–810 Search PubMed.
- W. Cui, J. He, H. Wang, J. Hu, L. Liu and Y. Liang, Polyaniline hybridization promotes photo-electro-catalytic removal of organic contaminants over 3D network structure of rGH-PANI/TiO2 hydrogel, Appl. Catal., B, 2018, 232, 232–245 Search PubMed.
- D. Chen, H. Zhang, X. Li and J. Li, Biofunctional titania nanotubes for visible-light-activated photoelectrochemical biosensing, Anal. Chem., 2010, 82, 2253–2261 Search PubMed.
- J. Zhu, X. Huo, X. Liu and H. Ju, Gold nanoparticles deposited polyaniline–TiO2 nanotube for surface plasmon resonance-enhanced photoelectrochemical biosensing, ACS Appl. Mater. Interfaces, 2016, 8, 341–349 Search PubMed.
- F. Xu, D. Bai, J. Mei, D. Wu, Z. Gao, K. Jiang and B. Liu, Enhanced photoelectrochemical performance with in situ Au modified TiO2 nanorod arrays as photoanode, J. Alloys Compd., 2016, 688, 914–920 Search PubMed.
- L. Wu, F. Li, Y. Xu, J. W. Zhang, D. Zhang, G. Li and H. Li, Plasmon-induced photoelectrocatalytic activity of Au nanoparticles enhanced TiO2 nanotube arrays electrodes for environmental remediation, Appl. Catal., B, 2015, 164, 217–224 Search PubMed.
- V. Bajić, B. Spremo-Potparević, L. Živković, A. Čabarkapa, J. Kotur-Stevuljević, E. Isenović, D. Sredojević, I. Vukoje, V. Lazić, S. P. Ahrenkiel and J. M. Nedeljković, Surface-modified TiO2 nanoparticles with ascorbic acid: antioxidant properties and efficiency against DNA damage in vitro, Colloids Surf., B, 2017, 155, 323–331 Search PubMed.
- Z. Xu, Y. Lin, M. Yin, H. Zhang, C. Cheng, L. Lu, X. Xue, H. J. Fan, X. Chen and D. Li, Understanding the enhancement mechanisms of surface plasmon-mediated photoelectrochemical electrodes: a case study on Au nanoparticle decorated TiO2 nanotubes, Adv. Mater. Interfaces, 2015, 2, 1500169 Search PubMed.
- K. Zhou, Y. Zhu, X. Yang, J. Luo, C. Li and S. Luan, A novel hydrogen peroxide biosensor based on Au–graphene–HRP–chitosan biocomposites, Electrochim. Acta, 2010, 55, 3055–3060 Search PubMed.
- Q. Huang, H. Chen, L. Xu, D. Lu, L. Tang, L. Jin, Z. Xu and W. Zhang, Visible-light-activated photoelectrochemical biosensor for the study of acetylcholinesterase inhibition induced by endogenous neurotoxins, Biosens. Bioelectron., 2013, 45, 292–299 Search PubMed.
- Y. Lin, D. Li, J. Hu, G. Xiao, J. Wang, W. Li and X. Fu, Highly efficient photocatalytic degradation of organic pollutants by PANI-modified TiO2 composite, J. Phys. Chem. C, 2012, 116, 5764–5772 Search PubMed.
- G. A. Snook, P. Kao and A. S. Best, Conducting-polymer-based supercapacitor devices and electrodes, J. Power Sources, 2011, 196, 1–12 Search PubMed.
- K. Yang, K. Huang, Z. He, X. Chen, X. Fu and W. Dai, Promoted effect of PANI as electron transfer promoter on CO oxidation over Au/TiO2, Appl. Catal., B, 2014, 158–159, 250–257 Search PubMed.
- X. Huo, P. Liu, J. Zhu, X. Liu and H. Ju, Electrochemical immunosensor constructed using TiO2 nanotubes as immobilization scaffold and tracing tag, Biosens. Bioelectron., 2016, 85, 698–706 Search PubMed.
- M. Irimia-Vladu, N. Marjanovic, A. Vlad, A. M. Ramil, G. Hernandez-Sosa, R. Schwoödiauer, S. Bauer and N. S. Sariciftci, Vacuum-processed polyaniline–C60 organic field-effect transistors, Adv. Mater., 2008, 20, 3887–3892 Search PubMed.
- J. Luo, W. Zhong, Y. Zou, C. Xiong and W. Yang, Preparation of morphology-controllable polyaniline and polyaniline/graphene hydrogels for high-performance binder-free supercapacitor electrodes, J. Power Sources, 2016, 319, 73–81 Search PubMed.
- H. Huo, Z. Xu, T. Zhang and C. Xu, Ni/CdS/TiO2 nanotube array heterostructures for high-performance photoelectrochemical biosensing, J. Mater. Chem. A, 2015, 3, 5882–5888 Search PubMed.
- P. Liu, X. Huo, Y. Tang, J. Xu, X. Liu and D. K. Y. Wong, A TiO2 nanosheet-g-C3N4 composite photoelectrochemical enzyme biosensor excitable by visible irradiation, Anal. Chim. Acta, 2017, 984, 86–95 Search PubMed.
- M. Zheng, Y. Cui, X. Li, S. Liu and Z. Tang, Photoelectrochemical sensing of glucose based on quantum dot and enzyme nanocomposites, J. Electroanal. Chem., 2011, 656, 167–173 Search PubMed.
- W. Tang, L. Li and X. Zeng, A glucose biosensor based on the synergistic action of nanometer-sized TiO2 and polyaniline, Talanta, 2015, 131, 417–423 Search PubMed.
- X. Zhang, M. Liu, H. Liu and S. Zhang, Low-toxic Ag2S quantum dots for photoelectrochemical detection glucose and cancer cells, Biosens, Bioelectron, 2014, 56, 307–312 Search PubMed.
- W. Wang, L. Bao, J. Lei, W. Tu and H. Ju, Visible light-induced photoelectrochemical biosensing based on oxygen-sensitive quantum dots, Anal. Chim. Acta, 2012, 744, 33–38 Search PubMed.
- X. Zhang, F. Xu, B. Zhao, X. Ji, Y. Yao, D. Wu, Z. Gao and K. Jiang, Synthesis of CdS quantum dots decorated graphene nanosheets and non-enzymatic photoelectrochemical detection of glucose, Electrochim. Acta, 2014, 133, 615–622 Search PubMed.
- X. Yu, Z. Zhao, J. Zhang, W. Guo, J. Qiu, D. Li, X. Mou, L. li, A. Li and H. Liu, Small, 2016, 20, 2759–2767 Search PubMed.
Footnote |
| † Electronic supplementary information (ESI) available. See DOI: 10.1039/d0ra06890j |
| This journal is © The Royal Society of Chemistry 2020 |

