 Open Access Article
A facile method for the preparation of black TiO2 by Al reduction of TiO2 and their visible light photocatalytic activity
Jun Li *,
En-Hui Wu,
Jing Hou,
Ping Huang,
Zhong Xu,
Yan Jiang
 ,
Qian-Shu Liu and
Yu-Quan Zhong
Panzhihua International Research Institute of Vanadium and Titaniunm, Panzhihua University, Panzhihua 617000, People's Republic of China. E-mail: lidejun163@126.com
First published on 21st September 2020
Abstract
Black TiO2 has attracted widespread attention due to its visible light absorption and wide range of applications. However, the currently reported preparation methods for black TiO2 are not suitable for large-scale production due to its being prepared under high vacuum and over a long time. We have successfully prepared black TiO2 under normal pressure and short time conditions. The as-prepared black titanium dioxide was characterized by XRD, XPS, TEM, UV-visible absorption spectrum and other characterization methods. The result shows that the as prepared black titanium dioxide had a disordered structure and oxygen vacancy defects on the surface, and exhibits excellent visible and near infrared absorption performance. The black TiO2 sample was prepared under 650 °C 60 min exhibits excellent visible light photocatalytic performance, and can degrade 56% MO after visible light irradiation for 120 min.
1. Introduction
TiO2 has become one of the most studied photocatalyst materials since the Japanese scientists Fujishima and Hondain discovered that the TiO2 electrode photolyzes water.1 TiO2 has been widely studied for hydrogen production,2,3 dye-sensitized solar cells,4,5 CO2 reduction,6–8 environmental pollution removal,9 toxic gas oxidation10 and photocatalytic organic synthesis of chemicals.11 However, TiO2 can only absorb the energy in the ultraviolet region because the band width of TiO2 is 3.0 to 3.2 eV. The solar energy utilization rate of TiO2 is seriously insufficient due to the UV light area only accounting for less than 5% of sunlight. Many methods such as element doping, oxygen vacancies, dye-sensitization and preparation of composite materials have been made to improve light absorption properties of TiO2 materials.12–24 However, the results are not up to the mark.Black TiO2 is first produced by Chen et al. in 2011,25 which have received widespread attention due to enhanced sunlight absorption by forming oxygen vacancies and Ti3+ in TiO2 or introducing a disordered layer on the surface of highly crystalline TiO2. Since then, black TiO2 became an active research area for many applications which include photocatalytic pollutant degradation, hydrogen production through water splitting, photocatalytic CO2 reduction, dye sensitized solar cells, lithium batteries and other photoelectrochemical applications with great success.
Currently, different strategies have been employed for the synthesis of black TiO2. The preparation methods and process conditions of common black titanium dioxide are shown in Table 1.
| Number | Preparation process | Process conditions |
|---|---|---|
| 1 | High/low pressure hydrogen treatment | The black TiO2 nanocrystals was synthesized in a 20 bar H2 atmosphere at elevated temperatures ranges from 200 to 450 °C for few days25–27 |
| 2 | Hydrogen–argon treatment | The black TiO2 nanocrystals were obtained by under H2–Ar mixture at 450 °C for 1 h28 |
| 3 | Argon–nitrogen treatment | The black TiO2–B nanoparticles were obtained by heating the solid product obtained in the above process at 340 °C in Ar atmosphere for 2 h29 |
| A core–shell black anatase TiO2 with a high concentration of Ti3+ and oxygen vacancy defects by a one-pot synthetic method calcination of colloidal TiO2 precursor under N2 atmosphere alone30 | ||
| 4 | Hydrogen nitrogen treatment | Black TiO2 through hydrogen spill in a H2–N2 atmosphere at 200–700 °C31 |
| 5 | Argon treatment | The black TiO2 precursor (Ni doped TiO2) was mixed with 2 g of NaBH4 and heated at 350 °C under Ar atmosphere for 1 h32 |
| 6 | Plasma treatment | Precursor TiO2 was subjected to heat at 350–500 °C for 3 h under the hot filament (2000 °C) resulted in black colored TiO2 nanotubes33 |
| 7 | NaBH4 reduction | P25 (anatase and rutile) was ground thoroughly with NaBH4 and the mixture was heated in a tubular furnace under Ar atmosphere at 300–400 °C for different time intervals up to 1 h34 |
| 8 | Metal reduction | Black TiO2 nanoparticles could be synthesized through reduction with various metals. Aluminum35 and magnesium36 are identified as reducing agents to obtain black TiO2. Wang et al. used Al as a reducing agent in an evacuated two-zone vacuum furnace at 300 to 50 °C. In a typical procedure, pre-annealing of aluminum was done at 800 °C for 6 h and that of pristine TiO2 was done at 500 °C for 20 h respectively. Further the post annealing was carried out at 800 and 900 °C for 12 h respectively37 |
Hydrogenation is the widely used method for synthesizing black TiO2. Although there are many ways to prepare black titanium dioxide. However, novel green synthesis methods which are easy, low cost, fast and eco-friendly need to be further developed.
The methods for preparing black titanium dioxide described above all require high-pressure hydrogen or inert gas or vacuum conditions. The preparation conditions are relatively harsh, the equipment requirements are high and continuous preparation is very difficult, resulting in higher costs for preparing black titanium dioxide and difficult to prepare on a large scale.
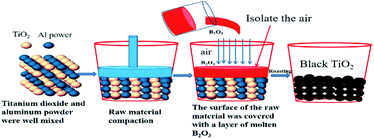
In this paper, the author cleverly designed a molten B2O3 covering the surface of the reaction raw materials to effectively isolate the air and B2O3 can be recycled repeatedly, as shown in Fig. 1. Black titanium dioxide can be prepared under normal pressure, which does not require inert atmosphere or vacuum conditions. At the same time, this method has low reaction temperature, short reaction time and low equipment requirements. The cost of preparing black titanium dioxide can greatly reduce and easy to realize large-scale preparation. The photocatalytic activity of the synthesized black TiO2 materials was also investigated by the degradation of methyl orange (MO) under the visible light irradiation.
At present, the preparation methods of black TiO2 mainly include gas phase atmosphere sintering (high pressure pure hydrogen),25,26 chemical reduction (aluminum reduction, magnesium reduction),27,28 chemical oxidation29 and electrochemical reduction.30 However, these preparation methods are not suitable for large-scale production due to their high cost. Therefore, it is of great significance to seek a simple, efficient and low-cost method for preparing black titanium dioxide.
In this paper, a novel method for preparation of black TiO2 by aluminothermic reduction had been studied. Through clever design, black TiO2 materials has been successfully prepared at a lower calcination temperature and a shorter time under normal pressure. The photocatalytic activity of the synthesized black TiO2 materials was also investigated by the degradation of methyl orange (MO) under the visible light irradiation.
2. Experimental
2.1 Preparation of black TiO2
Anatase type TiO2 (typically 0.4–0.6 μm in diameter) were purchased from Sichuan province excellence vanadium and titanium Co., Ltd. Aluminum powder (99.3% purity, 6 μm particle size) were purchased from Jiangsu tian yuan metal powder co., Ltd. Firstly, the anatase TiO2 powder mixed with Al powder was placed in alumina crucible. Secondly, an aluminum sheet as large as the corundum crucible was placed on the surface of the mixed raw material and then a layer of molten B2O3 was covered the surface of the aluminum sheet so as to isolate the raw material from air contact. Thirdly, corundum crucible was roasted in a resistance furnace. Finally, hydrochloric acid pickling method was used to remove excess Al from the as-prepared sample. The prepared sample was mixed with hydrochloric acid in a beaker at a stirring rate of 100 rpm, and it was filtered using a vacuum suction funnel after the reaction was completed. The concentration of hydrochloric acid was 4 mol L−1 and the liquid–solid ratio was 1![[thin space (1/6-em)]](https://www.rsc.org/images/entities/char_2009.gif) :
:![[thin space (1/6-em)]](https://www.rsc.org/images/entities/char_2009.gif) 25. The preparation process of black titanium dioxide was shown in Fig. 2.
25. The preparation process of black titanium dioxide was shown in Fig. 2.
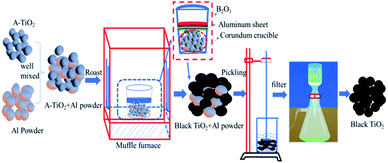 | ||
| Fig. 2 Schematic diagram of black titanium dioxide was synthesized by aluminothermic reduction and hydrochloric acid pickling. | ||
2.2 Photocatalytic activity test
Photocatalytic activity of the synthesized black TiO2 powders by the degradation of methylene orange (MO) under a 300 W xenon lamp equipped with a cutoff filter (λ > 420 nm). A quantity of 100 mg of photocatalyst was poised in a 200 mL aqueous MO dye solution (0.5 g L−1). Previous to the light, the suspensions were ultrasonicated for 25 min under dark condition to make sure that the MO dye was adsorbed to saturation level on the surface of catalysts.2.3 Sample characterization
Powder X-ray diffraction (XRD) profiles were obtained using a D/max22500PC of Japanese Science and Technology with Cu Kα (λ = 0.154 nm) radiation as the incident beam. Transmission electron microscopy (TEM) was performed on a Hitachi H-9000 instrument operating at 300 kV. Scanning electron microscopy (SEM) was performed on JEOL JSM-6060S and JSM-6700F instruments. XPS profiles were obtained using Phi-5000 VersaProbe of America.3. Results and discussion
3.1 XRD and Raman analysis of samples
Black TiO2 materials were successfully synthesized using an Al reduction process. Commercial anatase TiO2 power (50 g) were uniformly mixed with 30 g of Al powder, and then calcined at 650 °C for 60 min, 90 min, 120 min, 150 min. The pure TiO2 were then obtained after excess Al was removed by pickling with hydrochloric acid and distilled water.Macro picture of experimental results is depicted in Fig. 3(a). The color of anatase titanium dioxide starts to change from white to black at 650 °C for 60 min. The XRD patterns of the raw material and as-prepared samples are shown in Fig. 2(a). The prepared black TiO2 has good crystallinity, and its characteristic peaks match well with anatase TiO2 without any other diffraction peaks. The characteristic peak of the (101) plane of black TiO2 shifts to the right small diffraction angle and the larger the diffraction angle shifts to the right as the sintering time increases, which may be due to certain lattice defects.38 In addition, the half peak width of as-prepared black TiO2 is wider comparing with anatase TiO2, which indicate that the degree of crystallinity of as-prepared black TiO2 is poor compared with anatase TiO2 and the crystal size of as-prepared is smaller than the anatase TiO2.
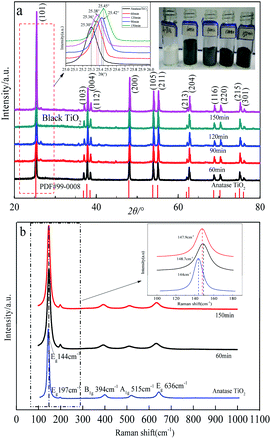 | ||
| Fig. 3 XRD and Raman analysis of samples. (a) XRD and macro pictures of samples; (b) Raman spectrum of the samples. | ||
Fig. 3(b) shows the Raman spectrum of the raw material and as-prepared samples. The strongest intensity Raman active mode at 144 cm−1 and three medium intensity Raman active modes at 394 cm−1, 515 cm−1, and 636 cm−1 were detected in all the samples, which match well with anatase TiO2. The as-prepared black TiO2 confirmed the presence of oxygen vacancies defects because the strongest Eg mode at 144 cm−1 broadening and blue shift compared with that of pristine anatase TiO2.
3.2 X-ray photoelectron spectroscopy (XPS) analysis of samples
Valence band position and useful information of chemical binding on the sample surface can be provided by X-ray photoelectron spectroscopy (XPS). Fig. 4(a–d) shows the Ti2p and O1s core level XPS spectra of the pristine TiO2 and as-prepared black TiO2. Fig. 3(a) shows the Ti2p XPS spectra of anatase TiO2 and black TiO2. The two Ti2p peaks of anatase TiO2 and black TiO2 were located at 458.6 eV and 464.4 eV match well with Ti4+ in TiO2.39 However, the significant Ti3+ signal could not be detected in the black TiO2. The possible reason is that Ti3+ didn't appear in the crystal lattice, but it plays an important role in color change.40 The O1s XPS spectra of the pristine TiO2 and black TiO2 are depicted in Fig. 3(c and d). The peak for O1s could be deconvoluted into two peaks at about 529.7 eV and 530.9 eV. The peaks at 529.7 eV in anatase TiO2 and black TiO2 were belong to the crystal lattice of the Ti–O bond, while the peaks at 530.9 eV or 531.4 eV were the external –OH group or H2O molecules absorbed on the anatase TiO2 and black TiO2 surface.41 It was clearly seen that –OH group absorption intensity of black TiO2 was significantly higher than that of anatase TiO2 due to the presence of oxygen vacancies in the black TiO2.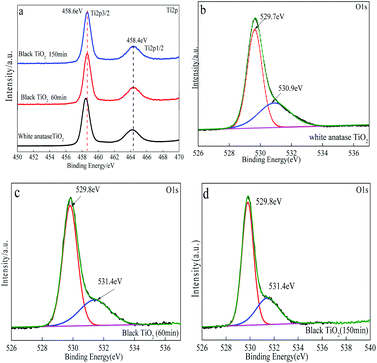 | ||
| Fig. 4 XPS analysis of the samples. (a) Ti2p core level XPS spectra of the TiO2 and black TiO2; (b–d) O1s core level XPS spectra of the TiO2 and black TiO2. | ||
3.3 SEM, EDS and HR-TEM analysis of samples
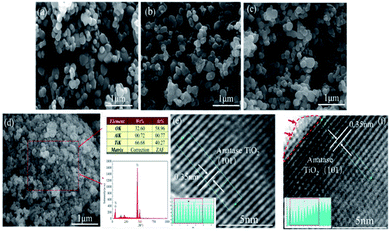
Fig. 5(a–c) shows SEM images of pristine TiO2 and black TiO2, respectively. Pristine TiO2 with a particle size of 200–300 nm, and the morphology of black TiO2 had not obvious sintering growth compared to pristine anatase TiO2. The EDS analysis (Fig. 4(d)) shows only trace amounts of Al in black TiO2.The morphology and structure of pristine TiO2 and as-prepared black TiO2 were further examined by TEM. Fig. 5(e and f) shows HR-TEM analysis of pristine TiO2 and black TiO2. A lattice space of as-prepared black TiO2 and pristine TiO2 were 0.35 nm, which were well-resolved (101) lattice plane of typical anatase TiO2 plane. Both HR-TEM and XRD analysis results indicate that the as-prepared black TiO2 contains a pure anatase phase. The area was marked by the red arrow in Fig. 4(f) could be seen that the as-prepared black TiO2 contained an outer disordered structure on the surface compared to pristine anatase TiO2.
3.4 UV-Vis diffuse reflectance spectroscopy analysis of samples
UV-Vis diffuse reflectance spectroscopy are used to evaluate the light absorption characteristics of the sample. The UV-Vis diffuse reflectance spectra is depicted in Fig. 6(a) shows the as-prepared black TiO2 exhibits excellent visible and near infrared absorption performance, and anatase TiO2 mainly absorb ultraviolet light. It can be clearly seen that the UV-visible spectrum of as-prepared black TiO2 occurred a red shift comparing with white anatase TiO2. Kubelka Munk function formula (αhv = C(hv − Eg)1/2) could be used to calculate the band gap of semiconductor materials based on UV-Vis DRS, as shown in Fig. 6(b). It can be seen that the band gap of the prepared black TiO2 was 2.4–2.8 eV, which was significantly narrowed compared with white TiO2 (3.1 eV). The band gap of black TiO2 was narrowed and the absorption spectrum expand to the visible light scope may be caused by Ti dangling bonds was related with oxygen vacancy defects.42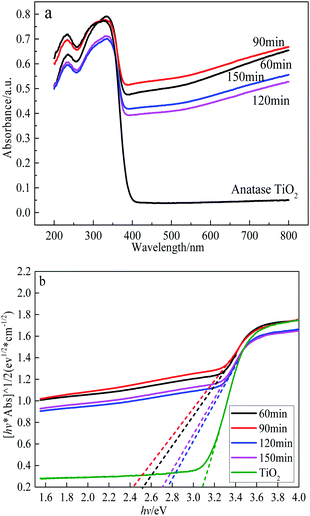 | ||
| Fig. 6 UV-Vis diffuse reflectance spectroscopy analysis. (a) UV-Vis diffuse reflectance spectroscopy of the TiO2 and black TiO2; (b) plots of (ahv)1/2 versus photon energy (hv). | ||
3.5 Photocatalytic activity analysis of samples
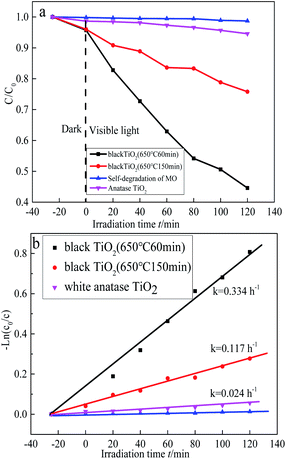
The photocatalytic activities of black TiO2 samples were evaluated by the decomposition of MO under visible light irradiation (>420 nm), as shown in Fig. 7(a). For comparison, pure anatase TiO2 was also tested under the same conditions, which can only degrade 5% MO within 120 min, respectively. The as-prepared black TiO2 sample (650 °C, 60 min) could degrade 56% MO after reaction for 120 min under visible light. However, the prepared black TiO2 (650 °C, 150 min) only degradation degrade 25% MO, which proves that extending the roasting time couldn't promote the visible light photocatalytic performance.The kinetic curves for the MO photodegradation were calculated according to the equation (ln(C0/C) = kt) and then plotted and displayed in Fig. 7(b). The order of photocatalytic performance of as-prepared photocatalysts is black TiO2 (650 °C, 60 min) > black TiO2 (650 °C, 150 min) > pure anatase TiO2, based on the k values.
3.6 Mechanism analysis and discussion
High absorption of visible-light and pollutants, and a lower electron/hole recombination rate can remarkable enhance the photocatalysis. A schematic illustration of the mechanism of enhanced photocatalytic performance of as-prepared black TiO2 is shown in Fig. 8.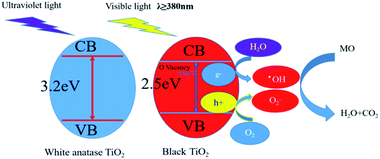 | ||
| Fig. 8 Proposed mechanism for the MO degradation on the as prepared black TiO2 photocatalyst under visible light irradiation. | ||
XRD, XPS, Raman, UV-Vis characterizations show that the prepared black titanium dioxide has formed a large number of oxygen vacancies. The presence of oxygen vacancies can reduce the recombination of electron–hole pairs and enhance visible light absorption by moving the top of VB upward and the bottom of CB downward, respectively, resulting in black TiO2 having excellent visible light photocatalytic activity.43
Although the prepared black TiO2 enhances visible light absorption, its photocatalytic activity under visible light is still unsatisfactory due to the short lifetime of electrons and holes excited by visible light. In order to overcome this bottleneck, as-prepared black TiO2 with a series of non-metal dopants (H, S, N and I) to increase photocatalytic activities under both UV and visible-light irradiations.44
4. Conclusion
In this study, the black TiO2 had been successfully synthesized by aluminothermic reduction and hydrochloric acid pickling. Compared with other preparation methods, this preparation method was suitable for large-scale production because it can be prepared at a lower calcination temperature and shorter calcination time under normal pressure conditions.The surface of as prepared black titanium dioxide had disorder structure and oxygen vacancy defects. The particles of prepared black titanium dioxide had no obvious sintering growth, which maintains the original appearance of raw titanium dioxide. The band gap of the prepared black TiO2 are 2.4–2.8 eV, which exhibits excellent visible and near infrared absorption performance. The black TiO2 sample was prepared under 650 °C, 60 min demonstrates the highest photocatalytic activity, which can degrade 56% MO after visible light irradiation for 120 min. The products shows excellent visible photocatalytic activity for dye degradation, which shows the good application value in water cleaning.
Conflicts of interest
There are no conflicts to declare.Acknowledgements
This study was financially supported the Science and Technology Support Program of Sichuan (2020YFH0195), the high-end talent introduction project of sichuan (SYZ202006) and the Application and Solar Technology Integration Sichuan Provincial Key Laboratory of University Program (TYNSYS-2018-Z-02).References
- A. Fujishima and K. Honda, Nature, 1972, 238, 37–38 CrossRef CAS.
- Ni, M. K. H. Leung, D. Y. C. Leung and K. Sumathy, Renewable Sustainable Energy Rev., 2007, 3, 401–425 CrossRef.
- J. Schneider, M. Matsuoka, M. Takeuchi, J. Zhang, Y. Horiuchi, M. Anpo and D. W. Bahnemann, Chem. Rev., 2014, 19, 9919–9986 CrossRef.
- K. H. Park, D. W. Park and M. Dhayal, Electrochem. Commun., 2008, 7, 1098–1100 CrossRef.
- X.-D. Li, D. W. Zhang, X. J. Yin, S. Chen, J.-H. Shi, Z. Sun and S.-M. Huang, J. Solid State Electrochem., 2011, 6, 1271–1277 CrossRef.
- A. Corma and H. Garcia, J. Catal., 2013, 4, 168–175 CrossRef.
- K. Kočí, L. Obalová and Z. Lacný, Nephron Clin. Pract., 2008, 1, 1–9 Search PubMed.
- J. Low, B. Cheng and J. Yu, Appl. Surf. Sci., 2016, 392, 658–686 CrossRef.
- R. S. Dariani, A. Esmaeili, A. Mortezaali and S. Dehghanpour, Optik, 2016, 18, 7143–7154 CrossRef.
- Alonso-Tellez, D. Robert, V. Keller and N. Keller, Environ. Sci. Pollut. Res., 2014, 5, 3503–3514 CrossRef.
- N. Kazuya and A. Fujishima, J. Photochem. Photobiol., C, 2012, 3, 169–189 Search PubMed.
- X.-J. Lu, X.-L. Mou, J.-J. Wu and D.-W. Zhang, Adv. Funct. Mater., 2010, 3, 509–515 CrossRef.
- S. Ding, X. Yin, X.-J. Lu, Y. Wang and D. Wan, ACS Appl. Mater. Interfaces, 2011, 1, 306–311 Search PubMed.
- R. Ghosh, Y. Hara, L. Alibabaei, K. Hanson, S. Rangan, R. Bartynski, T. J. Meyer and R. Lopez, ACS Appl. Mater. Interfaces, 2012, 9, 4566–4570 CrossRef.
- M. Anpo, Y. Ichihashi, M. Takeuchi and H. Yamashita, Res. Chem. Intermed., 1998, 2, 143–149 CrossRef.
- H. Irie, Y. Watanabe and K. Hashimoto, J. Phys. Chem. B, 2003, 23, 5483–5486 CrossRef.
- Y. Choi, T. Umebayashi and M. Yoshikawa, J. Mater. Sci., 2004, 5, 1837–1839 CrossRef.
- M. Shen, Z. Wu and H. Huang, Mater. Lett., 2006, 5, 693–697 CrossRef.
- R. Asahi, T. Morikawa, T. Ohwaki, K. Aoki and Y. Taga, Science, 2001, 293, 269–271 CrossRef CAS.
- L. Torbjörn, J. M. Mwabora and J. Avendaño, J. Phys. Chem. B, 2007, 24, 5709–5716 Search PubMed.
- L. Jia, C. Wu and Y. Li, Appl. Phys. Lett., 2011, 98, 2815 Search PubMed.
- K.-Z. Qi, B. Cheng, J.-G. Yu and W.-K. Ho, Chin. J. Catal., 2017, 12, 1936–1955 CrossRef.
- L.-Y. Lu, G.-H. Wang and M. Zou, Appl. Surf. Sci., 2018, 441, 1012–1023 CrossRef CAS.
- J. Wang, G.-H. Wang and X. Wang, Carbon, 2019, 149, 618–626 CrossRef CAS.
- X. Chen, L. Liu, P.-Y. Yu and S. S. Mao, Science, 2011, 331, 746–750 CrossRef CAS.
- T. Leshuk, R. Parviz, P. Everett, H. Krishnakumar, R. A. Varin and F. Gu, ACS Appl. Mater. Interfaces, 2013, 5, 1892 CrossRef CAS.
- H. Lu, B. Zhao, R. Pan, J. Yao, J. Qiu, L. Luo and Y. Liu, RSC Adv., 2014, 4, 1128 RSC.
- Z. Lu, C.-T. Yip, L. Wang, H. Huang and L. Zhou, ChemPlusChem, 2012, 77, 991 CrossRef CAS.
- L. Li, Y. Chen, S. Jiao, Z. Fang, X. Liu, Y. Xu, G. Pang and S. Feng, Mater. Des., 2016, 100, 235 CrossRef CAS.
- S. Wei, R. Wu, X. Xu, J. Jian, H. Wang and Y. Sun, Chem. Eng. J., 2016, 299, 120 CrossRef CAS.
- Y. Zhu and D. Liu, Chem. Commun., 2014, 50, 6049 RSC.
- H. Zhang, Z. Xing, Y. Zhang, Z. Li, X. Wu, C. Liu, Q. Zhu and W. Zhou, RSC Adv., 2015, 5, 107150 RSC.
- F. Teng, M. Li, C. Gao, G. Zhang, P. Zhang, Y. Wang and E. Xie, Appl. Catal., B, 2014, 148, 339 CrossRef.
- Q. Kang, J. Cao, Y. Zhang, L. Liu, H. Xu and J. Ye, J. Mater. Chem. A, 2013, 1, 5766 RSC.
- Z. Wang, C.-Y. Yang, T.-Q. Lin, H. Yin, P. Chen, D.-Y. Wan, F.-F. Xu, F.-Q. Huang, J.-H. Lin, X.-M. Xie and M.-H. Jiang, Energy Environ. Sci., 2013, 10, 3007 RSC.
- Ye, J. Jia, Z.-J. Wu, C.-X. Qian, R. Chen, P. G. O. Brien, W. Sun, Y.-C. Dong and G. A. Ozin, Adv. Energy Mater., 2017, 4, 1601811.1–1601811.7 Search PubMed.
- H. Tan, Z. Zhao, M. Niu, C. Mao, D. Cao, D. Cheng, P. Feng and Z. Sun, Nanoscale, 2014, 6, 10216 RSC.
- R. K. Singhal, S. Kumar, P. Kumari, Y. T. Xin and E. Saitovitch, Appl. Phys. Lett., 2011, 9, 092510.1–092510.3 Search PubMed.
- W. Jiao, L. Wang, G. Liu, G.-Q. Lu and H.-M. Cheng, ACS Catal., 2012, 9, 1854–1859 CrossRef.
- Z. Zhang, X. Tan, T. Yu, L. Jia and X. Huang, Int. J. Hydrogen Energy, 2016, 27, 11634–11643 CrossRef.
- Z. Tong, D. Yang, T. Xiao, Y. Tian and Z. Jiang, Chem. Eng. J., 2015, 260, 117–125 CrossRef CAS.
- L.-J. Han, B. Su, G. Liu, Z. Ma and X. An, Mol. Catal., 2018, 456, 96–101 CrossRef CAS.
- Wang, S. Shen and S. S. Mao, J. Materiomics, 2017, 2, 96–111 CrossRef.
- T.-Q. Lin, C.-Y. Yang, Z. Wang, H. Yin, X.-J. Lü, F.-Q. Huang, J.-H. Lin, X.-M. Xie and M.-H. Jiang, Energy Environ. Sci., 2014, 3, 967 RSC.
| This journal is © The Royal Society of Chemistry 2020 |

