
 Open Access Article
 This Open Access Article is licensed under a Creative Commons Attribution-Non Commercial 3.0 Unported Licence
Interactions of sub-five-nanometer diameter colloidal palladium nanoparticles in solution investigated via liquid cell transmission electron microscopy†
Haifeng Wang‡
ab,
Xiaoqin Zhou‡bc,
Yunhui Huang*a,
Xin Chen *c and
Chuanhong Jin*bd
*c and
Chuanhong Jin*bd
aInstitute of New Energy for Vehicles, School of Materials Science and Engineering, Tongji University, Shanghai 201804, China. E-mail: huangyh@tongji.edu.cn
bState Key Laboratory of Silicon Materials, School of Materials Science and Engineering, Zhejiang University, Hangzhou, Zhejiang 310027, China. E-mail: chhjin@zju.edu.cn
cKey Laboratory for Ultrafine Materials of Ministry of Education, Shanghai Key Laboratory of Advanced Polymeric Materials, School of Materials Science and Engineering, East China University of Science and Technology, Shanghai 200237, P. R. China. E-mail: xinchen73@ecust.edu.cn
dHunan Institute of Advanced Sensing and Information Technology, Xiangtan University, Xiangtan, Hunan 411105, China
First published on 21st September 2020
Abstract
Inter-particle interactions play important roles in controlling the structures, dispersion state and chemo-physical properties of colloidal nanoparticles (NPs) in liquid media. In this work, we prepared palladium (Pd) NPs with an average diameter of ∼4.6 nm in situ inside the liquid cell, and investigated their coupled diffusion and aggregation behaviors through liquid cell transmission electron microscopy (LCTEM). Via analyzing the interaction energies and forces, we derived the effective working range for repulsive double layer interaction experimentally, a value larger than two times the Debye length, suggesting a different interaction behavior of sub-5 nm NPs from that of colloidal NPs in larger sizes. Our results provide insights for the interactions between colloidal ultrafine nanoparticles in solution and will also shed light on the precisely controlled assembly of colloidal nanocrystals for practical applications.
1. Introduction
The inter-nanoparticle (inter-NP) interactions play essential roles on governing a vast of fundamental processes such as the growth,1–3 aggregation4,5 and self-assembly6–9 of colloidal NPs in liquid media. To date, remarkable progress has been achieved on revealing the mechanisms of colloidal NP interactions via different characterization tools, such as small-angle X-ray scattering,4 zeta potential measurement,5,10 UV-Vis spectra,1,11 and in situ streaming potential measurements.12–14 Recently, liquid cell transmission electron microscopy (LCTEM), as an emerging technique with the capability of imaging at high spatial–temporal resolution,15,16 has been demonstrated as an effective and feasible platform for investigating the growth,2,3,17 aggregation,18–22 etching,23–25 self-assembly,26–31 electrochemical reaction,32 and bio-application33 of nanosized objects in aqueous solution.It is well known size matters for NPs. When the diameter of noble metal NPs reduces, i.e., to sub 5 nm regime, the electronic structures and chemo-physical properties may alter due to the intriguing size and quantum confinement effects. As a result, these sub-5 nm NPs hold promising applications in catalysis,34–36 optics,37 and sensor devices.38,39 Regarding the inter-particle interactions, scaling down the size of NPs may lead to (i) a weak van der Waals (vdW) interaction,6 as it critically depends on the NP's radius; (ii) the increased ion–NP interaction40–44 and molecule–NP interaction,26,45,46 particularly when size of molecules or ions in solution (typically of a few Ångstrom)47 becomes comparable with that of the NPs; (iii) the nonadditivity of multiple interactions when the inter-NP separation is smaller than a few nanometers,9 where the total interaction energy cannot be simply treated as a sum of contributions of all independent interactions. As a result, the strength, range and contribution (or competition) of different interactions between ultra-fine NPs may substantially change. For instance, Anand et al.46 observed two sub-5 nm Au NPs can form a stable transient dimer before the attachment via LCTEM, and they attributed this finding to the effective force balance between the steric hindrance of water molecules (or surfactant ligands) and the vdW interaction force acting in a short-range (<∼2 nm). Guerrero-García et al.40 investigated the interactions of charged NPs in salt solutions via molecular dynamical simulations, and they confirmed that large counterions of ∼1 nm in solution can increase the short-range repulsive interaction and hence improve the stability of the colloidal NPs with a diameter of ∼5 nm. To date, LCTEM study on the interaction of fine NPs, i.e. <5 nm, still remains limited,26,46,48,49 and the effects of interaction force (or energy) on the resulting NP behaviors need further exploiting.
In this study, we first synthesized sub five nm palladium (Pd) NPs in situ inside the liquid cell via controlling the electron beam dose rate during the radiolysis process, and then investigated the diffusion and assembly behaviors of the as-formed Pd NPs in solution through LCTEM. Via analyzing the aggregation dynamics and calculating the interaction forces and energies acting on the Pd NPs, we unraveled the underlying mechanism for the assembly behaviors, taking the aggregation between an individual Pd NP and a nanocluster as a model. In addition, we also derived out the effective working range of the double layer interaction. Our work provides in-depth insights for the ultrafine NP interactions in liquid.
2. Experimental
2.1 Preparation of precursor solution
All chemical agents including palladium(II) chloride (PdCl2, 99.9%, Sigma-Aldrich) and cetyltrimethylammonium bromide (CTAB, analytical reagent, Sinopharm Chemical Reagent Co., Ltd) were used as received. 39 mg PdCl2 was dissolved into 600 μL 2.88 mol L−1 hydrochloric acid (HCl) as a stock solution of H2PdCl4, and then diluted to 2 mM. The precursor solution (pH = 2.2) was prepared via mixing 300 μL H2PdCl4 solution (2 mM), 100 μL CTAB (1 mM), and 300 μL deionized H2O together, and then stirred the mixture for 5 minutes to ensure sufficient ion exchange prior to its loading into the liquid cell.2.2 Liquid cell TEM
In situ liquid cell TEM experiments were carried out in a static liquid cell system (Hummingbird Scientific Inc.). The central part of the cell contains a pair of micro-fabricated silicon chips decorated with a 50 nm thick SiNx membrane on each. To remove the organic contamination and render the surfaces hydrophilic, the chips were treated with oxygen plasma (20% vol. O2 and 80% vol. N2) for 5 minutes just prior to the loading and sealing of precursor liquid solution (∼400 nL). The whole assembled cell was amounted onto a dedicated holder and then loaded into a transmission electron microscope (TEM, FEI Tecnai G2 F20) for in situ LCTEM studies. This microscope was operated at an acceleration voltage of 200 kV and the employed electron dose rates ranged 240–1000 e− Å−2 s−1. Time sequenced movies were recorded via a screen capture software (Bandicam) at a frame rate of 3 frames per second.3. Results and discussion
As learned from the strategy for conventional synthesis of quantum dots,50,51 the ultrafine Pd NPs were prepared via controlling the nucleation kinetics, that is by tuning the electron dose rates during the e-beam radiolysis induced nucleation and growth. As illustrated in Fig. 1a, an intense electron beam with a high dose rate of ∼1000 e− Å−2 s−1 was used to illuminate the precursor solution for a short period-23 seconds, leading to the occurring of burst nucleation events.52 Then, the dose rate was reduced to 240 e− Å−2 s−1 and kept unchanged from t = 23.0 s to t = 52.0 s, during which the as-formed Pd nuclei started to grow up gradually either by the direct deposition from the precursor solution or through the inter-nuclei aggregation, as shown in Fig. 1b and Movie S1.† During this period, new nucleation events were rarely observed mainly due to the rapid consumption of local precursors and the limited supply from the nearby environment caused by the greatly restricted diffusivity25 of PdCl42− within a confined space inside the liquid cell. Size distribution analysis in Fig. 1c gives an average size of 4.6 ± 0.6 nm for the Pd NPs formed at t = 52.0 s in Fig. 1b. Characterization for the as-formed Pd NPs was shown in Fig. S4.†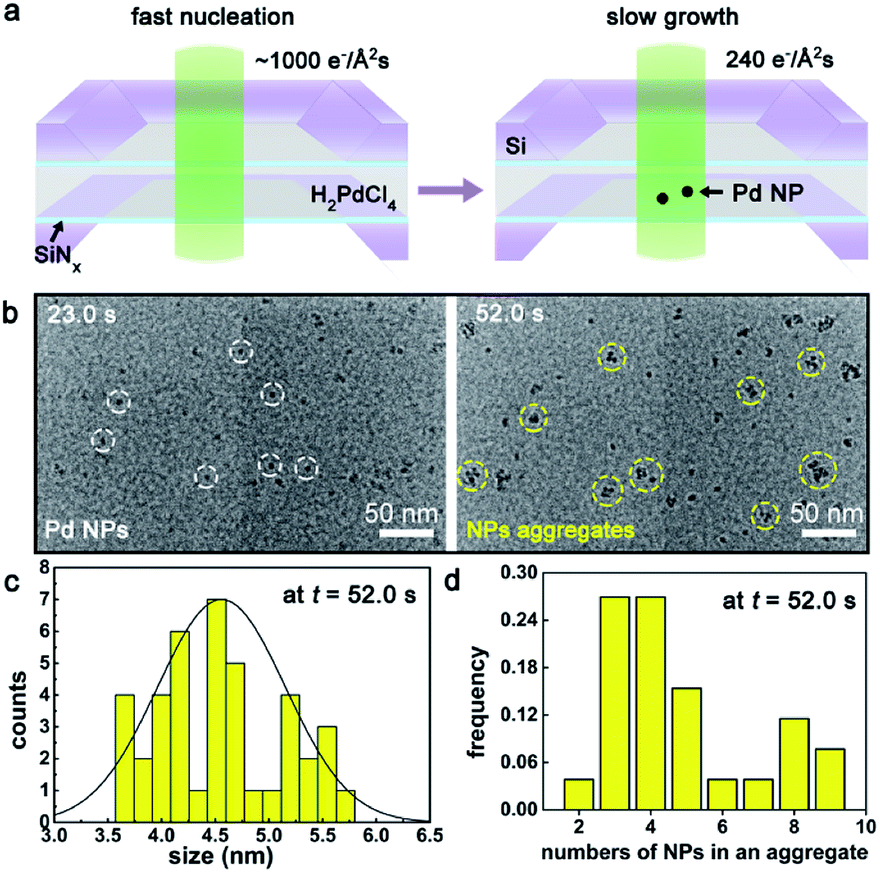 | ||
| Fig. 1 Nucleation, growth and aggregation of Pd NPs as investigated by LCTEM. (a) A schematics illustration showing the in situ synthesis of Pd NPs inside the cell. (b) TEM images illustrating the growth and aggregation of Pd NPs. The electron dose rate was 240 e− Å−2 s−1. The white and yellow dotted circles marked individual Pd NPs and aggregates, respectively. (c) Size distribution of Pd NPs measured from the TEM image (b) at t = 52.0 s. (d) Histogram of numbers of Pd NPs in an aggregate. | ||
Notably, the early stage of the assembly of monomer Pd NPs (t = 0 s to 23 s) was hard to capture, due to the limited resolution of our LCTEM. Therefore, we turned to track the dynamics of the aggregation between an individual Pd NP and a nanocluster, as the stability was remarkably improved after nanocluster formed. An example was shown in Fig. 2a and Movie S2,† where the interaction between an individual Pd NP and a Pd dimer (containing two Pd NPs) was investigated. Beginning form t = 36.3 s, the dimer (blue arrowed) and NP (yellow arrowed) gradually approached toward each other, and then the NP suddenly jumped toward the dimer at t = 41.3 s when the inter-NP distance L = 10.5 nm, and a slight rotation was observed on the dimer. After the aggregation of the NP onto the dimer, the NP can still move around the surface of the dimer, leading to the structural transformation.
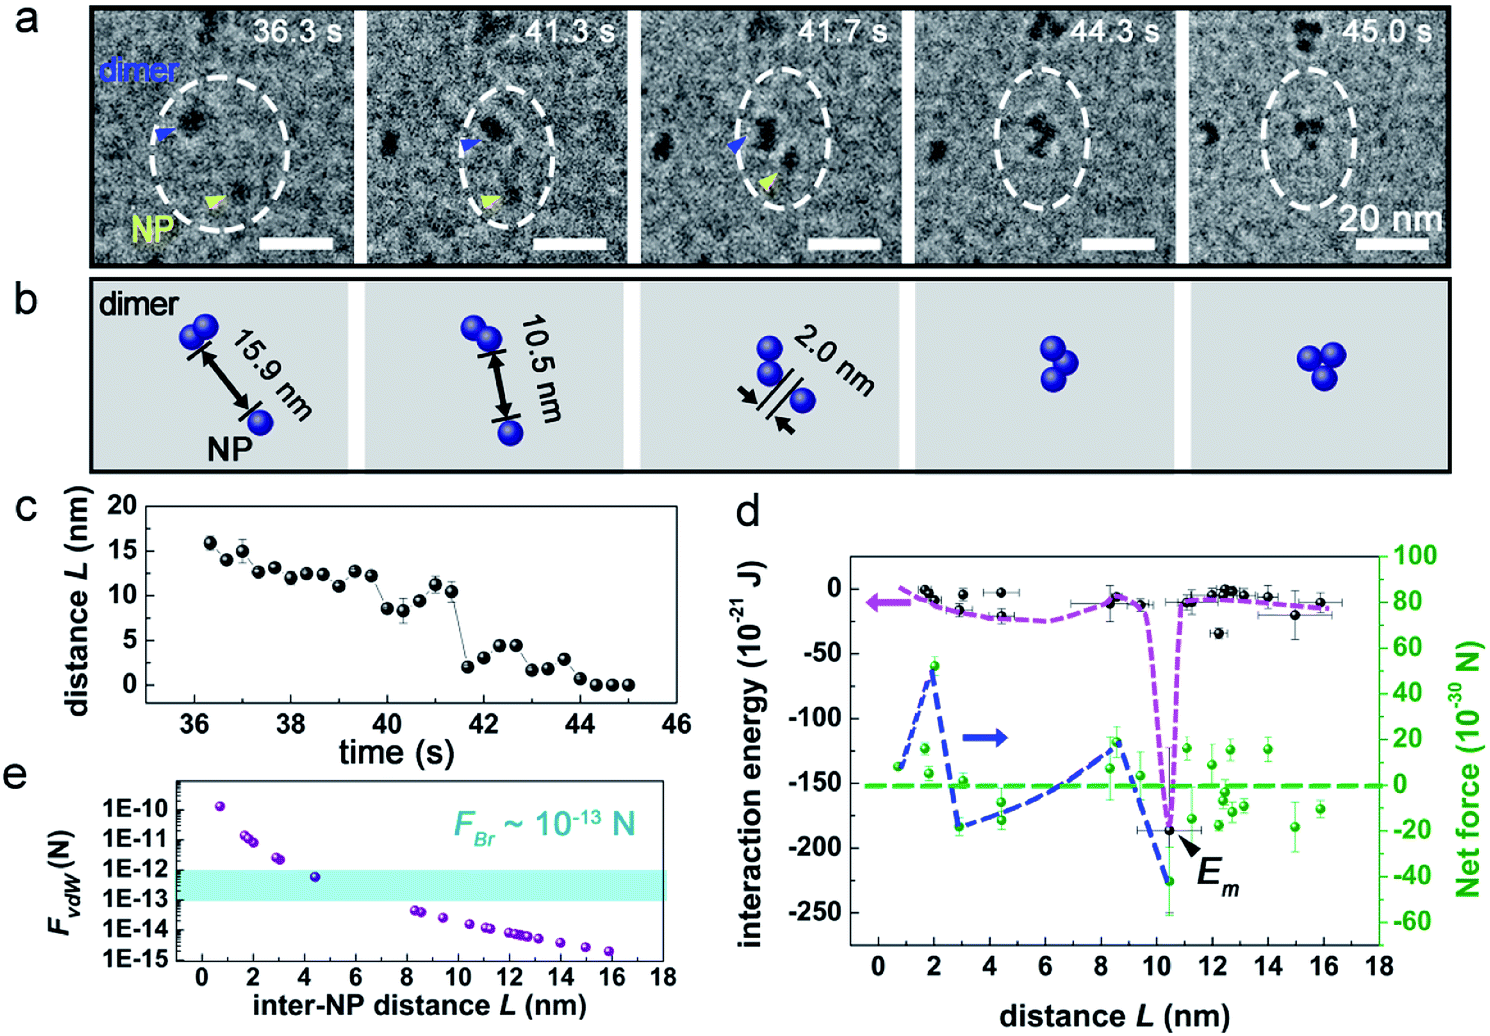 | ||
| Fig. 2 The interaction dynamics between a Pd dimer nanocluster and an individual Pd NP. (a) Time sequenced TEM images and (b) corresponding schematics of the interaction process. Electron dose rate: 240 e− Å−2 s−1. Blue and yellow arrows point to the dimer and the Pd NP, respectively. (c) The plots of the inter-NP distance (L) vs. time. (d) The change of interaction energy (E) and net force (Fnet) with L. Em represents the minimum point of E, and the blue and pink dotted lines are the trend lines of Fnet and E for eye-guiding, respectively. (e) The variation of FvdW (purple dots) and FBr (blue area) with L. | ||
To reveal the underlying mechanism of the aggregation, we derived and analyzed the interaction energy (E) of the NP following the method proposed by Li et al.2 The interaction energy can be written as
and omitted the contribution related to rotational motion Erot
based on two considerations: first, the contribution of Erot is negligible when Δθ < 28° (Section 2 and Fig. S2 in ESI†); second, it is hard to measure rotational motion of such a sub-5 nm sphere-liked Pd NP. The derived energy was plotted in Fig. 2d. As seen, a minimum of E, namely Em = −1.9 × 10⁻¹⁹ J occurred at L = 10.5 nm, which should correspond to the driving energy for the jump motion of the NP (t = 41.3 s in Fig. 2a). At 3.0 nm < L < 8.6 nm, an energy “valley” existed, indicating the development of an attractive interaction. The associated energy different between Em and the energy “valley” practically acted as an energy barrier, suggesting repulsive interaction force worked at 8.6 nm < L < 10.5 nm. This result was also supported by the finding that the corresponding Fnet increased from negative to positive (Fig. 2d; Fnet > 0 means a net repulsive force, while Fnet < 0 means attractive). It should be noted that the limited statistics in Fig. 2d may influence the landscape of interaction energy, e.g. the depth and width of energy “valley”, and possibly introduces considerable errors into the calculation.
Besides jump-to-approach pathway shown in Fig. 2a and S3,† the aggregation sometimes can be accomplished in a more complex one, as shown in Fig. 3a and Movie S3.† In this case, an individual NP firstly attached to a pentamer nanocluster (made of five Pd NPs) via two discrete jump motions occurred at L = 28.0 and 13.3 nm (stage I in Fig. 3c), respectively. The Pd NP detached after the aggregation and underwent oscillated motions (stage II) prior to its second approach (stage III). The evolution of E and Fnet in this aggregation event (Fig. 3d) were similar to those observed in the previous case (Fig. 2d), except for an additional energy barrier at 13.3 nm < L < 28.0 nm, which was likely generated by the solution fluctuation, due to the corresponding Fnet < 0 mainly, i.e., the net force of NP was attractive.
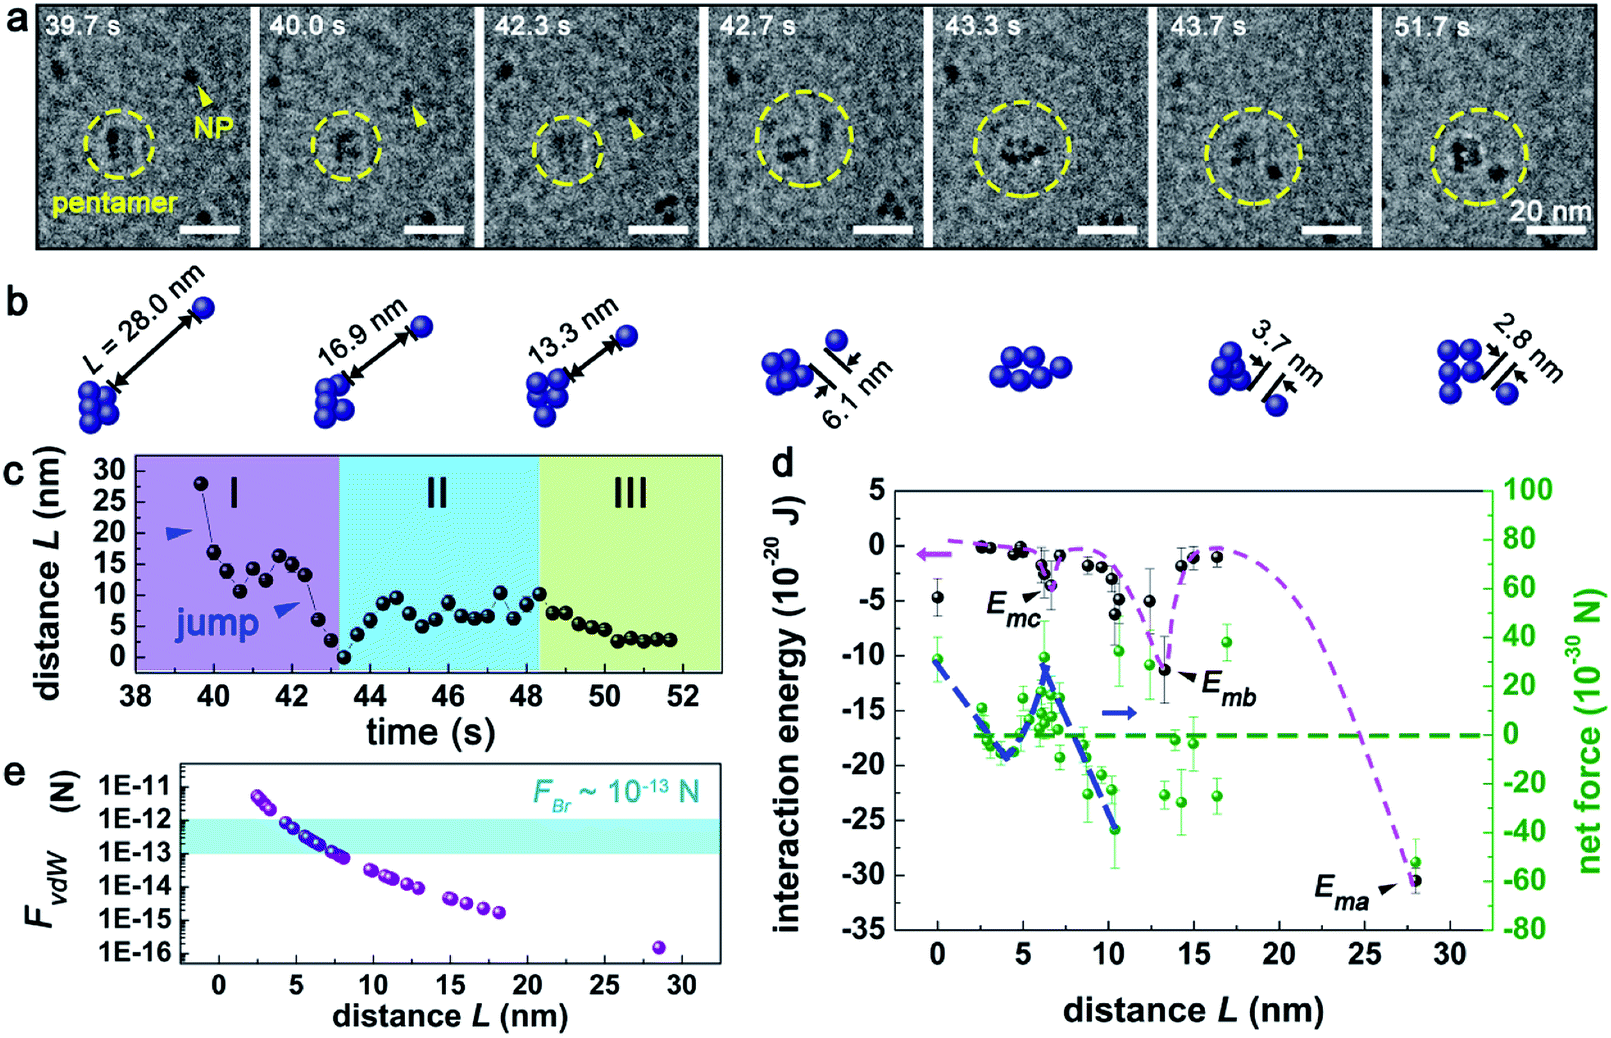 | ||
| Fig. 3 The interaction dynamics between a Pd pentamer nanocluster and an individual NP. (a) Time sequenced in situ LCTEM images and (b) the corresponding schematics of the interaction process. Electron dose rate: 240 e− Å−2 s−1. Note that, the pentamer nanocluster sometimes may appeared as a tetramer nanocluster due to the overlap of NPs. (c) Plots of inter-NP distances (L) vs. time (t). (d) The derived interaction energy (E) and net force (Fnet) acting on the NP. The pink and blue dashed lines represent the trend lines of E and Fnet for eye-guiding, respectively. Ema, Emb, Emc denote three minima of E, respectively. (e) The variation of FvdW (purple dots) and FBr (blue area) with L. | ||
In principle, Brownian motion and vdW interaction can both provide attractive force to drive the approach motion of Pd NPs in solution. As shown in Fig. 2e (and Fig. 3e), as the inter-NP distance L decreases, vdW interaction force (FvdW) gradually increases and then becomes comparable with Brownian motion force (FBr) at L = 6.9 nm (7.5 nm for Fig. 3e), and hence FvdW should serve as the primary driving force for the NP aggregation at short inter-NP separations. The energy barriers (such as the curves for 8.6 nm < L < 10.5 nm in Fig. 2d and 6.2 nm < L < 10.4 nm in Fig. 3d) that hindered the NPs approaching should mainly originate from (i) the double layer interaction force between NPs and (ii) the steric hindrance force between CTA+ ligands.6,18,53,54 Of them, the effective range of the hindrance force is usually smaller than two times the length of CTA+, i.e., L < 2 nm × 2 = 4 nm,6,46 while the working range for the double layer interaction depends on the ionic strength of solution, a paramater reflecting the solution property, which will be discussed later. Via comparing the effective ranges of energy barries derived experimentally with that of the steric hindrance force (8.6 nm < L < 10.5 nm or 6.2 nm < L < 10.4 nm vs. 4 nm), we can infer that the energy barrier should be mainly attributed to the double layer interaction. Under such an approximation, the upper value of the range of L, denoted as Lc,exp can be assigned as 10.5 nm from Fig. 2d and 10.4 nm from Fig. 3d, respectively. And this Lc,exp can be approximately treated as the effective distance where the double layer interaction started to work. Interaction between SiNx membrane and two individual NPs in Fig. 2a and 3a is expected to play minor roles on the aggregation, due to the following two considerations: (i) the NPs kept mobile with a velocity of 0.1–33.2 nm s−1 during the whole process (as shown more clearly in Movies S2 and S3†), suggesting a loose bounding of these NPs to the SiNx membrane, and (ii) as reported previously,17 the NP-membrane friction force is rather small.
It is well known that within the classical Derjaguin–Landau–Verwey–Overbeek (DLVO) theory,5,55 the analysis of double layer interaction is based on the Poisson–Boltzmann equation, where ions in the solution are assumed as point-like ions without any volume.9,40,56 However in our system, this approximation may not be valid any more since the diameter of ions can reach ∼0.4 nm (ref. 47) for Cl− and Br−, and ∼2 nm for CTA+, which cannot be ignored in comparison with that of the NPs (4.6 nm). To check the validity of this assumption and figure out if there exists any specific size dependence for the double layer interaction of such sub-5 nm NPs, we compared the effective range of double layer interaction with that predicted by the DLVO theory. Within the framework of DLVO theory, ions in solution distribute surrounding the NP to balance the surface charges (Fig. 4a), leading to the formation of a double layer with a thickness called Debye length57 and written as 1/κ, where
is the total ionic strength of the solution containing n types of ions with a valence qi and a concentration ci for each ion. The double layer repelling force arises when two double layers start to overlap with a critical distance Lc,DLVO = 2/κ, as illustrated in Fig. 4a.
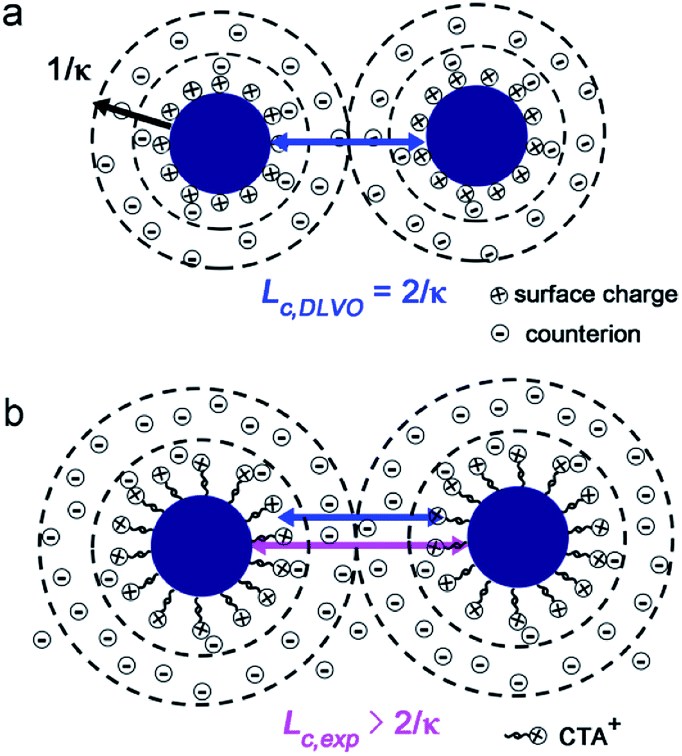 | ||
| Fig. 4 (a) Schematic showing the two double layers start to overlap with a critical length Lc,DLVO = 2/κ in the DLVO theory. (b) Schematic illustrating the double layer surrounding the CTA+ layers coated Pd NPs. The length of blue and pink arrows represent Lc,DLVO = 2/κ and Lc,exp, respectively. | ||
Before we calculate the range of double layer interaction (Lc,DLVO = 2/κ) following the DLVO theory, we address that the electron beam induced change of solution characteristics such as pH and the concentrations of PdCl42− and Cl− should also be taken into account.52 Note that, other electron beam induced effects such as the radiolysis reactions in the presence of Br− (from CTAB) and the charge re-distribution58,59 on the CTA+–NPs were not considered. As predicted by Schneider et al.,52 the concentration of H+ in solution under e-beam irradiation was almost unchanged when initial pH < 3, and thus we treated the initial solution pH = 2.2 as a steady state. During this process, part of Cl− ions will also be transformed into hydrochloride ion (ClOH˙−) and chlorine radical ion (Cl2˙−, Table S3 in ESI†),60,61 which may induce an increase ≤ 20% on the derived value of 2/κ, as explained in details in Section 4 in the ESI.† Since ClOH˙− and Cl2˙− ions possess the same ion valence q = −1 with Cl−, we can treat them (ClOH˙−, Cl2˙− and Cl−) as a whole, and further assume their total concentration equals to the initial concentration of Cl− in solution during the calculation of ionic strength and 2/κ. The concentration of PdCl42− during Pd NPs aggregation was hard to measure due to the gradual consumption of PdCl42− by hydrated electrons for further growth of Pd NPs. Thus, to calculate 2/κ and Lc,DLVO, we hypothesized two limiting conditions: the reduction ratio of PdCl42− was (a) zero and (b) 100%, respectively (more details are in the Section 4 and Table S2 in ESI†). As listed in Table 1, 2/κ = 7.2 nm, indicating the double layer interaction develops at L < Lc,DLVO = 7.2 nm within the DLVO theory. This value was somehow smaller than our experiment results of Lc,exp = 10.5 nm and 10.4 nm, as revealed by the L-dependent variation of E and Fnet in Fig. 2d and 3d, respectively, indicating the effective range of double layer interaction between sub-5 nm Pd NPs was larger than that of the DLVO theory, and the validity of approximation of the point-like ions was questionable for sub-5 nm NPs. The CTA+ ligands coated on NPs may extend the “charged surface” of NPs and make Lc,exp > Lc,DLVO, as illustrated in Fig. 4b. Besides, fluctuation of ion distribution around NPs also possibly increased Lc,exp.
| pH | Reduction ratio/% | Ionic strength I/mM | 2/κ/nm |
|---|---|---|---|
| 2.2 | 0 | 7.2 | 7.2 |
| 100 | 7.2 |
4. Conclusions
In summary, we synthesized ultrafine Pd NPs with an average size of 4.6 ± 0.6 nm inside the liquid cell through tuning electron dose rate, and then investigated the self-aggregation processes between individual Pd NPs and nanoclusters via LCTEM. After the attachment, NPs sometimes may diffuse on the aggregation, or detach from the aggregation and then undergo oscillated movement. We also mapped out the effective working range of the double layer interaction, and found it was larger than two times of the Debye length given by the classical DLVO theory. Our findings may offer understanding of the interaction and self-assembly mechanisms of ultrafine NPs in solution.Conflicts of interest
There are no conflicts to declare.Acknowledgements
We acknowledged Prof. Hui Zhang, Ruikang Tang, Dr Biao Jin and Xiaoming Ma for their fruitful discussions and suggestions. This work was financially supported by the National Natural Science Foundation of China under Grant No. 51772265, 51761165024, and 61721005; the Zhejiang Provincial Natural Science Foundation under Grant No. D19E020002, the 111 Project under Grant B16042, the Shanghai Leading Academic Discipline Project No. B502, and the Shanghai Key Laboratory Project No. 08DZ2230500. The work on electron microscopy was done at the Center of Electron Microscopy of Zhejiang University.Notes and references
- H. Zhang and D. Wang, Controlling the growth of charged-nanoparticle chains through interparticle electrostatic repulsion, Angew. Chem., Int. Ed., 2008, 47, 3984–3987 CrossRef CAS.
- D. Li, M. H. Nielsen, J. R. Lee, C. Frandsen, J. F. Banfield and J. J. De Yoreo, Direction-specific interactions control crystal growth by oriented attachment, Science, 2012, 336, 1014–1018 CrossRef CAS.
- H. G. Liao, L. Cui, S. Whitelam and H. Zheng, Real-time imaging of Pt3Fe nanorod growth in solution, Science, 2012, 336, 1011–1014 CrossRef CAS.
- H. Mattoussi, A. W. Cumming, C. B. Murray, M. G. Bawendi and R. Ober, Properties of CdSe nanocrystal dispersions in the dilute regime: structure and interparticle interactions, Phys. Rev. B: Condens. Matter Mater. Phys., 1998, 58, 7850–7863 CrossRef CAS.
- T. Kim, K. Lee, M. S. Gong and S. W. Joo, Control of gold nanoparticle aggregates by manipulation of interparticle interaction, Langmuir, 2005, 21, 9524–9528 CrossRef CAS.
- K. J. M. Bishop, C. E. Wilmer, S. Soh and B. A. Grzybowski, Nanoscale forces and their uses in self-assembly, Small, 2009, 5, 1600–1630 CrossRef CAS.
- M. A. Boles, M. Engel and D. V. Talapin, Self-assembly of colloidal nanocrystals: from intricate structures to functional materials, Chem. Rev., 2016, 116, 11220–11289 CrossRef CAS.
- N. Vogel, M. Retsch, C. A. Fustin, A. del Campo and U. Jonas, Advances in colloidal assembly: the design of structure and hierarchy in two and three dimensions, Chem. Rev., 2015, 115, 6265–6311 CrossRef CAS.
- C. A. S. Batista, R. G. Larson and N. A. Kotov, Nonadditivity of nanoparticle interactions, Science, 2015, 350, 1242477 CrossRef.
- M. Noh, T. Kim, H. Lee, C. K. Kim, S. W. Joo and K. Lee, Fluorescence quenching caused by aggregation of water-soluble CdSe quantum dots, Colloids Surf., A, 2010, 359, 39–44 CrossRef CAS.
- Z. Sun, W. Ni, Z. Yang, X. Kou, L. Li and J. Wang, pH-controlled reversible assembly and disassembly of gold nanorods, Small, 2008, 4, 1287–1292 CrossRef CAS.
- M. Morga, Z. Adamczyk, M. Oćwieja and E. Bielańska, Hematite/silver nanoparticle bilayers on mica – AFM, SEM and streaming potential studies, J. Colloid Interface Sci., 2014, 424, 75–83 CrossRef CAS.
- M. Morga, Z. Adamczyk and D. Kosior, Silica monolayer formation and stability determined by in situ streaming potential measurements, Electrochim. Acta, 2016, 206, 409–418 CrossRef CAS.
- M. Morga, Z. Adamczyk, D. Kosior and M. Oćwieja, Hematite/silica nanoparticle bilayers on mica: AFM and electrokinetic characterization, Phys. Chem. Chem. Phys., 2018, 20, 15368–15379 RSC.
- J. E. Evans, K. L. Jungjohann, N. D. Browning and I. Arslan, Controlled growth of nanoparticles from solution with in situ liquid transmission electron microscopy, Nano Lett., 2011, 11, 2809–2813 CrossRef CAS.
- H. G. Liao, D. Zherebetskyy, H. Xin, C. Czarnik, P. Ercius, H. Elmlund, M. Pan, L. W. Wang and H. Zheng, Facet development during platinum nanocube growth, Science, 2014, 345, 916–919 CrossRef CAS.
- D. Xiao, Z. Wu, M. Song, J. Chun, G. K. Schenter and D. Li, Silver nanocube and nanobar growth via anisotropic monomer addition and particle attachment processes, Langmuir, 2018, 34, 1466–1472 CrossRef CAS.
- B. Luo, J. W. Smith, Z. Ou and Q. Chen, Quantifying the self-assembly behavior of anisotropic nanoparticles using liquid-phase transmission electron microscopy, Acc. Chem. Res., 2017, 50, 1125–1133 CrossRef CAS.
- J. Kim, Z. Ou, M. R. Jones, X. Song and Q. Chen, Imaging the polymerization of multivalent nanoparticles in solution, Nat. Commun., 2017, 8, 761 CrossRef.
- Q. Chen, H. Cho, K. Manthiram, M. Yoshida, X. Ye and A. P. Alivisatos, Interaction potentials of anisotropic nanocrystals from the trajectory sampling of particle motion using in situ liquid phase transmission electron microscopy, ACS Cent. Sci., 2015, 1, 33–39 CrossRef CAS.
- J. Liu, Z. Wang, A. Sheng, F. Liu, F. Qin and Z. L. Wang, In situ observation of hematite nanoparticle aggregates by using liquid cell transmission electron microscopy, Environ. Sci. Technol., 2016, 50, 5606–5613 CrossRef CAS.
- B. Jin, M. L. Sushko, Z. Liu, C. Jin and R. Tang, In situ liquid cell TEM reveals bridge-induced contact and fusion of Au nanocrystals in aqueous solution, Nano Lett., 2018, 18, 6551–6556 CrossRef CAS.
- X. Ye, M. R. Jones, L. B. Frechette, Q. Chen, A. S. Powers, P. Ercius, G. Dunn, G. M. Rotskoff, S. C. Nguyen, V. P. Adiga, A. Zettl, E. Rabani, P. L. Geissler and A. P. Alivisatos, Single-particle mapping of nonequilibrium nanocrystal transformations, Science, 2016, 354, 874–877 CrossRef CAS.
- Y. Jiang, G. Zhu, G. Dong, F. Lin, H. Zhang, J. Yuan, Z. Zhang and C. Jin, Probing the oxidative etching induced dissolution of palladium nanocrystals in solution by liquid cell transmission electron microscopy, Micron, 2017, 97, 22–28 CrossRef CAS.
- Y. Jiang, G. Zhu, F. Lin, H. Zhang, C. Jin, J. Yuan, D. Yang and Z. Zhang, In situ study of oxidative etching of palladium nanocrystals by liquid cell electron microscopy, Nano Lett., 2014, 14, 3761–3765 CrossRef CAS.
- J. Lee, E. Nakouzi, D. Xiao, Z. Wu, M. Song, C. Ophus, J. Chun and D. Li, Interplay between short- and long-ranged forces leading to the formation of Ag nanoparticle superlattice, Small, 2019, 15, 1901966 CrossRef.
- S. F. Tan, S. Raj, G. Bisht, H. V. Annadata, C. A. Nijhuis, P. Král and U. Mirsaidov, Nanoparticle interactions guided by shape-dependent hydrophobic forces, Adv. Mater., 2018, 30, 1707077 CrossRef.
- G. Lin, S. W. Chee, S. Raj, P. Král and U. Mirsaidov, Linker-mediated self-assembly dynamics of charged nanoparticles, ACS Nano, 2016, 10, 7443–7450 CrossRef CAS.
- T. J. Woehl and T. Prozorov, The mechanisms for nanoparticle surface diffusion and chain self-assembly determined from real-time nanoscale kinetics in liquid, J. Phys. Chem. C, 2015, 119, 21261–21269 CrossRef CAS.
- E. Sutter, P. Sutter, A. V. Tkachenko, R. Krahne, J. de Graaf, M. Arciniegas and L. Manna, In situ microscopy of the self-assembly of branched nanocrystals in solution, Nat. Commun., 2016, 7, 11213 CrossRef CAS.
- A. S. Powers, H. G. Liao, S. N. Raja, N. D. Bronstein, A. P. Alivisatos and H. Zheng, Tracking nanoparticle diffusion and interaction during self-assembly in a liquid cell, Nano Lett., 2017, 17, 15–20 CrossRef CAS.
- Z. Zeng, W. I. Liang, Y. H. Chu and H. Zheng, In situ TEM study of the Li–Au reaction in an electrochemical liquid cell, Faraday Discuss., 2014, 176, 95–107 RSC.
- N. De Jonge, Membrane protein stoichiometry studied in intact mammalian cells using liquid-phase electron microscopy, J. Microsc., 2017, 269, 134–142 CrossRef.
- X. Chen, G. Wu, J. Chen, X. Chen, Z. Xie and X. Wang, Synthesis of “clean” and well-dispersive Pd nanoparticles with excellent electrocatalytic property on graphene oxide, J. Am. Chem. Soc., 2011, 133, 3693–3695 CrossRef CAS.
- M. Zheng, P. Li, G. Fu, Y. Chen, Y. Zhou, Y. Tang and T. Lu, Efficient anchorage of highly dispersed and ultrafine palladium nanoparticles on the water-soluble phosphonate functionalized multiwall carbon nanotubes, Appl. Catal., B, 2013, 129, 394–402 CrossRef CAS.
- L. Li, H. Zhao and R. Wang, Tailorable synthesis of porous organic polymers decorating ultrafine palladium nanoparticles for hydrogenation of olefins, ACS Catal., 2015, 5, 948–955 CrossRef CAS.
- J. Zheng, C. Zhang and R. M. Dickson, Highly fluorescent, water-soluble, size-tunable gold quantum dots, Phys. Rev. Lett., 2004, 93, 077402 CrossRef.
- X. M. Chen, Z. X. Cai, Z. Y. Huang, M. Oyama, Y. Q. Jiang and X. Chen, Ultrafine palladium nanoparticles grown on graphene nanosheets for enhanced electrochemical sensing of hydrogen peroxide, Electrochim. Acta, 2013, 97, 398–403 CrossRef CAS.
- Y. Sun and H. H. Wang, High-performance, flexible hydrogen sensors that use carbon nanotubes decorated with palladium nanoparticles, Adv. Mater., 2007, 19, 2818–2823 CrossRef CAS.
- G. I. Guerrero-García, P. González-Mozuelos and M. Olvera de la Cruz, Large counterions boost the solubility and renormalized charge of suspended nanoparticles, ACS Nano, 2013, 7, 9714–9723 CrossRef.
- V. Merk, C. Rehbock, F. Becker, U. Hagemann, H. Nienhaus and S. Barcikowski, In situ non-DLVO stabilization of surfactant-free, plasmonic gold nanoparticles: effect of Hofmeister's anions, Langmuir, 2014, 30, 4213–4222 CrossRef CAS.
- T. Laaksonen, P. Ahonen, C. Johans and K. Kontturi, Stability and electrostatics of mercaptoundecanoic acid-capped gold nanoparticles with varying counterion size, ChemPhysChem, 2006, 7, 2143–2149 CrossRef CAS.
- R. Kjellander and S. Marcelja, Double-layer interaction in the primitive model and the corresponding Poisson–Boltzmann description, J. Phys. Chem., 1986, 90, 1230–1232 CrossRef CAS.
- H. Mattoussi, A. W. Cumming, C. B. Murray, M. G. Bawendi and R. Ober, Characterization of CdSe nanocrystallite dispersions by small angle X-ray scattering, J. Chem. Phys., 1996, 105, 9890–9896 CrossRef CAS.
- Z. Wu, C. Dong, Y. Li, H. Hao, H. Zhang, Z. Lu and B. Yang, Self-assembly of Au15 into single-cluster-thick sheets at the interface of two miscible high-boiling solvents, Angew. Chem., Int. Ed., 2013, 52, 9952–9955 CrossRef CAS.
- U. Anand, J. Lu, D. Loh, Z. Aabdin and U. Mirsaidov, Hydration layer-mediated pairwise interaction of nanoparticles, Nano Lett., 2016, 16, 786–790 CrossRef CAS.
- Y. Marcus, Ionic radii in aqueous solutions, Chem. Rev., 1988, 88, 1475–1498 CrossRef CAS.
- J. Lee, E. Nakouzi, M. Song, B. Wang, J. Chun and D. Li, Mechanistic understanding of the growth kinetics and dynamics of nanoparticle superlattices by coupling interparticle forces from real-time measurements, ACS Nano, 2018, 12, 127778–112787 Search PubMed.
- C. Zhu, S. Liang, E. Song, Y. Zhou, W. Wang, F. Shan, Y. Shi, C. Hao, K. Yin, T. Zhang, J. Liu, H. Zheng and L. Sun, In situ liquid cell transmission electron microscopy investigation on oriented attachment of gold nanoparticles, Nat. Commun., 2018, 9, 421 CrossRef.
- C. B. Murray, D. J. Norris and M. G. Bawendi, Synthesis and characterization of nearly monodisperse CdE (E = sulfur, selenium, tellurium) semiconductor nanocrystallites, J. Am. Chem. Soc., 1993, 115, 8706–8715 CrossRef CAS.
- V. K. LaMer and R. H. Dinegar, Theory, production and mechanism of formation of monodispersed hydrosols, J. Am. Chem. Soc., 1950, 72, 4847–4854 CrossRef CAS.
- N. M. Schneider, M. M. Norton, B. J. Mendel, J. M. Grogan, F. M. Ross and H. H. Bau, Electron–water interactions and implications for liquid cell electron microscopy, J. Phys. Chem. C, 2014, 118, 22373–22382 CrossRef CAS.
- Z. Wu, Q. Yao, S. Zang and J. Xie, Directed self-assembly of ultrasmall metal nanoclusters, ACS Mater. Lett., 2019, 1, 237–248 CrossRef CAS.
- Y. Min, M. Akbulut, K. Kristiansen, Y. Golan and J. Israelachvili, The role of interparticle and external forces in nanoparticle assembly, Nat. Mater., 2008, 7, 527–538 CrossRef CAS.
- J. N. Israelachvili, Intermolecular and surface forces, Academic Press, Boston, 3rd edn, 2011 Search PubMed.
- R. Kjellander and D. J. Mitchell, Dressed-ion theory for electrolyte solutions: a Debye–Hückel-like reformulation of the exact theory for the primitive model, J. Chem. Phys., 1994, 101, 603–626 CrossRef CAS.
- M. Hermansson, The DLVO theory in microbial adhesion, Colloids Surf., B, 1999, 14, 105–119 CrossRef CAS.
- Y. Z. Liu, X. M. Lin, Y. G. Sun and T. Rajh, In situ visualization of self-assembly of charged gold nanoparticles, J. Am. Chem. Soc., 2013, 135, 3764–3767 CrossRef CAS.
- S. W. Chee, U. Anand, G. Bisht, S. F. Tan and U. Mirsaidov, Direct observations of the rotation and translation of anisotropic nanoparticles adsorbed at a liquid–solid interface, Nano Lett., 2019, 19, 2871–2878 CrossRef CAS.
- G. G. Jayson, B. J. Parsons and A. J. Swallow, Some simple, highly reactive, inorganic chlorine derivatives in aqueous solution. Their formation using pulses of radiation and their role in the mechanism of the Fricke dosimeter, J. Chem. Soc., Faraday Trans. 1, 1973, 69, 1597–1607 RSC.
- E. Atinault, V. De Waele, U. Schmidhammer, M. Fattahi and M. Mostafavi, Scavenging of es− and OH radicals in concentrated HCl and NaCl aqueous solutions, Chem. Phys. Lett., 2008, 460, 461–465 CrossRef CAS.
Footnotes |
| † Electronic supplementary information (ESI) available. See DOI: 10.1039/d0ra05759b |
| ‡ These authors contributed equally to this work. |
| This journal is © The Royal Society of Chemistry 2020 |