 Open Access Article
Rapid evaluation of oxygen vacancies-enhanced photogeneration of the superoxide radical in nano-TiO2 suspensions†
Wanchao Yuab,
Fengjie Chenab,
Yarui Wangab and
Lixia Zhao *ac
*ac
aState Key Laboratory of Environmental Chemistry and Eco-toxicology, Research Center for Eco-Environmental Sciences, Chinese Academy of Sciences, 18 Shuangqing Road, P.O. Box 2871, Beijing 100085, China. E-mail: zlx@rcees.ac.cn; Fax: +86-10-62849685; Tel: +86-10-62849338
bUniversity of Chinese Academy of Sciences, Beijing 100039, China
cInstitute of Environment and Health, Hangzhou Institute for Advanced Study, UCAS, China
First published on 5th August 2020
Abstract
Reactive oxygen species (ROS) play an important role in the photocatalytic degradation of pollutants and are closely related to the surface defects of a semiconductor. However, the characterization of surface defects is very complex and a deeper understanding of them remains a great challenge. In this work, a series of nano-TiO2 was synthesized and their optical properties due to surface defects were studied. The results showed that the surface oxygen vacancies on nano-TiO2 can induce chemiluminescence (CL) by luminol. The greater the number of surface oxygen vacancies, the stronger the luminescence signal, and the greater the production of reactive oxygen species. Further studies revealed that the CL intensity was positively correlated with the oxygen vacancy content on the surface of nano-TiO2. Moreover, there was also a clear correlation between the oxygen vacancies and photogenerated superoxide radicals (O2˙−) on nano-TiO2 suspensions. Therefore, a simple and rapid CL method was developed for evaluating the oxygen vacancy content and their implied ability to photogenerate O2˙− on nano-TiO2 and has great potential in distinguishing surface oxygen vacancies and judging photocatalytic performance in oxides.
Introduction
Since the pioneering work of Fujishima and Honda on the photo-assisted splitting of water over nano-TiO2, a surge in interest and development has occurred in the applications of nano-TiO2,1–3 of which nano-TiO2 has become an important photocatalytic material,4–6 and it has attracted extensive research interest in environmental remediation and degradation of low concentrations of toxic substances.4,7–10 According to previous reports, the nano-TiO2 photocatalytic activity was mainly regulated by surface defects.11–15 Among the various defects in nano-TiO2, oxygen vacancies are among the most important defects and are considered to be common defects in many metal oxides.16 Important achievements have been made through the introduction and regulation of oxygen vacancies to improve the activity of photocatalysts, especially the visible light catalytic activity, as one of the current photocatalysis research hotspots.12,15–19 Theoretical calculations and experiments have shown that the formation of oxygen vacancies in oxides can form unpaired electrons or Ti3+, which lead to the formation of donor energy levels in the electron structure. The formation of oxygen vacancies lead to a vacancy in the position of the original oxygen atom, which in turn affects the rearrangement of the surrounding atoms.20–22 In addition, a donor level formed between the valence band and the conduction band has the visible light absorption characteristics.12 Simultaneously, the oxygen vacancies also affected the separation and migration of photogenerated electron–hole pairs and impacted the reactive oxygen species (ROS) generation as well as their photocatalytic activity.15 Therefore, it was very important to evaluate the content of oxygen vacancies to regulate the surface properties of photocatalysts.On the other hand, it was reported that the surface defects of the semiconductor play an indispensable role, assisting the charge separation and generating the ROS.1,11–16,21,23–25 Moreover, evidences show that O2 may not be adsorbed unless there was an aerobic vacancy on the surface and the O2 molecule absorbed to the vacancy defect position through the interactions with the surface Ti3+ site.1,14,20–23,25,26 The photocatalytic process began with the generation of electron–hole pairs, and photoelectrons were captured by molecular oxygen to produce superoxide free radicals, avoiding the accumulation of electron–hole composites and negative charges on the surface.1,20–22,26–28 Thus, the nano-TiO2 surface oxygen defect sites were the center of photocatalytic activity. However, oxygen vacancies are elusive species, and are also often highly diluted and therefore difficult to detect.27,29 The presence of oxygen vacancies can be demonstrated by changing the spectral response (e.g., the Raman spectrum) as a function of the number of oxygen vacancies in the sample,30–34 or by several complex techniques such as X-ray photoelectron spectroscopy (XPS),27,35 electron spin resonance (ESR),22 and high-resolution transmission electron microscopy (HRTEM).20,26,30 Density functional theory (DFT) calculations have also been carried out to detect oxygen vacancies. These methods require professionals to manipulate these complex devices to improve the identification of surface oxygen vacancies,27 which greatly limits the simplicity and rapidity of detecting oxygen vacancies.
Chemiluminescence has received considerable attention as it can offer unique insights regarding the surface properties and photo-generated ROS in photocatalytic reactions.36,37 For example, Wang et al. developed a continuous flow chemiluminescence (CFCL) system for the selective, sensitive, and online detection of photo-generated ROS on nano-TiO2.37 Tachikawa et al. described a strategy for investigating the surface properties of nano-TiO2 using single-particle chemiluminescence (CL) imaging.36 For surface defect studies, to the best of our knowledge, only Lu et al. developed a cataluminescence method for the investigation of the surface oxygen vacancies in different metal-doped nano-TiO2. This suggested that abundant oxygen vacancy sites on the surface of TiO2 nanoparticles can adsorb O2, promoting the contact reaction between the activated superoxide species and the adsorbed diethyl ether molecules to generate the CL signal.27 However, CTL occurred in gas-phase conditions, which do not reflect the surface properties of nano-TiO2 suspensions used for water treatment. Besides, the relationship between the oxygen vacancy content of metal-oxides and their photo-generated ROS and photocatalytic activity has not been explicated.
In this work, it was found that nano-TiO2 suspensions with surface defects can produce chemiluminescence induced by luminol probes using continuous flow chemiluminescence (CFCL) in dark conditions. With the increase in the content of oxygen defects on different heat-treated nano-TiO2, the CL intensity increased, which promoted more superoxide radical (O2˙−) generation with photo-illuminated nano-TiO2 suspensions. Such an interesting discovery demonstrated that a simple luminol CFCL can be applied to sense the surface oxygen defects and evaluate their ROS generation and photocatalytic ability on different nano-TiO2 suspensions. Furthermore, the proposed CL has good agreement with the traditional XPS and Raman spectrometry. Therefore, it may be worth exploring as an alternative for evaluating the ROS generation and photocatalytic ability of different nano-TiO2 in water treatment, with the advantages of simple operation, fast response and low-cost, etc.
Experimental section
Chemicals and materials
Anatase TiO2 nanoparticles (DJ-01, 8 nm) were purchased from Beijing Deke Daojin Science and Technology Co. Ltd. (Beijing, China). Anatase TiO2 nanoparticles (ST-01, 20 nm; ST-02, 40 nm) were purchased from Macklin Biochemical Co. Ltd. (Shanghai, China). 5-Amino-2,3-dihydro-1,4-phthalazinedione (luminol), superoxide dismutase (SOD), sodium azide (NaN3), and isopropanol were purchased from Sigma-Aldrich (St. Louis, MO, USA). Suspensions were prepared using distilled water passed through an 18.2 MΩ Milli-Q purification system. Luminol was dissolved in NaCO3–NaHCO3 (Sinopharm Chemical Reagent Co. Ltd.) buffer with pH = 10.6. All experiments were performed at room temperature.Preparation and characterization of heat-treated TiO2 nanoparticles
The nano-TiO2 with a large number of surface defects (DJ-01) was calcined in an air atmosphere for 3 h at various temperatures (e.g., 573 K, 673 K, 773 K, 873 K, and 973 K) in an OTF-1200X tube furnace with the rate increasing at 10 K min−1. Oxygen molecules in the air were used to fill the oxygen vacancies of the nano-TiO2 surface. The obtained nano-TiO2 samples would be used for subsequent studies.An X-ray diffractometer (XRD, X'Pert PRO MPD, Netherlands, operated at 40 kV and 200 mA, Cu Kα source) was used to obtain X-ray diffraction patterns. The UV-vis absorption spectroscopy analyses (Shimadzu UV-300 plus, Tokyo, Japan) were conducted to determine the light absorption characteristics of nano-TiO2 samples. Barium sulfate was used as the reference material, and the light absorption was measured as a function of wavelength in the range 250–500 nm. The morphologies of the samples were studied using high-resolution transmission electron microscopy (HRTEM, HITACHI H-7500, Japan). Specific surface areas were obtained using the Brunauer–Emmett–Teller (BET) method from N2 adsorption–desorption isotherms at 77 K, which were measured using the Gemini apparatus (ASAP 2460, Micromeritics, Norcross, GA). XPS measurements were performed on a photoelectron spectrometer (ThermoFisher ESCALAB 250Xi, USA) at 2 × 10⁻⁹ Pa using Al Kα X-ray as the excitation source. A HITACHI F4500 fluorescence spectrophotometer (Tokyo, Japan) was used to obtain luminescence spectra at a slit-width of 20 nm and a scanning rate of 3000 nm min−1. Raman spectra were obtained on a Renishaw inVia Raman 30 spectrometer (Wotton-under-Edge, UK) with a 532 nm Ar+ laser beam (20 mW) as the excitation source.
Chemiluminescence experiment
A continuous flow chemiluminescence (CFCL) apparatus was built in our lab (Fig. S1†).28,37 Two quartz beakers (100 mL) were used for nano-TiO2 (0.1 mg mL−1) and luminol (50 μM). The two containers were connected separately to the peristaltic pumps through pump tubing (i.d. = 1 mm). Fluids were pumped into a spiral detection cell in the chemiluminescence analyzer (2.2 mL min−1), and the chemiluminescence intensity was measured with a photomultiplier tube (PMT). A BPCL ultraweak chemiluminescence analyzer was used to monitor the chemiluminescence signals with a working voltage of 1000 V and a data integration time of 0.01 s per spectrum. Finally, the chemiluminescence signals were imported to the computer for data analysis.Chemiluminescence spectra
Chemiluminescence spectra of nano-TiO2 and luminol were obtained using the CFCL device. Ten filters were added in the PMT that can separate a single wavelength (325 nm, 350 nm, 375 nm, 400 nm, 425 nm, 450 nm, 475 nm, 500 nm, 525 nm, and 575 nm). The intensities of chemiluminescence at different wavelengths were detected by a BPCL ultraweak chemiluminescence analyzer with relevant parameters as mentioned above.Generation and detection of superoxide free radicals
The generation of reactive oxygen species (ROS) was also detected in these nano-TiO2 suspensions. Irradiation of nano-TiO2 was performed under UV with a 500 W xenon lamp (Niubite, Beijing, China) by equipping the lamp with a 365 nm filter and a 400 nm cutoff filter. The incident light at 365 nm on the nano-TiO2 sample was measured with a power meter (Photoelectric Instrument Factory of Beijing Normal University, Beijing, China), and the intensity was 10 mW cm−2. The dynamic detection of O2˙− and ˙OH on these nano-TiO2 suspensions was carried out using the CFCL method.37 The concentrations of O2˙− and ˙OH were quantified according to our previous report.28,38Photocatalytic degradation of Rhodamine B
The photocatalytic activity of different nano-TiO2 samples was evaluated by their photocatalytic degradation efficiency toward Rhodamine B (1.0 mg mL−1), which was added to 100 mL of nano-TiO2 suspension (0.1 mg mL−1) in the photoreactor. At a given interval of UV irradiation, a 2 mL aliquot was withdrawn and centrifuged. The radiation intensity at the liquid upper surface was 1.4 mW cm−2, centered at 365 nm. The concentration of residual Rhodamine B in the supernatant was determined on the UV-vis spectrophotometer.39Results and discussion
Chemiluminescence induced by oxygen vacancies in nano-TiO2 suspensions
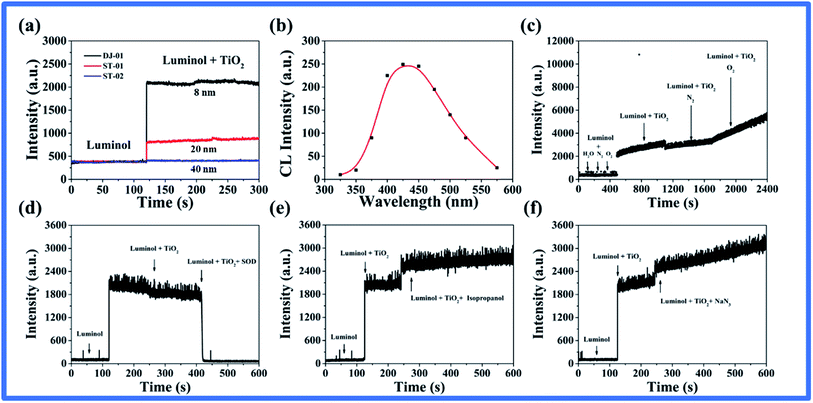
A surprising CL phenomenon was observed when luminol was mixed with un-illuminated nano-TiO2 suspensions: CL intensity increased with the decrease in the nano-TiO2 particle size within 40 nm, as shown in Fig. 1a. To explore the CL mechanism induced by nano-TiO2 and luminol, the identification of luminescent species, the CL spectrum was firstly measured (Fig. 1b), and the result showed that the maximum CL emission wavelength was about 425 nm, which corresponded to the emission band of excited luminol.40 As we know, the generation of the CL signal usually comes from the luminol oxygenation, thus, the effect of dissolved oxygen on CL was investigated in this system (Fig. 1c). It is worth noting that no change in the CL signal was observed with the oxygen removal or enrichment in luminol solution alone, indicating that the luminol CL was indeed caused by nano-TiO2 and not oxygen. The CL intensity induced by nano-TiO2–luminol increased with the enrichment of oxygen, which suggested that the oxidizing species may originate from the surface of nano-TiO2.By adding several possible reactive oxygen species scavengers, isopropanol (˙OH scavenger), NaN3 (1O2 scavenger), and SOD (O2˙− scavenger), we found that only SOD could quench chemiluminescence in this system (Fig. 1d–f). This suggested that the emission may be related to the stability of the superoxide species on the surface of nano-TiO2.22 It is generally appreciated that the ROS were generated during the UV irradiation of TiO2 nanoparticles.37 However, the question remains as to how the superoxide species are formed in the absence of light irradiation. As far as we know, the oxygen vacancy is an important link between nano-TiO2 and surface oxygen molecules, which is also an important property for regulating the catalytic activity of metal oxides. Some research has indicated that O2 is not adsorbed unless there are oxygen vacancies on the surface.20,25,26 Murphy et al. found evidence for the stabilization of superoxide radicals on the nano-TiO2 surface, specifically at anion vacancy sites, via EPR,22 and O2˙− was adsorbed at oxygen vacancy defects on the anatase surface labeled Vac⋯O2˙−.21–23 Therefore, we speculated that with the existence of substantial oxygen vacancies on the surface of the atypical nano-TiO2, the adsorbed oxygen molecules were stabilized on its surface in the form of superoxide species, and luminol was oxidized to produce chemiluminescence.
Relationship between chemiluminescence and oxygen vacancies
As described above, the CL intensity improved with the decrease in the nano-TiO2 particle size within 40 nm. The particle size may inherently affect their surface defects with the same crystal structure of nano-TiO2. The smaller the particle size, the more defects on the surface of nano-TiO2 due to their larger surface area,41 thus the stronger the CL intensity induced by them. To verify this possibility, we annealed the minimum sized nano-TiO2 (DJ-01) to obtain a series of samples and characterized their physical and chemical properties in detail. HRTEM images (Fig. 2a) showed well-ordered anatase fringes.33 XRD patterns showed that both the initial nano-TiO2 and heat-treated nano-TiO2 were all in the anatase phase, but the average crystallite size calculated by the Scherrer equation increased with the increase in the annealing temperature due to the significant reduction of the peak widths of the heat-treated nano-TiO2 (Fig. 2b and Table S1†).42,43 UV-vis diffuse reflectance spectra were used to study the optical properties as shown in Fig. S2.† The unannealed samples exhibited more obvious visible light absorption than all the annealed samples in the range of 400–500 nm, which indicated that there existed more abundant defects on the surface of the former.41 Some studies showed that more surface defects would lead to bandgap narrowing and improve the visible light absorption ability of nano-TiO2.16,30,33 We further calculated the apparent bandgap energy of the sample (Table S1†), which showed that the decrease in the defects after calcination caused the bandgap energy to widen.41 Fig. 2c shows the PL spectra of nano-TiO2 samples in the wavelength range of 350–550 nm with excitation at 320 nm, and six emission peaks were observed in this wavelength range, which originated from the presence of the surface defects and oxygen vacancies.33 In particular, the emission peaks at 447 nm and 460 nm were caused by nonstoichiometric nano-TiO2 or oxygen vacancies. The Gaussian function was used to integrate the peaks of wavelength at 447 nm and 460 nm. The results showed that the fully integrated peak intensity at 447 nm and 460 nm decreased with the increase in the annealing temperature of the nano-TiO2 samples, which also indicated that the oxygen vacancy content of nano-TiO2 samples decreased with the increase in the annealing temperature (Fig. S3†).33,41,43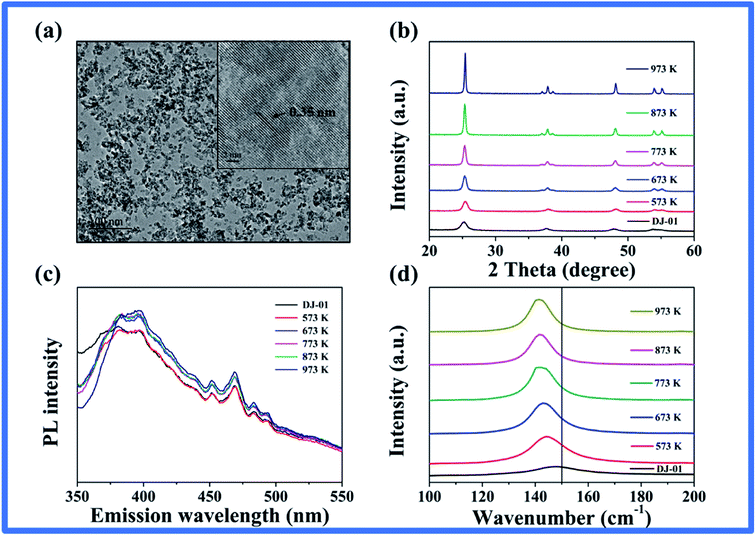 | ||
| Fig. 2 (a) HRTEM image and (b) XRD patterns of TiO2 (DJ-01) nanoparticles. (c) PL emission spectra of TiO2 nanoparticles. (d) Raman spectra showing the shift in the Eg(1) mode of the nano-TiO2. | ||
To further elucidate the oxygen vacancies on the surface of nano-TiO2, Raman scattering as an effective method was carried out, which was very sensitive to the crystallinity and microstructures of the materials. Raman lines became weak and broad when the samples had local lattice imperfections.31 Four Raman active modes at 144 cm−1, 399 cm−1, 519 cm−1, and 639 cm−1 were observed for all nano-TiO2 samples (Fig. S4†). This suggested that all samples were mainly composed of anatase, which was consistent with our XRD and HRTEM observations.30 The strongest peak at 144 cm−1 and the weaker one at 197 cm−1 correspond to the Eg modes, which were caused by the symmetric stretching vibrations of oxygen atoms in the O–Ti–O bond.33 As the annealing temperature increased, the high-intensity Raman peak (Eg) slightly shifted towards the lower wave-number side (red shift) as shown in Fig. 2d. Also, the intensity of the Eg mode increased and was accompanied by a line width decrease (Fig. S4†). This evidence suggests that as the annealing temperature increased, fewer oxygen vacancies existed on the surface of the nano-TiO2.30–34,44
The XPS spectra of nano-TiO2 samples are shown in Fig. S5† and 3. In general, there were three O 1s peaks after deconvolution, which can be assigned to lattice oxygen (OL, 530.3 eV), surface hydroxyl oxygen (O–OH, 532.1 eV), and adsorbed oxygen (OS, 533.6 eV) in TiO2, respectively (Fig. 3a–f).27,29 The oxygen vacancy content of TiO2 nanoparticles were calculated using the approximate formula (1), where VO represents the oxygen vacancies and s is the elemental sensitivity factor.27,29,45 The calculation results indicate that the oxygen vacancies of TiO2 samples decreased from 32.71% to 5.17% with the increase in the annealing temperature (Table S2†).
| VO% = {[(the atomic number ratio of Ti × 4) − (the atomic number ratio of OL × 2)]s/2} × 100 | (1) |
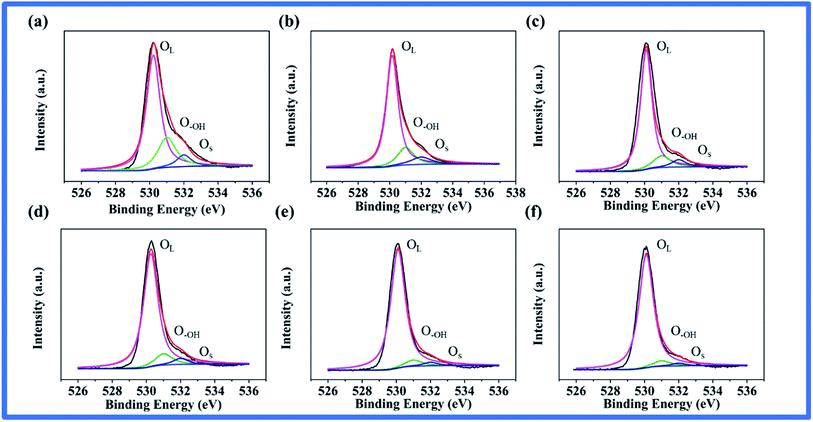 | ||
| Fig. 3 XPS spectra of O 1s on the surface of (a) TiO2, DJ-01. Heat-treated TiO2 at (b) 573 K, (c) 673 K, (d) 773 K, (e) 873 K, and (f) 973 K, respectively. | ||
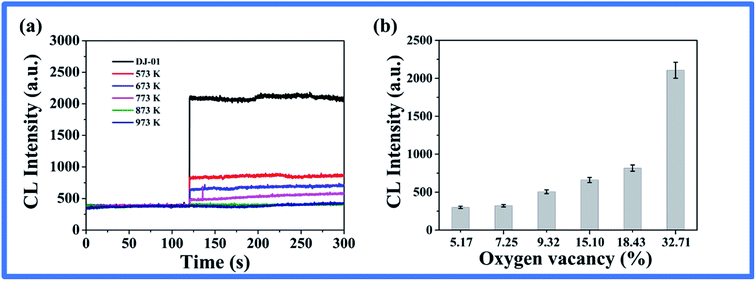
Based on the above, to further investigate whether the CL was dependent on the oxygen vacancies, the nano-TiO2 suspension with various heat-treated nano-TiO2 were mixed with the luminol solution, and the CL was detected. As seen in Fig. 4a, the measured CL intensities decreased with the increment of treatment temperature, which is consistent with the order of the oxygen vacancy contents in the different nano-TiO2 samples (Fig. 4b). These results verified that it was possible to achieve a rapid evaluation of oxygen vacancies according to the CL intensity in the nano-TiO2 suspension.
The connection between oxygen vacancies with photogenerated ROS and their photocatalytic activity
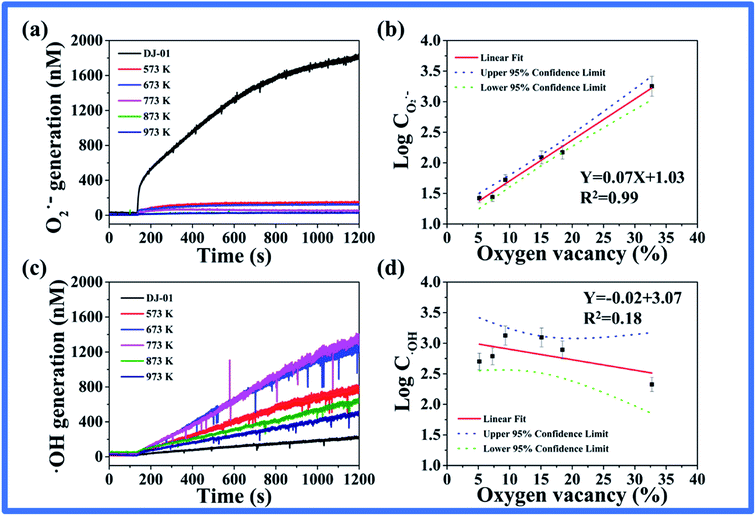
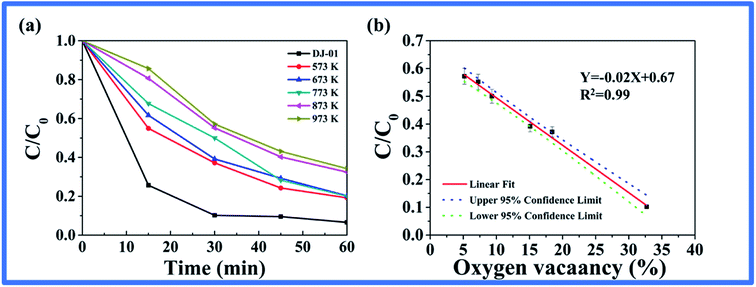
According to the previous report, the oxygen vacancies can exert a great influence on the separation and migration of photogenerated carriers and then govern the ROS formation and their photocatalytic activity.15 To further explore the connection of oxygen vacancies to the photo-induced ROS generation and the photocatalytic activity, the photoproduction of ROS including (O2˙− and ˙OH) and Rhodamine B photocatalytic degradation in these nano-TiO2 suspensions were studied. Firstly, various heat-treated nano-TiO2 with different oxygen vacancies were illuminated, the O2˙− and ˙OH were then detected by the CFCL method.37 As seen in Fig. 5, the amount of O2˙− decreased sharply at first, then the rate of decrease became slower with the increase in the heat treatment temperature (Fig. 5a). However, the ˙OH showed a mild change with the trend of firstly increasing and decreasing later (Fig. 5c). Moreover, we fit the relationship between the oxygen vacancy content and the amounts of the two ROS, respectively. As seen in Fig. 5b, the logarithm of the amount of O2˙− increased linearly with the percentage content of oxygen vacancies, with a correlation coefficient of R2 = 0.99. The results suggested that the relationship between the amount of O2˙− and the oxygen vacancy content could provide support for oxygen vacancies to determine photo-generated O2˙−. Nevertheless, we found that the amount of ˙OH and the oxygen vacancy content had a correlation coefficient of only R2 = 0.18 (Fig. 5d), which suggested that the oxygen vacancy may not be the influencing factor of ˙OH.Secondly, the degradation efficiency of nano-TiO2 samples for Rhodamine B was investigated (Fig. 6). The degradation efficiency decreased with the increase of annealing temperature of the nano-TiO2 samples, which was consistent with the formation of O2˙− from Fig. 6a. We also fit the relationship between the degradation efficiency of Rhodamine B and the oxygen vacancy content. As seen in Fig. 6b, the degradation efficiency of Rhodamine B increased linearly with the content percentage of oxygen vacancies, with a correlation coefficient R2 = 0.99. The results suggested that the oxygen vacancy content of nano-TiO2 played a decisive role in the photocatalytic efficiency.
Conclusions
In summary, a certain intensity of chemiluminescence was produced by mixing nano-TiO2 with luminol at the absence of light radiation. Its intensity reflected the intrinsic oxidation ability of the nano-TiO2, which was controlled by the surface oxygen vacancy defects. There was a commendable linear relationship between CL intensities and oxygen vacancy concentrations, and a certain definite positive correlation with the number of O2˙− photo-generated by nano-TiO2. We further confirmed that the photocatalytic activity of nano-TiO2 samples was greatly regulated by surface oxygen defects via the experiment of the degradation of organic matter. In conclusion, we have provided a rough method for the rapid screening of oxygen vacancies in nano-TiO2. This could also provide guidance for the performance of the photocatalyst, including the intrinsic oxidation capacity of the photocatalyst and the O2˙− photogenerated by the catalyst. We expect that more such methods are needed to reveal the bewildering mechanism of photocatalysis and provide guidance for a predictable recognition of the performance of catalysts in the degradation of environmental pollutants.Conflicts of interest
The authors declare no competing financial interests.Acknowledgements
The authors gratefully acknowledge the financial support of the National Key Research and Development Program of China (2016YFA0203102) and the National Natural Science Foundation of China (No. 21677152, 21876184).References
- J. Green, E. Carter and D. M. Murphy, Chem. Phys. Lett., 2009, 477(4–6), 340 CrossRef CAS.
- Y. H. Hu, Angew. Chem., Int. Ed. Engl., 2012, 51(50), 12410 CrossRef CAS PubMed.
- H. Tan, Z. Zhao, M. Niu, C. Mao, D. Cao, D. Cheng, P. Feng and Z. Sun, Nanoscale, 2014, 6(17), 10216 RSC.
- M. Pelaez, N. T. Nolan, S. C. Pillai, M. K. Seery, P. Falaras, A. G. Kontos, P. S. M. Dunlop, J. W. J. Hamilton, J. A. Byrne, K. O'Shea, M. H. Entezari and D. D. Dionysiou, Appl. Catal., B, 2012, 125, 331 CrossRef CAS.
- J. Schneider, M. Matsuoka, M. Takeuchi, J. Zhang, H. Yu, M. Anpo and D. W. Bahnemann, Chem. Rev., 2014, 114(19), 9919 CrossRef CAS PubMed.
- W. Y. Teoh, J. A. Scott and R. Amal, J. Phys. Chem. Lett., 2012, 3(3), 629 CrossRef CAS PubMed.
- P. V. Laxma Reddy, B. Kavitha, P. A. Kumar Reddy and K. H. Kim, Environ. Res., 2017, 154, 296 CrossRef CAS PubMed.
- A. Lebedev, F. Anariba, J. C. Tan, X. Li and P. Wu, J. Photochem. Photobiol., A, 2018, 360, 306 CrossRef CAS.
- X. Li, J. Xie, C. Jiang, J. Yu and P. Zhang, Front. Environ. Sci. Eng., 2018, 12(5), 14 CrossRef.
- L. Marzo, S. K. Pagire, O. Reiser and B. Konig, Angew. Chem., Int. Ed. Engl., 2018, 57(32), 10034 CrossRef CAS PubMed.
- U. Diebold, J. Lehman, T. Mahmoud, M. Kuhn, G. Leonardelli, W. Hebenstreit, M. Schmid and P. Varga, Surf. Sci., 1998, 411, 17 CrossRef.
- L. W. Fan Zuo, T. Wu, Z. Zhang, D. Borchardt and P. Feng, J. Am. Chem. Soc., 2010, 132, 11856 CrossRef PubMed.
- J. Haubrich, E. Kaxiras and C. M. Friend, Chemistry, 2011, 17(16), 4496 CrossRef CAS PubMed.
- Y. J. Hao, B. Liu, L. G. Tian, F. T. Li, J. Ren, S. J. Liu, Y. Liu, J. Zhao and X. J. Wang, ACS Appl. Mater. Interfaces, 2017, 9(14), 12687 CrossRef CAS PubMed.
- T. L. Thompson and J. T. Yates, Top. Catal., 2005, 35(3–4), 197 CrossRef CAS.
- X. Pan, M. Q. Yang, X. Fu, N. Zhang and Y. J. Xu, Nanoscale, 2013, 5(9), 3601 RSC.
- A. Sarkar and G. G. Khan, Nanoscale, 2019, 11(8), 3414 RSC.
- X. Xin, T. Xu, J. Yin, L. Wang and C. Wang, Appl. Catal., B, 2015, 176–177, 354 CrossRef CAS.
- I. Nakamura, N. Negishi, S. Kutsuna, T. Ihara, S. Sugihara and K. Takeuchi, J. Mol. Catal. A: Chem., 2000, 161, 205 CrossRef CAS.
- M. Setvin, U. Aschauer, P. Scheiber, Y. F. Li, W. Hou, M. Schmid, A. Selloni and U. Diebold, Science, 2013, 341(6149), 988 CrossRef CAS PubMed.
- U. Aschauer, J. Chen and A. Selloni, Phys. Chem. Chem. Phys., 2010, 12(40), 12956 RSC.
- E. Carter, A. F. Carley and D. M. Murphy, J. Phys. Chem. C, 2007, 111, 8 CrossRef PubMed.
- M. A. Henderson, W. S. Epling, C. L. Perkins, C. H. F. Peden and U. Diebold, J. Phys. Chem. B, 1999, 103(25), 5328 CrossRef CAS.
- E. Lira, S. Wendt, P. Huo, J. O. Hansen, R. Streber, S. Porsgaard, Y. Wei, R. Bechstein, E. Laegsgaard and F. Besenbacher, J. Am. Chem. Soc., 2011, 133(17), 6529 CrossRef CAS PubMed.
- M. P. de Lara-Castells and J. L. Krause, Chem. Phys. Lett., 2002, 354, 483 CrossRef CAS.
- S. Tan, Y. Ji, Y. Zhao, A. Zhao, B. Wang, J. Yang and J. G. Hou, J. Am. Chem. Soc., 2011, 133(6), 2002 CrossRef CAS PubMed.
- L. Zhang, S. Wang and C. Lu, Anal. Chem., 2015, 87(14), 7313 CrossRef CAS PubMed.
- W. Yu, L. Zhao, F. Chen, H. Zhang and L. H. Guo, J. Phys. Chem. Lett., 2019, 10(11), 3024 CrossRef CAS PubMed.
- J. Liang, Q. Xu, X. Teng, W. Guan and C. Lu, Anal. Chem., 2020, 92(1), 1628 CrossRef CAS PubMed.
- Q. Wu, Q. Zheng and R. van de Krol, J. Phys. Chem. C, 2012, 116(12), 7219 CrossRef CAS.
- W. F. Zhang, Y. L. He, M. S. Zhang, Z. Yin and Q. Chen, J. Phys. D: Appl. Phys., 2000, 33, 912–916 CrossRef CAS.
- E. Barborini, I. N. Kholmanov, P. Piseri, C. Ducati, C. E. Bottani and P. Milani, Appl. Phys. Lett., 2002, 81(16), 3052 CrossRef CAS.
- J. Dhanalakshmi, S. Iyyapushpam, S. T. Nishanthi, M. Malligavathy and D. Pathinettam Padiyan, Adv. Nat. Sci.: Nanosci. Nanotechnol., 2017, 8(1), 015015 Search PubMed.
- A. Sarkar, G. G. Khan, A. Chaudhuri, A. Das and K. Mandal, Appl. Phys. Lett., 2016, 108(3), 033112 CrossRef.
- S. Xue, Q. Li, L. Wang, W. You, J. Zhang and R. Che, Anal. Chem., 2019, 91(4), 2659 CrossRef CAS PubMed.
- T. Tachikawa and T. Majima, Chem. Commun., 2012, 48(27), 3300 RSC.
- D. Wang, L. Zhao, L. H. Guo and H. Zhang, Anal. Chem., 2014, 86(21), 10535 CrossRef CAS PubMed.
- D. Wang, L. Zhao, H. Ma, H. Zhang and L. H. Guo, Environ. Sci. Technol., 2017, 51(17), 10137 CrossRef CAS PubMed.
- R. Vinu, S. U. Akki and G. Madras, J. Hazard. Mater., 2010, 176(1–3), 765 CrossRef CAS PubMed.
- M. Kamruzzaman, A.-M. Alam, K. M. Kim, S. H. Lee, Y. H. Kim, A. N. M. H. Kabir, G.-M. Kim and T. D. Dang, Biomed. Microdevices, 2012, 15(1), 195 CrossRef PubMed.
- Z. Wu, S. Cao, C. Zhang and L. Piao, Nanotechnology, 2017, 28(27), 275706 CrossRef PubMed.
- F. S. Ali, K. Qi, B. Al Wahaibi, M. A. Meetani, H. Al Lawati, Y. Kim, S. M. Z. Al Kindy and R. Selvaraj, Desalin. Water Treat., 2017, 79, 301 CrossRef.
- Z. Li, R. Liu and Y. Xu, J. Phys. Chem. C, 2013, 117(46), 24360 CrossRef CAS.
- J. C. Parker and R. W. Siegel, Appl. Phys. Lett., 1990, 57(9), 943 CrossRef CAS.
- M. You, T. G. Kim and Y.-M. Sung, Cryst. Growth Des., 2010, 10(2), 983 CrossRef CAS.
Footnote |
| † Electronic supplementary information (ESI) available. See DOI: 10.1039/d0ra06299e |
| This journal is © The Royal Society of Chemistry 2020 |

