 Open Access Article
Highly flexible reduced graphene oxide@polypyrrole–polyethylene glycol foam for supercapacitors†
Chaoyue Caiab,
Jialong Fuab,
Chengyan Zhangab,
Cheng Wangb,
Rui Sunb,
Shufang Guoab,
Fan Zhangab,
Mingyan Wang *ab,
Yuqing Liucd and
Jun Chen
 *d
*d
aDepartment of Chemical Engineering, Jiangsu Ocean University, Lianyungang, 222005, China. E-mail: mingyanlyg@hotmail.com
bJiangsu Key Laboratory of Marine Biotechnology, Jiangsu Key Laboratory of Marine Bioresources and Environment, Co-Innovation Center of Jiangsu Marine Bio-industry Technology, Jiangsu Ocean University, Lianyungang, 222005, China
cState Key Laboratory of Electronic Thin Film and Integrated Devices, University of Electronic Science and Technology of China, Chengdu, 610054, PR China
dIntelligent Polymer Research Institute, ARC Centre of Excellence for Electromaterials Science, Australian Institute for Innovative Materials, Innovation Campus, University of Wollongong, Squires Way, North Wollongong, NSW2519, Australia. E-mail: junc@uow.edu.au
First published on 6th August 2020
Abstract
A flexible and free-standing 3D reduced graphene oxide@polypyrrole–polyethylene glycol (RGO@PPy–PEG) foam was developed for wearable supercapacitors. The device was fabricated sequentially, beginning with the electrodeposition of PPy in the presence of a PEG–borate on a sacrificial Ni foam template, followed by a subsequent GO wrapping and chemical reduction process. The 3D RGO@PPy–PEG foam electrode showed excellent electrochemical properties with a large specific capacitance of 415 F g−1 and excellent long-term stability (96% capacitance retention after 8000 charge–discharge cycles) in a three electrode configuration. An assembled (two-electrode configuration) symmetric supercapacitor using RGO@PPy–PEG electrodes exhibited a remarkable specific capacitance of 1019 mF cm−2 at 2 mV s−1 and 95% capacitance retention over 4000 cycles. The device exhibits extraordinary mechanical flexibility and showed negligable capacitance loss during or after 1000 bending cycles, highlighting its great potential in wearable energy devices.
Introduction
The rapid development of portable electronics increases the need for flexible energy storage devices, among which flexible solid-state supercapacitors (SCs) are considered as a promising candidate due to their high power density, fast charge–discharge rates, long-term stability and the relative ease of large-scale fabrication.1 Recent research has focussed on developing flexible,2 wearable3,4 and stretchable solid-state SCs.5,6Polypyrrole (PPy), a conjugated and conductive polymer, is highly conductive, simple and cheap to fabricate, and environmentally friendly, a unique combination of properties which has led to it being widely investigated for broad applications including sensors,7 supercapacitors,8 and actuators.9 However, disadvantages such as the brittle nature of conventional PPy films have limited its application to flexible electronics.10 Due to large volumetric changes, arising from the intercalation/deintercalation of electrolyte ions, PPy undergoes shrinkage and swelling which in turn lead to crack formation and propagation during charge/discharge cycling and therefore typically has poor long-term stability in electrochemical devices,11 presenting another major hurdle for its practical applications.
To overcome these limitations, an emerging solution is to dope PPy with other, more flexible, polymers for better toughness and flexibility. Yang et al.12 reported a composite film of PPy/montmorillonite–polyvinylidenedifluoride/polymethyl methacrylate produced by a solvent casting technique, which has good absorbance ability for LiPF6 organic electrolyte and exhibits good capacity retention and cycling performance. Ma et al.13 developed a strong and flexible polymer film by combining a rigid matrix (polypyrrole) with a dynamic network (pentaerythritol ethoxylate–borate). The prepared composite film can lift objects 380 times heavier than itself and transport cargo 10 times heavier than itself. A polyurethane/polypyrrole nanofibrous bending actuator was fabricated by the combined use of electrospinning and in situ chemical polymerization, which showed a bending displacement of ∼141° during a potential cycling and demonstrated good thermal stability.14 These reports indicate that the doping polymers not only provide extra mechanical support and flexibility, but also allow room for PPy to undergo volumetric swelling and contraction during charge/discharge cycles, enabling enhanced and stable capacitance retention. However, the electrical conductivity of the PPy composites was affected by the added insulating polymers.15
Recently, three-dimensional (3D) sponges or aerogels, such as graphene aerogels,16 carbon nanotube sponges,17 or metal nanowires,18 have attracted great research interest due to their ultralight weight and excellent electrical conductivity. Yusik Myung et al.19 reported the synthesis of hierarchical and lightweight graphene aerogels with interconnected three-dimensional (3D) nanostructures for high performance coin cell-type supercapacitors. An exceptional volumetric discharge capacity of 1 A h cm−3 was realized using a 35 μm-thick, sponge-like free-standing S-doped carbon nanotube (CNT) paper, where the CNTs act as three-dimensional conductive matrices.20 Wang et al.21 prepared a new class of Au–Ag nanoporous sponge composed of three-dimensional metal networks without any stabilizing agents. These metal sponges can work as superior multifunctional catalysts for oxygen reduction, ethylene glycol (EG) oxidation, and glucose oxidation reactions. However, the weak flexibility and ductility of these inorganic materials are big obstacle for their application in flexible electronic devices. Therefore, it remains necessary to develop strong, elastic, and highly conductive composites.
In this paper, we designed a facile way to structure a free-standing 3D polypyrrole–polyethylene glycol (PPy–PEG) foam by electrodeposition of pyrrole in the presence of a PEG–borate complex on a sacrificial Ni foam template. Here, the PEG serves as a soft cross-linker, which can be connected to the rigid PPy via hydrogen bonding and electrostatic interactions. The interpenetrating network between PEG and PPy polymer chains helps to dissipate destructive mechanical energy. Along with the advantages of the 3D porous structure in absorbing electrolyte, this flexible and ultralight PPy–PEG foam shows great potential in flexible electrochemical devices. The 3D PPy–PEG foam was then wrapped with graphene oxide (GO) by a simple dip-coating method. The GO was then reduced by hydrazine hydrate vapor,22 resulting in a flexible, 3D, RGO@PPy–PEG foam (Scheme 1). The addition of RGO to the 3D PPy–PEG blocks serves two purposes, firstly to increase the electric conductivity, and secondly to increase the mechanical strength of the composite. These enhancements lead to better capacitive behavior and long-term cycling stability.
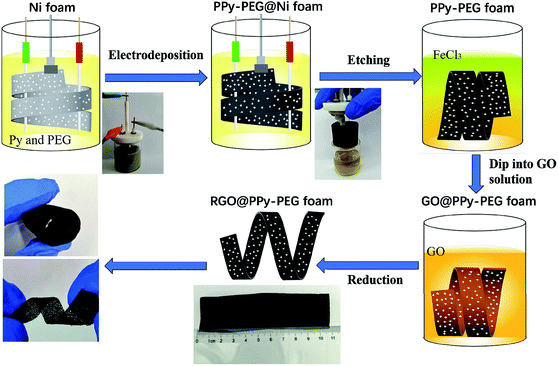 | ||
| Scheme 1 Schematic diagram and accompanying photographs of the fabrication of flexible, lightweight, and conductive RGO@PPy–PEG foams. | ||
The as-prepared RGO@PPy–PEG foam is highly elastic and flexible, returning to its original state after stretching, rolling, or twisting (Scheme 1). The RGO@PPy–PEG electrodes also show excellent electrochemical capacitance in three electrode system with a large specific capacitance of 415 F g−1 and good cyclic stability with a capacitance retention of 96% after 8000 charge/discharge cycles. A symmetric supercapacitor assembled using RGO@PPy–PEG electrodes, exhibited a remarkable specific capacitance of 1019 mF cm−2 at 2 mV s−1, excellent cyclic stability and extraordinary mechanical flexibility. In addition, three devices connected in series can successfully light up five colorful light-emitting diodes for more than 15 min, demonstrating the great potential in real applications.
Experimental
Reagents and apparatus
The Ni foams were purchased from Shanghai Zhongwei New Material Co. Ltd, which were washed with anhydrous ethanol, acetone, and ultrapure water and dried prior to use. Pyrrole (98%) was purchased from Sinopharm Chemical Reagent Co., Ltd (Shanghai, China), which was further purified by vacuum distillation. Boron trifluoride diethyl etherate (BFEE) was distilled under reduced pressure prior to use. All other chemicals were analytical reagent grade and used without further purification. All solutions were prepared with ultrapure water of resistivity 18.2 MΩ cm obtained from a Millipore Milli-Q system.The crystalline properties and morphologies of the as-prepared materials were characterized by powder X-ray diffraction (XRD, D8-advanced, Bruker, 40 kV, 20 mA, Cu Kα radiation) scanning electron microscopy (SEM, JEOL, Japan, JSM6700F) and transmission electron microscopy (TEM, JEOL2010, voltage of 200 kV). The atomic composition of the samples was detected by X-ray photoelectron spectroscopy (XPS, Perkin Elmer, Al Kα radiation). IR spectra were recorded on a FT-IR Nicolet 380 spectrometer in solid KBr pellets.
Synthesis of PPy–PEG foam
The PPy–PEG foam was synthesized using an electrochemical deposition method. The experiment was controlled by a 660C electrochemical workstation (CHI). The synthesis was performed in an electrolytic cell consisting of a nickel foam electrode as the working electrode, a Pt wire as the counter electrode, and a 0.5 mm diameter Ag/AgCl wire as the quasi-reference electrode. The size of the nickel foam electrode is about 11 cm × 3 cm × 3 mm, which is curled within the electrolytic cell (see Scheme 1). The electrolyte was 0.05 M pyrrole in a mixture of isopropanol (IPA) and BFEE at volume ratio (VIPA![[thin space (1/6-em)]](https://www.rsc.org/images/entities/char_2009.gif) :
:![[thin space (1/6-em)]](https://www.rsc.org/images/entities/char_2009.gif) VBFEE) of 7
VBFEE) of 7![[thin space (1/6-em)]](https://www.rsc.org/images/entities/char_2009.gif) :
:![[thin space (1/6-em)]](https://www.rsc.org/images/entities/char_2009.gif) 3, with 5% PEG 600 by volume. The solution was degassed on a rotavapor (Shanghai Yaote Instrument Co. Ltd) at 100 kPa for 3 min. The PPy–PEG foam was electrodeposited using the three-electrode set up described above, via chronopotentiometry with 0.8 V applied to the working electrode for 1 h at room temperature. During the electrochemical deposition process, the electrolyte was under magnetic stirring to ensure the PPy electropolymerized on the Ni foam uniformly. After synthesis, the as-prepared electrode was washed with isopropanol and ultrapure water to remove any unreacted chemicals. After washing, the nickel foam was etched completely away over 12 hours using a 1 M FeCl3 solution. The free-standing 3D PPy–PEG foam was taken out of the solution and rinsed with water (to remove FeCl3) and air dried. As a control, electrochemical deposition of PPy without PEG on the nickel foam was also performed under the same procedure and identical conditions, which was denoted as PPy foam.
3, with 5% PEG 600 by volume. The solution was degassed on a rotavapor (Shanghai Yaote Instrument Co. Ltd) at 100 kPa for 3 min. The PPy–PEG foam was electrodeposited using the three-electrode set up described above, via chronopotentiometry with 0.8 V applied to the working electrode for 1 h at room temperature. During the electrochemical deposition process, the electrolyte was under magnetic stirring to ensure the PPy electropolymerized on the Ni foam uniformly. After synthesis, the as-prepared electrode was washed with isopropanol and ultrapure water to remove any unreacted chemicals. After washing, the nickel foam was etched completely away over 12 hours using a 1 M FeCl3 solution. The free-standing 3D PPy–PEG foam was taken out of the solution and rinsed with water (to remove FeCl3) and air dried. As a control, electrochemical deposition of PPy without PEG on the nickel foam was also performed under the same procedure and identical conditions, which was denoted as PPy foam.
Synthesis of RGO@PPy–PEG foam
Graphene Oxide (GO) was synthesized by the modified Hummers method.23 The resulting GO solution was ultrasonicated for 1 h, centrifuged to remove any unexploited graphite particles, and diluted in ultrapure water to a concentration of 3 mg mL−1. The PPy–PEG modified RGO was synthesized through the following procedures. First, the 3D PPy–PEG foam substrate was immersed in the GO solution and soaked for 0.5 h before being allowed to dry in air overnight. Then, hydrazine hydrate vapor was used to reduce the 3D PPy–PEG/GO into 3D RGO@PPy–PEG at 90 °C for 10 hours, followed by rinsing with water and drying in air. Various concentrations of GO solutions were employed, the resulting materials were denoted as RGO1@PPy–PEG, RGO3@PPy–PEG and RGO6@PPy–PEG, according to the relevant GO solution concentration (1 mg mL−1, 3 mg mL−1, and 6 mg mL−1 respectively).Electrochemical measurement
All electrochemical experiments were performed on an electrochemical workstation (CHI 660C, Chenhua Instrument Co., Ltd., China). Cyclic Voltammetry (CV) and galvanostatic charge–discharge (GCD) testing were carried out using a three electrodes cell, including a saturated calomel electrode (SCE) as the reference electrode and a platinum wire electrode as the counter electrode, 1 M H2SO4 aqueous solution was used as electrolyte. The as prepared materials (1.5 cm × 1.0 cm × 3 mm) were directly used as the working electrode. CV tests were conducted at different scan rates from 2 to 100 mV s−1 and GCD tests were conducted at different current densities from 1 to 20 A g−1. The cyclic stability measurements were carried by GCD tests at 2.5 A g−1. Electrochemical Impedance Spectroscopy (EIS) measurements were carried out at open circuit potential with an AC perturbation of 10 mV in the frequency range from 0.01 Hz to 100 kHz.The specific capacitance values calculated from CV plots and GCD curves are by following:
where
 is the integrated area of the CV plot, ΔV is the voltage window (V), m is the mass of electrode material (g), S is the scan rate (V s−1), I is the constant current used for charging and discharging (A), and Δt is the discharge time (s).
Fabrication of solid-state supercapacitor
The solid-state supercapacitor was assembled by two RGO@PPy–PEG composite symmetric electrodes with poly(vinyl alcohol) (PVA)/H2SO4 gel as electrolyte and a piece of cellulose filter paper as separator, two pieces of carbon cloth were used as the conductors. The active area of the solid-state supercapacitors was 2.0 cm × 1.0 cm and the thickness was controlled at 3 mm. For the preparation of PVA/H2SO4 gel electrolyte, 16 mL of ultrapure water was added to 2 g of PVA powder and the mixture was stirred vigorously at 85 °C. When the PVA aqueous solution turned clear, 4 mL of 2 M H2SO4 was added dropwise and stirred for another 2 h for complete solvation and homogeneous mixing. The electrodes of RGO@PPy–PEG were soaked into the PVA gel electrolyte for 10 min. After the excess water was vaporized, the two as-prepared electrodes were symmetrically integrated into one flexible supercapacitor device wrapped tightly by parafilm.Conductivity and mechanical measurements
A four-point probe (RTS-5, Guangzhou Four-Point Probe Technology Co., Ltd., Guangzhou, China) was used to measure the electrical conductivity of the as-prepared foams (2 cm × 2 cm × 1 mm, density of approximately 20 mg cm−3). The probes were placed in line, with equal 1 mm spacing. At least five positions were measured on the samples' surface to obtain the mean value of the electrical conductivity.A dynamic mechanical analyser (DMA, 242-E Artemis, Naichi Scientific Instrument Trading Co., Ltd., Germany) was used to investigate mechanical properties of the resultant foams. All specimens were prepared in dimensions of 8 mm × 13 mm × 6 mm. A preload force of 0.01 N was applied to the samples at 28 °C for 30 min to reach thermal equilibrium. The test in compression mode was performed at a fixed frequency of 1 Hz in controlled force mode with a load force of 2 N for 200 cycles. Three samples for each foam were tested.
Results and discussion
Characterization
The SEM images of the pure Ni foam, PPy, PPy–PEG and RGO@PPy–PEG foams are shown in Fig. 1a–i, respectively. All the samples exhibit a three-dimensional porous structure (Fig. 1a, d, g) similar to the Ni foam template (Inset in Fig. 1a). In comparison to the Ni foam which had a smooth surface and metallic lustre (inset of Fig. 1a), the PPy foam presents the a rough surface (Fig. 1a) with typical broccoli-like structure morphologies for electropolymerized PPy (Fig. 1c).24 The PPy skeleton is hollow (Fig. 1b), indicating the successful etching of the nickel foam template. With the addition of PEG, the surface of PPy–PEG film become smooth and dense (Fig. 1e and f). This morphology change arises since PEG acts as a surfactant, changing the electrode/electrolyte solid–liquid interface during pyrrole polymerization, thereby reducing PPy particle size.25 Fig. 1g shows the SEM image of the free-standing 3D RGO@PPy–PEG foam and it reveals that the PPy–PEG skeleton was uniformly covered by graphene nanosheets. A close view reveals that some of the 3D PPy–PEG holes were covered by graphene nanosheets and the wrinkles on the PPy–PEG film can be see through the transparent graphene nanosheets (Fig. 1h and i). A TEM image of the RGO@PPy–PEG sheet stripped from the 3D RGO@PPy–PEG foam is shown in ESI Fig. S1.† TEM observation shows that the RGO has a typically curved and layer-like structure. And the RGO sheets are coated on the surface of PPy–PEG skeleton.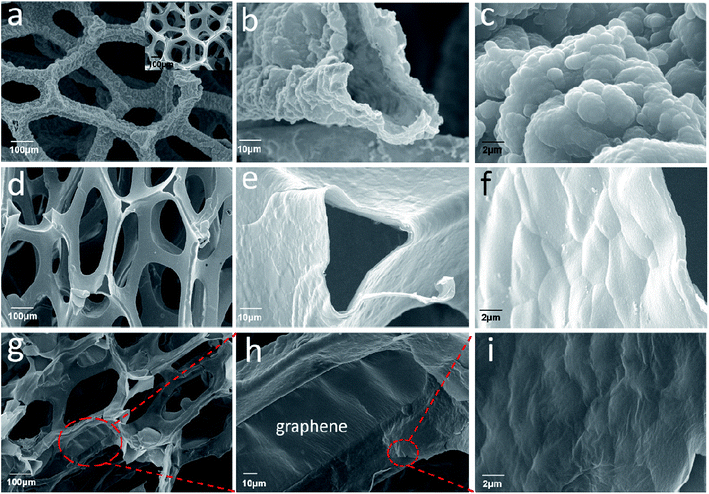 | ||
| Fig. 1 SEM images of PPy foam (a–c); PPy–PEG foam (d–f); and RGO@PPy–PEG foam (g–i) with different magnification (inset of a: SEM image of Ni foam). | ||
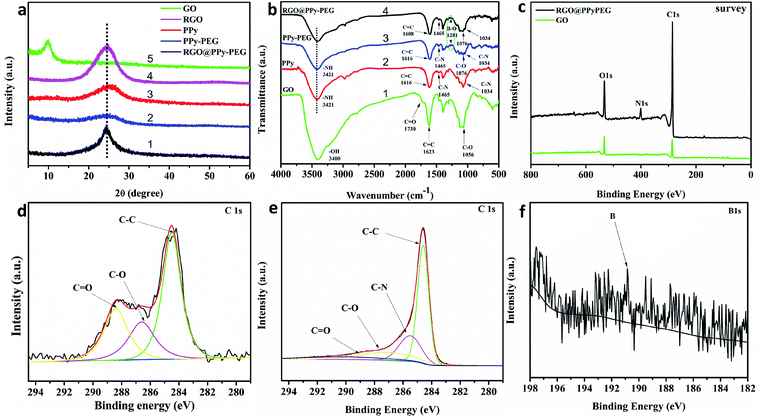
To further investigate the molecular structure of GO, RGO, PPy, PPy–PEG and RGO@PPy–PEG foams, typical XRD patterns of these samples are presented in Fig. 2a. Compared with the GO foam (Fig. 2a curve 1), the (002) diffraction peak of RGO shifted from 2θ = 9.2° to about 2θ = 24.7° (Fig. 2a curve 2), indicating a decreased interlayer spacing corresponding to GO reduction.26 The shift of the characteristic peak (002) indicates the oxygen containing groups on the graphene sheets was eliminated and GO was successfully reduced by hydrazine hydrate vapor.22 The wide characteristic peak of PPy at 2θ = 25.2° (Fig. 2a, curve 3), indicates that the prepared PPy has an amorphous structure with a low degree of order.27 The diffraction pattern for PPy–PEG is similar to pure PPy (Fig. 2a, curve 4), indicating that the addition of PEG had little effect on the crystal structure.28 When comparing the XRD pattern of pure PPy, with the RGO@PPy–PEG (Fig. 2a curve 5), the main peak shifts from 2θ = 25.2° to 24.6° and has a decreased FHWH, which can be attributed to the π–π interaction between RGO and PPy–PEG.29 This clearly demonstrates that strong bonding and successful synthesis of RGO@PPy–PEG.
To study the types of the functional groups present on the synthesized materials, Fourier-transform infrared spectroscopy (FT-IR) was performed and shown in Fig. 2b. The absorption bands of GO at 3400, 1730, 1623, and 1056 cm−1 are due to the stretching vibration of –OH, the stretching vibration of C![[double bond, length as m-dash]](https://www.rsc.org/images/entities/char_e001.gif) O, the vibration of residual C
O, the vibration of residual C![[double bond, length as m-dash]](https://www.rsc.org/images/entities/char_e001.gif) C skeleton carbon and the stretching vibration peak of C–O, respectively (Fig. 2b curve 1).30 The characteristic peaks of PPy at 3421, 1616, 1465 and 1034 cm−1 correspond to N–H stretching vibration of pyrrole ring, C
C skeleton carbon and the stretching vibration peak of C–O, respectively (Fig. 2b curve 1).30 The characteristic peaks of PPy at 3421, 1616, 1465 and 1034 cm−1 correspond to N–H stretching vibration of pyrrole ring, C![[double bond, length as m-dash]](https://www.rsc.org/images/entities/char_e001.gif) C ring stretching of pyrrole, pyrrole C–N ring stretching and C–N in-plane deformation vibration (Fig. 2b curve 2).28 PPy–PEG has almost the same characteristic peaks as PPy, which shows that PEG has little effect on the electro-polymerization process of pyrrole and the structure of PPy skeleton. In addition, the absorption band of PPy–PEG at 1281 cm−1 corresponds to B–O bond which was formed by the hydroxyl group of PEG reacting with BFEE.31 The peak at 1076 cm−1 is attributed to C–O stretching vibration of PEG (Fig. 2b curve 3). From the infrared spectra of RGO@PPy–PEG (Fig. 2b curve 4), the C
C ring stretching of pyrrole, pyrrole C–N ring stretching and C–N in-plane deformation vibration (Fig. 2b curve 2).28 PPy–PEG has almost the same characteristic peaks as PPy, which shows that PEG has little effect on the electro-polymerization process of pyrrole and the structure of PPy skeleton. In addition, the absorption band of PPy–PEG at 1281 cm−1 corresponds to B–O bond which was formed by the hydroxyl group of PEG reacting with BFEE.31 The peak at 1076 cm−1 is attributed to C–O stretching vibration of PEG (Fig. 2b curve 3). From the infrared spectra of RGO@PPy–PEG (Fig. 2b curve 4), the C![[double bond, length as m-dash]](https://www.rsc.org/images/entities/char_e001.gif) C stretching vibration of pyrrole ring moves from 1616 to 1608 cm−1 due to the π–π conjugation between the pyrrole ring and RGO,32 which is consistent with the XRD results, indicating the successful synthesis of RGO@PPy–PEG.
C stretching vibration of pyrrole ring moves from 1616 to 1608 cm−1 due to the π–π conjugation between the pyrrole ring and RGO,32 which is consistent with the XRD results, indicating the successful synthesis of RGO@PPy–PEG.
XPS measurements were used to characterize the chemical states of elements in RGO@PPy–PEG and GO samples (Fig. 2c). A characteristic signal of N 1s is found at 399.7 eV in the sample of RGO@PPy–PEG in addition to the signal of C 1s and O 1s observed in the GO sample, confirming the presence of N-containing pyrrole moieties in the RGO@PPY–PEG sample. The C 1s peaks of GO can be deconvoluted into three peaks located at 284.5 (C–C), 286.7 (C–O) and 288.5 eV (C![[double bond, length as m-dash]](https://www.rsc.org/images/entities/char_e001.gif) O),26 respectively (Fig. 2d). However, the C 1s XPS spectrum of RGO@PPy–PEG can be deconvoluted into four peaks located at 284.6 (C–C), 285.5 (C–N), 287.0 (C–O) and 289.0 eV (C
O),26 respectively (Fig. 2d). However, the C 1s XPS spectrum of RGO@PPy–PEG can be deconvoluted into four peaks located at 284.6 (C–C), 285.5 (C–N), 287.0 (C–O) and 289.0 eV (C![[double bond, length as m-dash]](https://www.rsc.org/images/entities/char_e001.gif) O),33 respectively. The presence of the C–N C 1s peak, again confirms the presence of pyrrole moieties in the RGO@PPy–PEG sample.34 The intensity of the oxygenated groups in RGO@PPy–PEG is significantly decreased, corresponding to the reduction of GO by hydrazine hydrate vapor.33 This result is in a good agreement with the results of XRD. A small peak at 190.8 eV is attributed to B element in the composite (Fig. 2f). The small amount of B comes from the dopant of PEG–borate, which is consistent with the infrared test results and previous reports.35
O),33 respectively. The presence of the C–N C 1s peak, again confirms the presence of pyrrole moieties in the RGO@PPy–PEG sample.34 The intensity of the oxygenated groups in RGO@PPy–PEG is significantly decreased, corresponding to the reduction of GO by hydrazine hydrate vapor.33 This result is in a good agreement with the results of XRD. A small peak at 190.8 eV is attributed to B element in the composite (Fig. 2f). The small amount of B comes from the dopant of PEG–borate, which is consistent with the infrared test results and previous reports.35
The phases of GO and RGO@PPy–PEG hybrids were further confirmed by Raman spectra. The typical Raman spectra of GO and RGO@PPy–PEG hybrid is shown in Fig. S2.† It is noted GO exhibits a G band at 1604 cm−1, while the corresponding G band of RGO@PPy–PEG is at 1590 cm−1. The red shift of G band of RGO@PPy–PEG can be attributed to the recovery of the hexagonal network of carbon in RGO.36 The RGO@PPy–PEG hybrid shows the characteristic peaks of PPy (930 cm−1 attributing to quinoid polaronic structure, and 1062 cm−1 attributing to the C–H in-plane deformation).37
Conductivity and flexibility
There are two key considerations that need to be coupled for flexible, wearable supercapacitor devices; mechanical properties – specifically light weight and flexibility; and electrical properties – high conductivity and capacitance of the electrode. Here the density and the electrical conductivity of the as-prepared foams were measured and are listed in Table 1.| Sample | Density (mg cm−3) | Electrical conductivity (S m−1) | Electrical resistivity (Ω cm) |
|---|---|---|---|
| PPy | 15.3 | 12.5 | 8 |
| PPy–PEG | 17.3 | 5.1 | 19.3 |
| RGO@PPy–PEG | 24.2 | 403.2 | 0.248 |
The as-prepared 3D foams are all ultralight with a density below 25 mg cm−3, which was achieved due to the hollow ‘skeleton’ PPy scaffold. To demonstrate the low density, we show that a large chunk of 3D RGO@PPy–PEG can be supported by the pappus of a dandelion flower (ESI Fig. S3†). In terms of electrical conductivity, the RGO@PPy–PEG shows the largest value of 403.2 S m−1, about 30 times higher than pure PPy foam (12.5 S m−1), which is due to the continuous RGO wrapping on PPy–PEG blocks. The relatively low conductivity of PPy–PEG foam (5.1 S m−1) than PPy electrode is in consistent with literature reported results due to the addition of insulating PEG.15
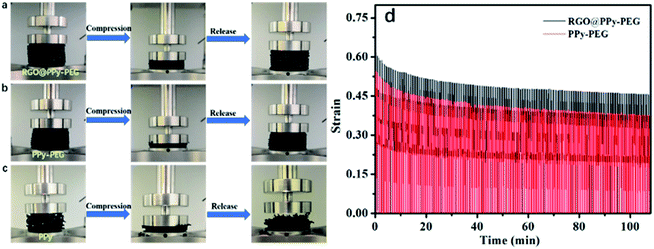
The mechanical properties of the resultant foams were also tested. As shown in Fig. 3a and b, the PPy–PEG and RGO@PPy–PEG foam exhibited a high deformability over 70% compressive strain and spontaneously recovered their sizes and shapes without breaking when the pressure was released. However, the same pressure leads to a permanent damage of the PPy foam due to the brittle backbone of pure PPy (Fig. 3c). As we know, when PEG is mixed with borate, the terminal alcohol groups of PEG can react with boron trifluoride to form borate ester bond, which connects PEG into PPy matrix with negative charges on tetra-coordinated boron atoms during the electrodeposition process. The PEG serves as soft cross-linkers between rigid PPy chains. The combination of a rigid polymer (PPy) with a soft polymer (PEG) can efficiently enhance the strength and elasticity for the PPy–PEG foam.21
The mechanical stability and the elasticity of the as-prepared PPy–PEG and RGO@PPy–PEG foams were tested by over 200 cycles in compression mode, and the results are shown in Fig. 3d. Upon compression and release, the foams of PPy–PEG and RGO@PPy–PEG show minimal permanent deformation over 200 compression cycles, showing the excellent stability and elasticity of the PPy–PEG backbone. The high conductivity and mechanical stability of the as-prepared RGO@PPy–PEG foam suggest it as an exceptional candidate as an electrode for a wearable supercapacitor.
Capacitive performances of single electrodes
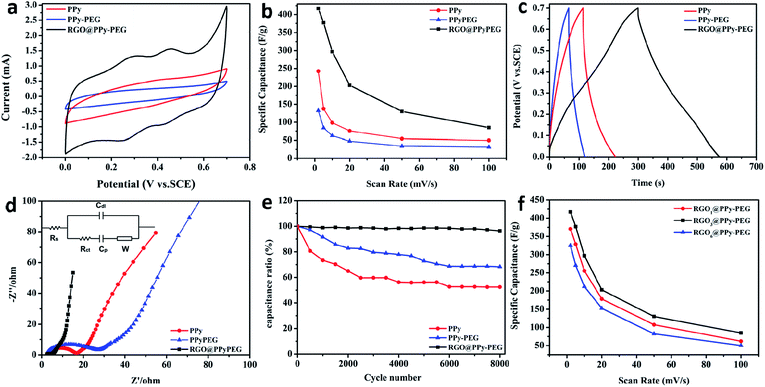
The electrochemical performance of the 3D PPy, PPy–PEG and RGO@PPy–PEG foams were evaluated in a three-electrode system using 1 M H2SO4 aqueous solution as electrolyte. It can be seen from the CV curves in Fig. 4a that RGO@PPy–PEG electrode shows a larger integrated area and distinct redox couples compared to the PPy and PPy–PEG samples, indicating both greater electrochemical double layer (EDL) capacitance and pseudocapacitive effects. We attribute this improvement in pseudocapacitance to the improved electrical conductivity due to the continuous RGO wrapping on PPy, allowing charge transport to and from the PPy enabling the redox reactions (doping/dedoping from the electrolyte solution) to occur. Meanwhile, the EDL capacitance of the RGO increases the overall capacitance of the RGO@PPy–PEG foam. In addition, it is not surprising that the PPy–PEG electrode shows a smaller CV area than the PPy sample due to the decreased electrical conductivity as we mentioned before. All the samples were tested at different CV scan rates (ESI Fig. S4†) and the calculated specific capacitance is presented in Fig. 4b. The highest specific capacitance for RGO@PPy–PEG reaches 415 F g−1 at scan rate of 2 mV s−1, much larger than PPy (248 F g−1) and PPy–PEG (130 F g−1) electrode. It is worth noting that in Fig. 4a, at low scan rates the CV curve of RGO@PPy–PEG electrode exhibits two pairs of redox peaks, (at 0.23/0.30 V for PPy and 0.40/0.48 V for PPy–PEG) due to the faradaic redox reaction of PPy and PPy–PEG, via doping/dedoping in the electrolyte solution. This phenomenon is consistent with similar phenomena reported previously.38,39 For example, Cristian Pirvu38 reported that for PPy and PPy–PEG thin films which were prepared by electrodeposition, the PPy and PPy–PEG thin film presents two sets of coupled peaks distributed between 0.15 to 0.25 V for PPy and 0.25/0.35 V for PPy–PEG films, which are as expected for anion insertion/repulsion due to a polymer film saturation with anions during polymerization. Priscilla G. L. Bakera39 reported that when PPy was introduced into polyamic acid by electropolymerization, this composite was observed to have two sets of coupled peaks with formal potential 0.099 V and 0.567 V respectively. However, with the increase of scan rates, the two pairs of redox peaks are gradually reduced, as shown in Fig. S4.† It can be ascribed to insufficient faradaic reactions (due to poor charge transport and electrical conductivity) in the electrode at high scan rate.The galvanostatic charge/discharge (GCD) curves are presented in Fig. 4c at a current density of 1 A g−1. The RGO@PPy–PEG curve shows a relatively symmetrical triangular shape and longest charging and discharging time, which is consistent with the trend from the CV curves. The specific capacitance for the hybrids at different current densities are calculated and listed in Table S1.† Electrochemical Impedance Spectroscopy (EIS) was also conducted to further analyse the electron transfer kinetics at PPy, PPy–PEG and RGO@PPy–PEG (Fig. 4d). The semicircle at high frequency of the Nyquist plots corresponds to the charge transfer resistance (Rct) and the linear portion at low frequency corresponds to diffusion limited processes.26 As shown in Fig. 4d, when compared with PPy and PPy–PEG, RGO@PPy–PEG has the smallest semicircle diameter, indicating the smallest charge transfer resistance and ion diffusion resistance. This lower resistance provides evidence of the better capacitive performance of the 3D RGO@PPy–PEG compared to PPy and PPy–PEG electrodes.
Cyclic stability is another principle for evaluating the supercapacitor performance (Fig. 4e). The long-term cyclic stability of 3D RGO@PPy–PEG foam was investigated by GCD measurements at a current density of 2.5 A g−1. After 8000 cycles, 3D RGO@PPy–PEG shows much higher capacitance retention rate (96%) compared with the PPy (58%) and PPy–PEG (70%). With the addition of PEG in PPy, the polyols serve as glue, strongly binding the components of the composites together, which leads to enhanced mechanical properties and capacitance cyclic stability.40 After coating with RGO nanosheets, the mechanical strength of the RGO@PPy–PEG was notably improved (compared to PPy–PEG) due to the π–π interactions between materials, leading to better long-term cyclic stability. The electrochemical performance of RGO@PPy–PEG electrodes were also optimized by varying the coating GO concentration from 1 mg mL−1 to 6 mg mL−1. As shown in Fig. 4f, the capacitance of RGO@PPy–PEG electrodes increased from 1 mg mL−1 GO to 3 mg mL−1 GO, yet decreased when the GO concentration was further increased to 6 mg mL−1. The heavy loading of RGO may lead to the strong agglomeration and restacking of graphene, which decreases both graphene conductivity, and block access to the highly electrochemically active PPy (mass transport), thereby impeding capacitive property.26 Comparative results of the capacitive performances of this 3D RGO@PPy–PEG electrode as well as other PPy-based electrodes are listed in Table 2. The specific capacitance and capacitance retention of the as-prepared electrode were either comparable with or higher than those provided by other PPy-based electrodes.
| Materials | Electrolyte | Specific capacitance (F g−1) | Capacitance retention (%) | Reference |
|---|---|---|---|---|
| PPy/GO | 1 M H2SO4 | 233 (1 A g−1) | 91.2 (100 mV s−1 4000 cycles) | 41 |
| GN/AC/PPy | 1 M H2SO4 | 178 (0.5 mA cm−2) | 64.4 (3 mA cm−2, 5000 cycles) | 42 |
| rGO/PPy/PANI | 0.5 M Na2SO4 | 308 (1 A g−1) | 86 (20 mV s−1, 500 cycles) | 43 |
| PPy/CNT-CC | 0.5 M H2SO4 | 486.1 (1.25 A g−1) | 82 (8 A g−1, 10![[thin space (1/6-em)]](https://www.rsc.org/images/entities/char_2009.gif) 000 cycles) 000 cycles) |
44 |
| GrPPyN | 1 M KCl | 466 (10 mV s−1) | 85 (10 mV s−1, 600 cycles) | 45 |
| RGO@PPy–PEG | 1 M H2SO4 | 412 (1 A g−1) | 96 (2.5 A g−1, 8000 cycles) | This work |
Capacitive performances of the device
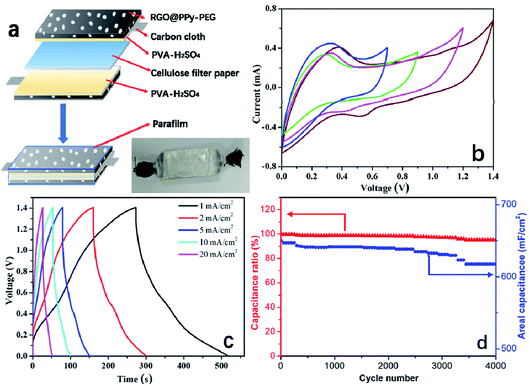
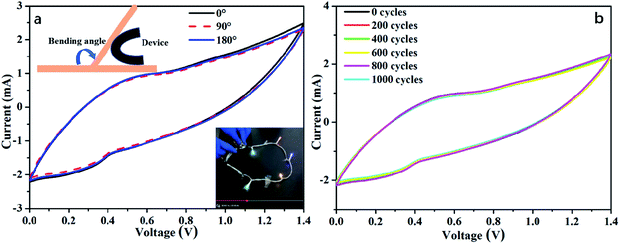
To examine the practical application of the as-prepared RGO@PPy–PEG electrodes for flexible supercapacitors, a symmetric all-solid-state supercapacitor device was fabricated from two opposing RGO@PPy–PEG electrodes, a piece of cellulose filter paper as the separator, and PVA–H2SO4 gel as the electrolyte as shown in Fig. 5a. Fig. 5b shows the CV curves of the device with varying voltage windows ranging from 0.0–0.7 to 0.0–1.4 V at a scan rate of 2 mV s−1. The square shape and obvious redox peaks were observed in all CV curves, indicating that the voltage window can be increased from 0.7 to 1.4 V in the supercapacitor device. The similar and symmetric shape of CV diagrams at different scan rates (Fig. S5†) suggest good capacitive behaviour and rate capability of this supercapacitor. From the CV curve, a calculated specific capacitance as high as of 1019 mF cm−2 was obtained at a scan rate of 2 mV s−1. The GCD of supercapacitor presented in Fig. 5c is consistent with the CV results, showing highly symmetric charge and discharge behaviour, with the capacitance reaching 714 mF cm−2 at a current density of 1 mA cm−2. Meanwhile, the device shows good long-term cycle life with 95% capacitance retention after 4000 cycles of GCD test at a high current density of 10 mA cm−2 (Fig. 5d).For practical reasons, it is imperative to test the device for as a wearable device, thus the performance of the fabricated supercapacitor device was tested while the device was fixed onto a wrist. The as-worn device (consisting of 3 series-connected devices) was charged to 3 V, and can subsequently light up five LED string lights (the operating voltage is 3.0 V, power is 0.06 W, ESI Movie S1†) with no change in brightness of the LED lights with wrist rotation. The all-solid-state supercapacitor exhibited excellent flexibility and stability when bent at 180° and twisted at different angles as demonstrated in ESI Movie S2 and S3.† Further, the CVs of the device were recorded at different bending angles as shown in Fig. 6a. The CV curves almost completely overlap, reflecting a remarkable flexibility of the supercapacitor. As can be clearly seen in Fig. 6b, the CV performances of the supercapacitor after 1000 bending cycles of 180° is similar to that of its initial state. These results show the high flexibility and excellent stability of the stacked device, which has great potential to be integrated into wearable electronic devices.
Conclusions
In summary, we have developed a high capacitance, flexible, durable, and wearable 3D RGO@PPy–PEG based all-solid-state supercapacitor. The 3D RGO@PPy–PEG foam was fabricated by electrodeposition of PPy–PEG on a sacrificial nickel template and subsequent RGO wrapping process, and exhibits excellent flexibility, high capacitance and exceptional cyclic stability. The 3D RGO@PPy–PEG foam exhibits distinctly improved specific capacitance (from 248 F g−1 to 415 F g−1) and better cycle life (from 58% to 96% capacitance retention after 8000 cycles) compared to a bare PPy foam. In addition, by utilizing the exceptional flexibility and electrochemical performance of our device, three series-connected 3D RGO@PPy–PEG based all-solid supercapacitors can be fixed on the wrist and light up five LED string lights. These results suggest the great potential of this 3D RGO@PPy–PEG foam in energy storage devices and flexible electronic devices.Conflicts of interest
There are no conflicts to declare.Acknowledgements
The authors are grateful to Natural Science Fund of Jiangsu Province (BK2018485), Lianyungang “521” talent project (LYG52105-2018038), the Priority Academic Program development of Jiangsu Higher Education Institutions and Innovation Fund of Huaihai Institute of Technology (Z2016003), Innovation Fund of University Student and Postgraduate Research &Practice Innovation Program of Jiangsu Province (KXCY19-2259), Australian Research Council (DP170102320). The authors would like to thank the Australian national Fabrication Facility – Materials Node and the UOW Electron Microscopy Centre for equipment access.Notes and references
- J. Kim, J. Yin, X. Xuan and J. Y. Park, Micro and Nano Systems Letters, 2019, 7, 4 CrossRef.
- Y. Li and C. Chen, J. Mater. Sci., 2017, 52, 12348 CrossRef CAS.
- Y. Huang, Z. Tang, Z. Liu, J. Wei, H. Hu and C. Zhi, Nano-Micro Lett., 2018, 10, 38 CrossRef.
- T. G. Yun, M. Park, D. H. Kim, D. Kim, J. Y. Cheong, J. G. Bae, S. M. Han and I. D. Kim, ACS Nano, 2019, 13, 3141 CrossRef CAS.
- T. Chen, H. Peng, M. Durstock and L. Dai, Sci. Rep., 2014, 4, 3612 CrossRef.
- K. Sun, F. Ran, G. Zhao, Y. Zhu, Y. Zheng, M. Ma, X. Zheng, G. Ma and Z. Lei, RSC Adv., 2016, 6, 55225 RSC.
- M. Hosseinian, G. N. Darzi and A. Rahimpour, Electroanalysis, 2019, 31, 2530 CrossRef CAS.
- J. Mao, C. Liu, C. Cheng, W. Zhang, X. Z. Liao, J. Wang, L. Li, X. Yang, Y. S. He and Z. F. Ma, ChemElectroChem, 2019, 6, 5479 CrossRef CAS.
- S. V. Ebadi, D. Semnani, H. Fashandi and B. Rezaei, Sens. Actuators, B, 2019, 297, 126736 CrossRef CAS.
- J. Y. Oh, S. Rondeau-Gagne, Y. C. Chiu, A. Chortos, F. Lissel, G. N. Wang, B. C. Schroeder, T. Kurosawa, J. Lopez, T. Katsumata, J. Xu, C. Zhu, X. Gu, W. G. Bae, Y. Kim, L. Jin, J. W. Chung, J. B. Tok and Z. Bao, Nature, 2016, 539, 411 CrossRef CAS.
- T. Liu, L. Finn, M. Yu, H. Wang, T. Zhai, X. Lu, Y. Tong and Y. Li, Nano Lett., 2014, 14, 2522 CrossRef CAS.
- S. Yang, X. Li, H. Li and P. Yao, Synth. Met., 2018, 242, 83 CrossRef CAS.
- M. Ma, L. Guo, D. G. Anderson and R. Langer, Science, 2013, 339, 186 CrossRef CAS.
- S. V. Ebadi, D. Semnani, H. Fashandi and B. Rezaei, Polym. Adv. Technol., 2019, 30, 2261 CrossRef CAS.
- C. Lin, B. Hwang and C. Lee, Mater. Chem. Phys., 1998, 55, 139 CrossRef CAS.
- S. Korkmaz and İ. A. Kariper, J. Energy Storage, 2020, 27, 101038 CrossRef.
- S. S. Jayaseelan, S. Radhakrishnan, B. Saravanakumar, M.-K. Seo, M.-S. Khil, H.-Y. Kim and B.-S. Kim, Colloids Surf., A, 2018, 538, 451 CrossRef CAS.
- J. Liu, D. Jia, J. M. Gardner, E. M. J. Johansson and X. Zhang, Mater. Today Energy, 2019, 13, 152 CrossRef.
- Y. Myung, S. Jung, T. T. Tung, K. M. Tripathi and T. Kim, ACS Sustainable Chem. Eng., 2019, 7, 3772 CrossRef CAS.
- K. Hori, K. Hasegawa, T. Momma and S. Noda, J. Phys. Chem. C, 2019, 123, 3951 CrossRef CAS.
- J. Wang, F. Chen, Y. Jin and Y. Lei, ACS Appl. Mater. Interfaces, 2018, 10, 6276 CrossRef CAS.
- M. Wang, Q. Wang, W. Zhu, Y. Yang, H. Zhou, F. Zhang, L. Zhou, J. M. Razal, G. G. Wallace and J. Chen, Green Energy Environ., 2017, 2, 285 CrossRef.
- W. S. Hummers Jr and R. E. Offeman, J. Am. Chem. Soc., 1958, 80, 1339 CrossRef.
- Y. Meng, L. Zhang, R. Xing, H. Huang, Y. Qu, T. Jiao, J. Zhou and Q. Peng, Colloids Surf., A, 2018, 555, 787 CrossRef CAS.
- S. Xing and G. Zhao, J. Appl. Polym. Sci., 2007, 104, 1987 CrossRef CAS.
- M. Y. Wang, W. Zhu, L. Ma, J. J. Ma, D. E. Zhang, Z. W. Tong and J. Chen, Biosens. Bioelectron., 2016, 78, 259 CrossRef CAS.
- Z. Cao, H. Mao, X. Guo, D. Sun, Z. Sun, B. Wang, Y. Zhang and X.-M. Song, ACS Sustainable Chem. Eng., 2018, 6, 15570 CrossRef CAS.
- L. M. Yee, H. N. M. E. Mahmud, A. Kassim and W. M. M. Yunus, Synth. Met., 2007, 157, 386 CrossRef CAS.
- Y. Wang, J. Yang, L. Wang, K. Du, Q. Yin and Q. Yin, ACS Appl. Mater. Interfaces, 2017, 9, 20124 CrossRef CAS.
- H. Rasouli, L. Naji and M. G. Hosseini, New J. Chem., 2018, 42, 12104 RSC.
- Q. Chen, X. Wang, F. Chen, N. Zhang and M. Ma, Chem. Eng. J., 2019, 368, 933 CrossRef CAS.
- X. Chen, J. Chen, F. Meng, L. Shan, M. Jiang, X. Xu, J. Lu, Y. Wang and Z. Zhou, Compos. Sci. Technol., 2016, 127, 71 CrossRef CAS.
- W. Liu, Y. Fang, P. Xu, Y. Lin, X. Yin, G. Tang and M. He, ACS Appl. Mater. Interfaces, 2014, 6, 16249 CrossRef CAS.
- L. Jiang, J. A. Syed, G. Zhang, Y. Ma, J. Ma, H. Lu and X. Meng, J. Ind. Eng. Chem., 2019, 80, 497 CrossRef CAS.
- L. Yan, Z. Xu and N. Deng, Prog. Org. Coat., 2019, 135, 123 CrossRef CAS.
- Z. Yupeng, L. Delong, T. Xiaojian, Z. Bin, R. Xuefeng, L. Huijun, P. Chunxu, L. Lei, Z. Tianyou, B. Yoshio, C. Shanshan, C. Weiwei and S. R. Rodney, Carbon, 2013, 54, 143 CrossRef.
- M. Lu, L. Meng, X. Junmin and W. John, RSC Adv., 2016, 6, 2951 RSC.
- P. Cristian, M. C. Claudiu, S. B. Andrei and D. Ioana, Electrochim. Acta, 2011, 56, 9893 CrossRef.
- H. H. Euodia, W. Tesfaye, S. A. Omowunmi, I. I. Emmanuel and B. G. L. Priscilla, Electrochim. Acta, 2014, 128, 439 CrossRef.
- Y. He, Y. Yang, X. Ji, Q. Zhang, T. Jiang, H. Shi, S. Luan, R. K. Y. Li and D. Shi, J. Membr. Sci., 2019, 572, 358 CrossRef CAS.
- W. Wu, L. Yang, S. Chen, Y. Shao, L. Jing, G. Zhao and H. Wei, RSC Adv., 2015, 5, 91645 RSC.
- L. Xu, M. Jia, Y. Li, S. Zhang and X. Jin, RSC Adv., 2017, 7, 31342 RSC.
- B. Liang, Z. Qin, T. Li, Z. Dou, F. Zeng, Y. Cai, M. Zhu and Z. Zhou, Electrochim. Acta, 2015, 177, 335 CrossRef CAS.
- Y. Yesi, I. Shown, A. Ganguly, T. T. Ngo, L. C. Chen and K. H. Chen, Chemsuschem, 2016, 9, 370 CrossRef CAS.
- S. Sahoo, S. Dhibar, G. Hatui, P. Bhattacharya and C. K. Das, Polymer, 2013, 54, 1033 CrossRef CAS.
Footnote |
| † Electronic supplementary information (ESI) available: Table S1 the specific capacitance for the hybrids at different current densities, Fig. S1–S5 and Movie S1–S3 exhibited excellent flexibility and stability of the fabricated supercapacitor device. See DOI: 10.1039/d0ra05199c |
| This journal is © The Royal Society of Chemistry 2020 |


