DOI:
10.1039/D0RA06273A
(Paper)
RSC Adv., 2020,
10, 31348-31354
Temperature-dependent changes in the molecular orientation and visible color of phthalocyanine films†
Received
19th July 2020
, Accepted 10th August 2020
First published on 24th August 2020
Abstract
A simple phthalocyanine zinc complex exhibits a visible color change in response to weak external stimuli, i.e., changes in solvent and temperature. Its chromism was attributed to its controlled aggregation via weak interactions between the central metal and peripheral oxygen atoms. In solution, intense absorption and fluorescence bands appeared in both the longer-wavelength and NIR region in non-coordinating solvents, while a simple sharp Q band was observed in coordinating solvents. Variable-temperature absorption spectra and fluorescence lifetime measurements were used to characterize the aggregation-induced absorption and emission in non-coordinating solvents. A selective aggregation–disaggregation process was also observed in thin films of this phthalocyanine zinc complex, and the optical properties of the film depend on the annealing temperature. The changes in the NIR region lead to a sizable visible color change that is recognizable by the naked human eye. The temperature-dependent control of the aggregation process in the thin film was confirmed using operando spectroscopy techniques.
Introduction
Temperature is one of the most important analytical parameters in all areas of science. Although thermocouples can measure the temperatures of various substances, thermo-responsive (thermochromic) materials have also been the subject of intensive research, particularly in materials1 and biological sciences.2 Organic materials have tunable structures and can be tailored to exhibit versatile functionalities using precise synthetic methods. This characteristic makes them suitable for applications as stimuli-responsive chromic materials.3 However, most organic compounds melt or decompose at temperatures above 200 °C; thus, even though high-temperature thermochromic organic materials are very desirable, they remain limited.4 To achieve sensing at high temperature, ‘robustness’, i.e., the ability to avoid decomposition under heating, and ‘flexibility’, i.e., the ability to exhibit different physical properties at different temperatures, should be combined. Phthalocyanines (Pcs) are well-known functional organic materials with high robustness and diversity.5 Typical Pcs are stable above 200 °C, and their phase transitions have been studied extensively.6 However, their chromic responses are usually modest, and the naked human eye cannot register the temperature-dependent color changes.
Herein, we report the aggregation-induced chromic responses of bespoke Pcs to external stimuli, i.e., changes in solvents and temperatures. The aggregation of dye molecules plays an important role in changing their optical properties. Explaining their molecular orientation is important for predicting the spectral changes due to aggregation. Head-to-tail assembly (J-type aggregation) is known to result in red-shifted peaks;7 thus, the selective formation of J-type aggregates is required to harvest NIR light.8–11 We anticipated that peripheral heteroatoms (X = e.g. O or S) in Pcs could be used to tune their optical properties and their aggregation properties (Fig. 1a). Pc is a rigid square-planar ligand, and various metal complexes of Pc have been synthesized. Several of these metal complexes (M = e.g. Zn or Mg) can coordinate an extra ligand to give a five-coordinated metal center.12,13 If intermolecular M–X (central-to-peripheral) coordination occurs, selective J-aggregation can be realized by the simple Pc structure. Based on this concept, we developed the molecular design principle shown in Fig. 1b. Oxygen atoms were chosen as peripheral substituents at the α-positions because the Q band of such Pcs appears at the border between the visible and NIR regions (∼700 nm).14 The naked human eye cannot perceive this NIR absorption band; thus, a small chromic change could induce a significant visible color change. We have previously reported unique visible-color changes via solvatochromic behavior in the NIR region,15 as have other groups.16 The steric bulk of the substituents is also important to their aggregation, i.e., the substituents on the oxygen atoms may be able to control the aggregation via steric effects. Prior to any practical experimental considerations, the stabilization energy of M–X coordination was calculated to evaluate this hypothesis. The total electron energies of a model Pc zinc complex (1′(Monomer)) and its Zn–O coordinated dimer (1′(Dimer)), which serves as a model of the aggregated state, were compared using density functional theory (DFT) calculations. The energy of 1′(Dimer) was 16.1 kcal mol−1 lower than that of two 1′(Monomer) units, indicating that aggregation via Zn–O coordination is thermodynamically favorable (Fig. S1†). This result motivated us to use the aggregation properties of Pcs for temperature sensing. We also expected that this design could be suitable to produce temperature-responsive thin films. Aggregation–disaggregation processes can be induced by thermal vibrations. And although molecular vibrations are relatively restricted in thin films, we anticipated that the weak M–X coordination could be dissociated in the thin film by heating.
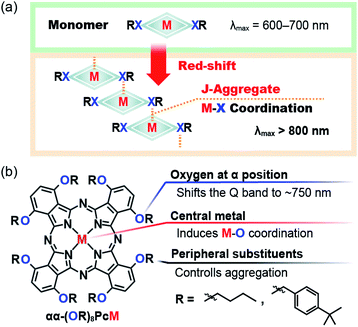 |
| | Fig. 1 (a) Design concept of M–X coordination-induced phthalocyanine aggregation. (b) Molecular design of chromic phthalocyanines with aggregation induced by external stimuli. | |
Experimental details
Materials
Unless otherwise noted, solvents and reagents were purchased from Tokyo Kasei Co. and Wako Chemicals Co. and used after appropriate purification (distillation or recrystallization). 3,6-Disubstituted phthalonitriles were prepared according to literature procedures.17,18
Synthesis of Pcs
Synthesis of α-butoxy-substituted phthalocyanine free-base complex (3). Lithium metal (119 mg, 17 mmol) was added to butanol (7 mL) and stirred for 30 min under reflux to afford a solution of lithium butoxide. Then, 3,6-dibutoxyphthalonitrile (857 mg, 3.1 mmol) was added to the solution and stirring under reflux was continued for 3 h. After concentrating the mixture, the residue was dissolved in chloroform and washed with 2 N HCl (aq), water, and brine. The organic layer was dried over Na2SO4, filtered, and concentrated in vacuo. The mixture was purified by column chromatography on silica gel (CHCl3/methanol = 30/1 v/v) to afford the title compound as a dark green powder after washing with methanol (521 mg, 61%). 500 MHz 1H NMR (CDCl3) δ (ppm): 7.59 (s, 8H), 4.84 (t, 16H, J = 7.5 Hz), 2.26–2.17 (m, 16H), 1.70–1.62 (m, 16H), 1.08 (t, 24H, J = 7.5 Hz). IR νmax/cm−1 (KBr): 2955, 2870, 1597, 1501, 1462, 1377, 1269, 1223, 1184, 1038, 964, 883, 721. UV-vis (THF) λmax nm (ε × 10−4): 762 (9.0), 738 sh (7.6), 673 sh (2.3), 328 (4.1).
Synthesis of α-(4-tert-butylbenzyloxy)-substituted phthalocyanine free-base complex (5)18. The procedure described for 3 was performed using 3,6-(4-tert-butylbenzyloxy)phthalonitrile to give the title compound as a green powder (33%). 500 MHz 1H NMR (CD2Cl2) δ (ppm): 7.60 (d, 16H, J = 8.2 Hz), 7.40 (s, 8H), 7.30 (d, 16H, J = 8.4 Hz), 5.78 (s, 16H), 1.24 (s, 72H). UV-vis (THF) λmax nm (ε × 10−4): 766 (9.3), 753 sh (8.7), 677 (2.8), 330 (5.1).
Synthesis of α-butoxy substituted phthalocyanine zinc complex (1)16. A mixture of 3 (254 mg, 0.23 mmol) and Zn(OAc)2·2H2O (149 mg, 0.68 mmol) in DMSO (6 mL) was stirred for 4 h at 100 °C. After concentrating the mixture, the residue was dissolved in chloroform and washed with water and brine. The organic layer was dried over Na2SO4, filtered, and concentrated in vacuo. The mixture was purified by column chromatography on silica gel (CHCl3/methanol = 10/1 v/v) to afford the title compound as a dark red powder after washing with hexane (258 mg, 96%). 500 MHz 1H NMR (pyridine-d5) δ (ppm): 7.89 (s, 8H), 5.13 (t, 16H, J = 7.1 Hz), 2.32–2.26 (m, 16H), 1.75–1.68 (m, 16H), 1.01 (t, 24H, J = 7.4 Hz). IR νmax/cm−1 (KBr): 2959, 2870, 1728, 1597, 1497, 1466, 1377, 1308, 1269, 1200, 1065, 945, 899, 810, 737. UV-vis (THF) λmax nm (ε × 10−4): 734 (1.7), 659 (0.35), 326 (0.45).
Synthesis of α-butoxy substituted phthalocyanine titanium complex (2)19. A mixture of 3 (141 mg, 0.13 mmol) and Ti(OEt)4 (0.413 mg, 1.8 mmol) in DMF (5 mL) was stirred for 1 h at 130 °C. After concentrating the mixture, the residue was dissolved in ethyl acetate and washed with water and brine. The organic layer was dried over Na2SO4, filtered, and concentrated in vacuo. The mixture was purified by column chromatography on silica gel (CHCl3/methanol = 40/1 v/v) to afford the title compound as a dark red powder after washing with ethyl acetate (94.3 mg, 63%). 500 MHz 1H NMR (CDCl3) δ (ppm): 7.69 (s, 8H), 5.00–4.95 (m, 8H), 4.88–4.84 (m, 8H), 2.26–2.20 (m, 16H), 1.71–1.66 (m, 16H), 1.09 (t, 24H, J = 7.4 Hz). IR νmax/cm−1 (KBr): 2959, 2870, 2542, 1597, 1501, 1466, 1377, 1304, 1269, 1207, 1150, 1123, 1061, 964, 910, 814, 748.UV-vis (THF) λmax nm (ε × 10−4): 778 (8.3), 695 sh (1.8), 466 sh (0.58), 336 (2.9).
Synthesis of α-(4-tert-butylbenzyloxy)-substituted phthalocyanine zinc complex (4). The procedure described for 1 was used with 5 to give the title compound as a green powder (73%). 500 MHz 1H NMR (pyridine-d5) δ (ppm): 7.88 (d, 16H, J = 5.8 Hz), 7.58 (s, 8H), 7.37 (d, 16H, J = 5.8 Hz), 6.13 (s, 16H), 1.21 (s, 72H). IR νmax/cm−1 (KBr): 3963, 2870, 1732, 1597, 1497, 1474, 1366, 1269, 1231, 1200, 1096, 1061, 1018, 899, 818, 729. UV-vis (THF) λmax nm (ε × 10−4): 737 (1.6), 661 (0.35), 328 (0.47).HR-MALDI-FT-ICR-MS calcd for C120H129N8O8Zn [M + H]+: 1874.9253, found 1874.9257.
Preparation of thin films
A solution of the Pc complex in CH2Cl2 (10 mg mL−1) was spin-coated onto the appropriate substrate (glass or Au) at 2000 rpm for 30 s and subsequently annealed at the desired temperature for 30 min.
UV-visible-NIR-absorption measurements
Electronic absorption spectra were recorded using a JASCO V-570 spectrophotometer and dilute solutions (5.0 × 10⁻⁶ M). The reflection spectra of solid and thin-film samples were recorded using an ISN-470 integrating sphere.
Emission measurements
Fluorescence spectra were obtained using a HITACHI F-4500 spectrofluorometer. Fluorescence quantum yields were measured using cardiogreen (ΦF = 0.13 in DMSO) as a standard.20 Time-resolved photoluminescence lifetime measurements were carried out using a time-correlated single photon counting lifetime spectroscopy system (Quantaurus-Tau C11367-22, Hamamatsu photonics). The decay constants and fitting parameters for the transient decays were determined using the software embedded in the Quantaurus-Tau system.
Powder X-ray diffraction (PXRD) analysis
PXRD data were collected using a Rigaku SmartLab diffractometer system with a CuKα source.
Infrared (IR) measurements
IR spectra of 1 in powder form were recorded with a Shimadzu FTIR-8300 using the KBr method. The molecular orientation was measured in situ via polarized infrared reflection absorption spectroscopy (IR-RAS) measurements using a Fourier transform infrared (FT-IR) device (FT/IR 6300, JASCO). The infrared light generated by the FT-IR device was p-polarized and reflected at the substrate surface at a glancing angle of ∼80° relative to the perpendicular of the substrate surface in a vacuum chamber. All spectra were collected using the FT-IR spectrometer equipped with a N2-cooled mercury cadmium telluride detector. Each spectrum represents an average of 1024 scans obtained at a resolution of 4 cm−1.
Optical waveguide measurements
Phthalocyanine thin films were prepared on a quartz waveguide (960016, System Instruments Co., Ltd.). The UV-vis-NIR attenuated total reflection (ATR) spectra of the thin films were recorded using a SIS-5100 (System Instruments Co., Ltd.) using p- and s-polarized light.
Theoretical calculations
The model complexes 1′(Monomer) and 1′(Dimer), in which the butoxy substituents were replaced with methoxy groups, were used in the interest of simplicity. Geometry optimization of all the molecules was performed using the hybrid Becke3LYP21–24 (B3LYP) functional as implemented in Gaussian 2009.25 The 6-31G(d) basis set was used for all atoms. After the geometry optimization, vibrational calculations employing the same level of theory were performed to predict the IR spectrum. All stationary points were optimized without any symmetry assumptions and characterized by normal coordinate analysis at the same level of theory (the number of imaginary frequencies, Nimag, was 0). The cartesian coordinates and total electron energies from the output files are provided in the ESI.†
Results and discussion
Synthesis
Fig. 2 and Scheme S1† shows the chemical structures and synthetic procedures of the Pcs examined in this work. 1,2-Dicyanobenzene derivatives (phthalonitriles) are well-established Pc precursors. The so-called lithium method using lithium alkoxides is a typical procedure to synthesize free-base Pcs from phthalonitriles.26 After the free-base Pcs 3 and 5 were prepared, the corresponding zinc (1 and 4) and titanium (2) complexes were obtained from the corresponding free-base Pcs under typical metalation conditions. All Pcs displayed excellent solubility in common organic solvents and were fully characterized by NMR spectroscopy.
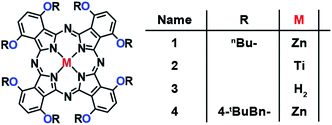 |
| | Fig. 2 Chemical structures of the α-oxy-substituted phthalocyanines in this work. | |
Solvatochromic effects
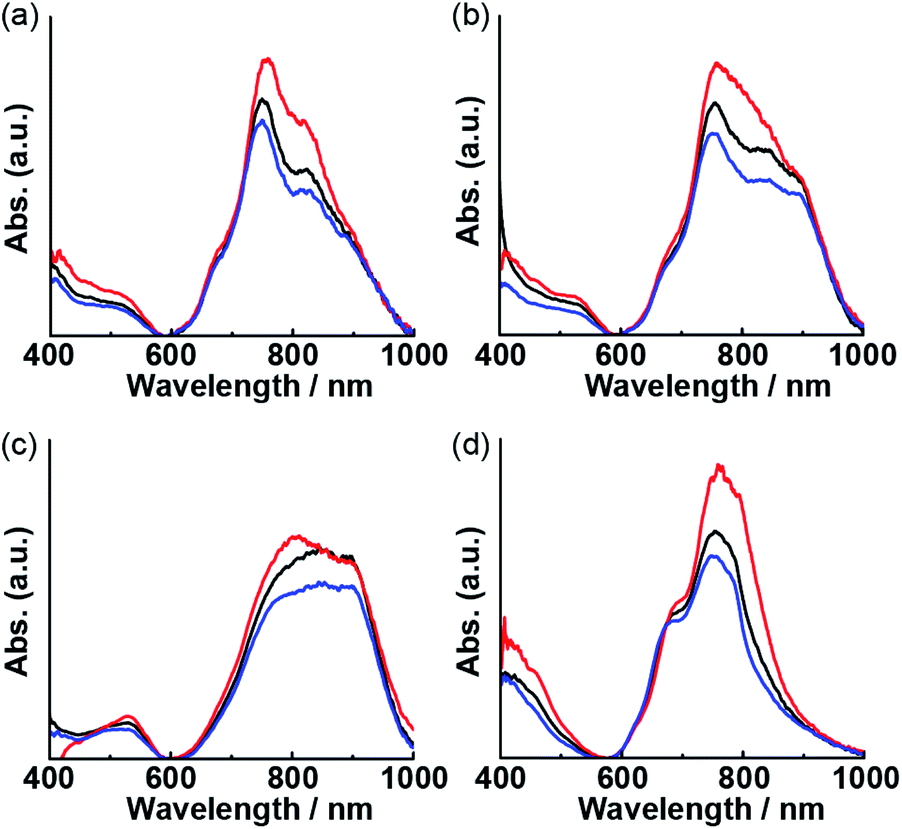
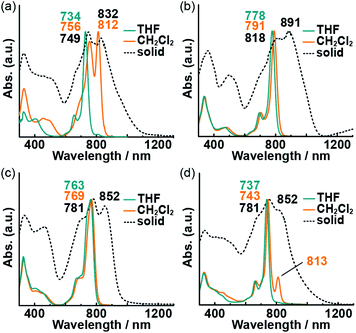
The highly planar Pc macrocycle can experience face-to-face (H aggregation) or head-to-tail (J aggregation) aggregation in noncoordinating solvents. These aggregation behavior produces different solvatochromic responses. The absorption spectra of the Pcs in dilute THF solution (coordinating solvent), CH2Cl2 solution (noncoordinating solvent), and the powder state are shown in Fig. 3; spectra in other, additional solvents are provided in Fig. S2.† The presence of sharp and intense Q bands indicates the absence of aggregation in the dilute THF solutions. The Q00 band of free-base 3 might be split theoretically into two peaks, but they showed only broadened on peak. It is considered that the splitting of the Q00 band is so small that the superimposition of Qx and Qy bands. The absorption spectra of the powder-state Pcs indicated the occurrence of aggregation. Two intense absorption bands were observed in the visible-to-NIR (700–900 nm) region for all the Pcs. The shorter-wavelength bands were assigned to the monomeric state, whereas the longer-wavelength ones were assigned to the aggregated state. Although changing the central element or the substituent on the oxygen atoms had only a small effect on the spectra of the dilute Pc solutions in THF, 1 exhibited significant solvatochromism in CH2Cl2 solution with an intense absorption band at 812 nm. In other noncoordinating solutions of 1, a longer-wavelength band was observed. The spectral changes of 1 correspond to a solvent-dependent visible color change (from red and yellow to green) that could be perceived by the naked eye (Fig. S3†). THF molecules can coordinate to the central zinc atoms of 1 and 4; the resulting five-coordinate zinc12 could hinder the subsequent aggregation of the Pc macrocycles. The aggregation of 4 in noncoordinating solvents was prevented by the bulky substituents on the oxygen atoms. Typical solvatochromic effects are caused by solvent polarity, while the spectral changes in 1–4 solutions did not depend on solvent polarities (Fig. S2†). Thus, the NIR band of 1 was assigned to J-aggregated species, and the combination of a central zinc atom and small alkyl chains on the oxygen substituents is crucial for the formation of aggregates.
 |
| | Fig. 3 UV-vis-NIR absorption spectra of 1 (a), 2 (b), 3 (c), and 4 (d) in solution (blue and orange lines) and in the powder state (black dotted lines). | |
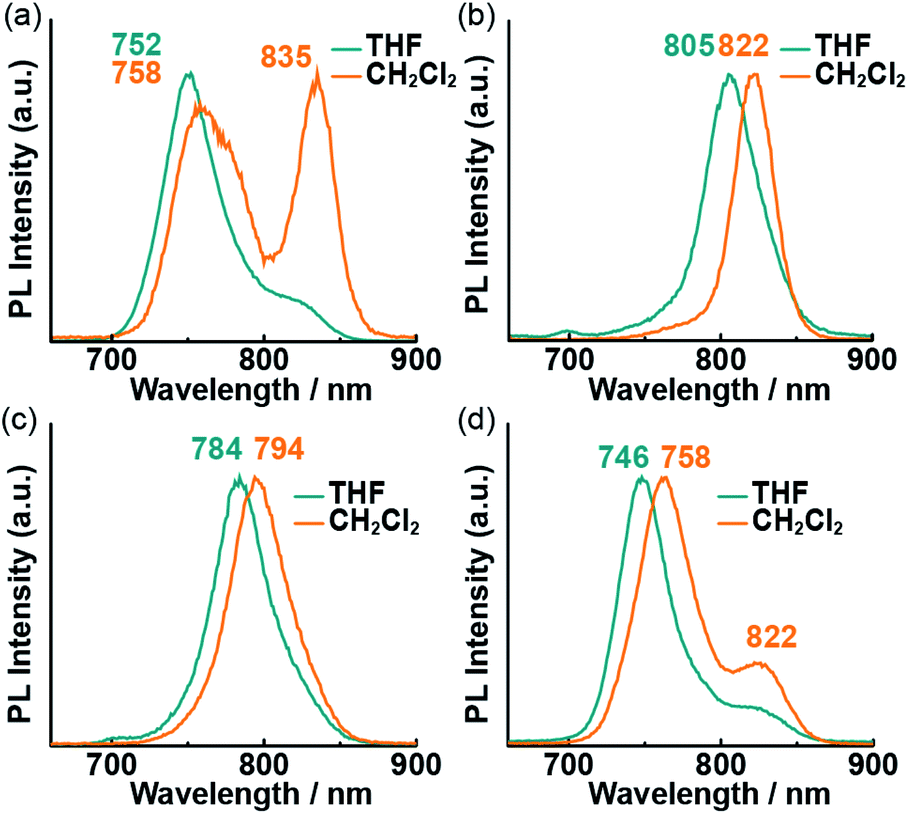
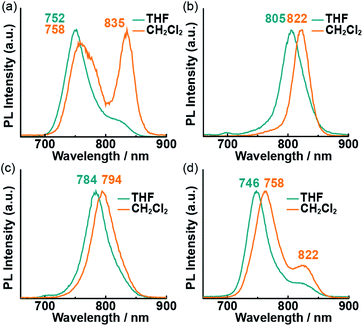
To obtain further insight into the excited states of the Pcs in solution, their fluorescence spectra in THF and CH2Cl2 were recorded (Fig. 4). The fluorescence peaks were obtained in the NIR region due to electron-donating oxygen atoms at α positions of Pcs.14 No fluorescence was observed in the powder state due to the severe aggregation of the Pcs. Typical sharp emission bands were observed in the NIR region, except in the case of 1 in CH2Cl2, which exhibited a weaker fluorescence intensity than the other solutions. The intensity of the longer-wavelength (835 nm) peak in this spectrum was higher than that of the shorter-wavelength (758 nm) peak. Fluorescence lifetime (τf) measurements were conducted to assign the fluorescence bands (Table 1). The lifetimes of 2–4 did not depend on the solvent or emission wavelength (τf = 1–2 ns), while those of 1 in CH2Cl2 did exhibit wavelength dependence. The lifetime of the band at 760 nm (τf = 1.47 ns) was longer than that of the band at 840 nm (τf = 0.74 ns). The different lifetimes indicate that at least two different species are present in solution. The emission wavelength/lifetime relationships are shown in Table S1;† the relative intensity of the shorter-lifetime band increased with increasing emission wavelength. The short lifetime supports the presence of fluorescent J-aggregates27 in the CH2Cl2 solution of 1. A weak shoulder was also observed at the longer-wavelength side of the main peak in the THF solution of 1 and the CH2Cl2 solution of 4. This shoulder was assigned to the simple vibrational structure of the emission, because the lifetime of these bands does not depend on the emission wavelength.
 |
| | Fig. 4 Fluorescence spectra of 1 (a), 2 (b), 3 (c), and 4 (d) in THF (blue lines) and CH2Cl2 (orange lines). Excitation wavelength (λex): 650 nm. | |
Table 1 Fluorescence parameters of 1–4 in THF and CH2Cl2a
| Compound |
Solvent |
ΦF |
τf/ns (λem/nm) |
| λex = 650 nm. |
| 1 |
THF |
0.50 |
1.74 (760) |
| CH2Cl2 |
0.03 |
1.47 (760) |
| 0.74 (840) |
| 2 |
THF |
0.10 |
1.61 (810) |
| CH2Cl2 |
0.03 |
1.56 (810) |
| 3 |
THF |
0.07 |
0.75 (790) |
| CH2Cl2 |
0.10 |
0.04 (790) |
| 4 |
THF |
0.40 |
1.89 (770) |
| CH2Cl2 |
0.06 |
1.76 (770) |
Powder and thin-film spectroscopy measurements
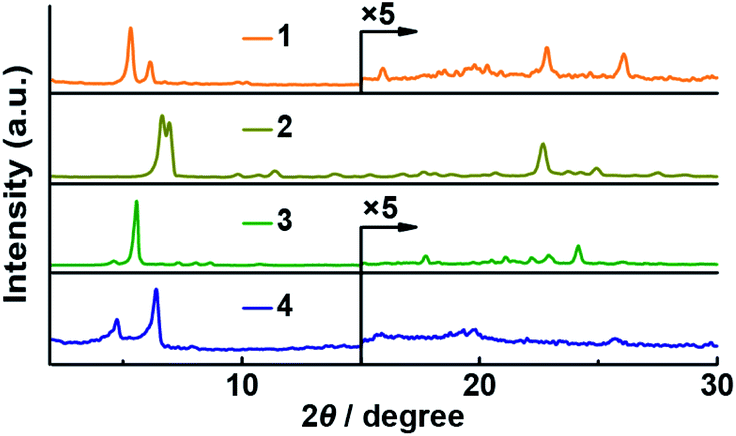
Although Pc 1 was designed to selectively form J-aggregates in solution, we also carried out PXRD analyses of the Pcs in order to determine their molecular orientations in the solid powder state (Fig. 5). A film of unsubstituted phthalocyanine titanium complex has previously been reported to show an ordered J-aggregate-type orientation;28 thus, the PXRD analysis of the α-butoxy substituted Pc titanium complex 2 was also carried out. A characteristic peak (2θ = 22.7°; d = 3.92 Å) was observed in the PXRD pattern of 2, indicating that the macrocycles of 2 are aligned in an orderly fashion. Two peaks (2θ = 22.8°; d = 3.89 Å and 2θ = 26.1°; d = 3.42 Å) appeared in a similar region for 1, while no intense peaks were obtained for 3 or 4. These interplanar distances are consistent with the Zn–O coordination distance (3.64 Å) of the optimized structure of 1′(Dimer).
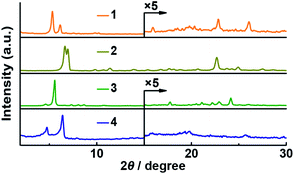 |
| | Fig. 5 Powder X-ray diffraction (PXRD) patterns of 1–4. | |
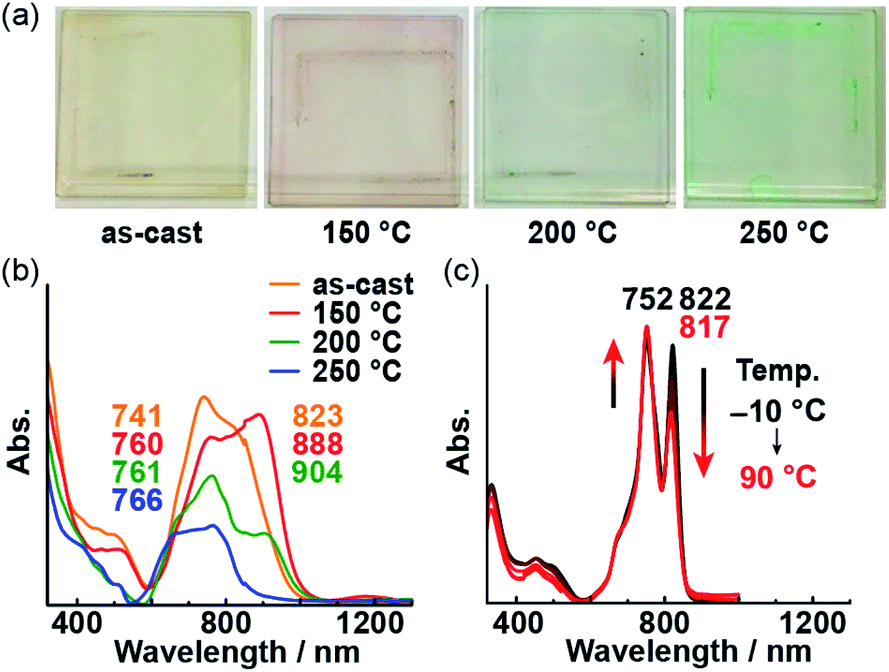
Then, we prepared a thin film of 1 on a glass substrate using a spin-coating technique. While the powder of 1 is dark red, the cast film is pale yellow; regardless, the absorption spectrum of the film is similar to that of the powder. After subjecting the film to 30 min of annealing, its color changed. Interestingly, the color after annealing depends on the annealing temperature (Fig. 6a), i.e., it changes from yellow to red to green upon increasing the annealing temperature from 150 to 250 °C. In the absorption spectra of the annealed films, the longer-wavelength band diminishes with increasing temperature, while the shorter-wavelength band becomes more intense (Fig. 6b). This type of temperature-dependent change in the absorption spectra was also observed in solution (Fig. 6c). The decrease in the longer-wavelength band (822 nm) with increasing temperature indicates the disaggregation of 1 due to greater molecular motion. THF was used to peel the annealed film off of the glass substrate, which resulted in partial dissolution of the film in THF. The spectrum of the solution was identical to the absorption spectrum of the THF solution of as-prepared 1, which suggests that 1 did not undergo any decomposition during annealing at 250 °C (Fig. S4†). The spectral changes observed for the thin film due to annealing paralleled those observed in solution at various temperatures, indicating the molecular orientation of 1 on the film changed upon heating.
 |
| | Fig. 6 (a) Photographs of thin films of 1 annealed at various temperatures. UV-vis-NIR absorption spectra of thin films of 1 (b) and an o-dichlorobenzene solution of 1 at various temperatures ([c] = 5.0 × 10⁻⁶ M) (c). | |
Operando spectroscopy measurements of thin films of 1
Based on the temperature-dependent spectroscopic changes of the thin film of 1, we attempted to rationalize the molecular orientation of the phthalocyanine macrocycles on the film using operando polarized optical waveguide spectroscopy and polarized IR-RAS.
Optical waveguide spectroscopy is a technique based on total internal reflection. When polarized incident light is used, the linear dichroism spectra provide information regarding the molecular orientation at the interface.29–31 According to previous studies, intense visible-to-NIR bands of Pcs are effective for determining their molecular orientation on thin film by polarized optical waveguide spectroscopy.32,33 Optical waveguide spectra of the thin film of 1 obtained using non-polarized, s-polarized, and p-polarized light at various temperatures are shown in Fig. 7. After heating the film, the changes in the waveguide spectra using non-polarized light paralleled those in the reflection spectra (Fig. 6b). The decrease in the intensity of the longer-wavelength band under heating indicated disaggregation. Using s-polarized light, a stronger absorption at 760 nm was observed. The ratio of the intensities of the spectra obtained using s- and p-polarized light decreased with increasing the annealing temperature from room temperature to 200 °C, indicating that monomers of 1 adopt a random orientation. Subsequently, the ratio increased when the temperature was further raised from 200 °C to 250 °C. The increasing s-polarized light ratio beyond 200 °C indicated that the orientation of monomeric 1 changed to perpendicular relative to the waveguide surface.
 |
| | Fig. 7 Optical waveguide spectra of thin films of 1 annealed at room temperature (a), 150 °C (b), 200 °C (c), and 250 °C (d) using non-polarized light (black lines), s-polarized light (red lines), and p-polarized light (blue lines). | |
IR-RAS is regarded as a useful method to evaluate the molecular orientation of thin films of phthalocyanines.34–37 Although the vibrational modes of unsubstituted phthalocyanine zinc complexes have been well-studied,38 it was necessary to assign the out-of-plane and in-plane vibrational modes of 1 before analyzing its spectra. For that purpose, we compared the experimental IR spectrum of KBr-dispersed 1 (as a model of the non-oriented state) and the theoretical (gas phase) spectrum of 1 obtained using DFT calculations (Fig. S5 and Table S2†). The theoretical spectrum reproduced the experimental one, allowing the peaks at 810 cm−1 and 1065 cm−1 to be assigned to the out-of-plane and in-plane vibrational modes, respectively. Fig. 8 shows the IR-RAS spectra of the thin film of 1 on an Au substrate after annealing at various temperatures; this substrate was used because the reflection peaks of the thin film on a glass substrate were too weak. The molecular orientation parameters are summarized in Table S3.† The UV-vis-NIR absorption spectrum of the thin film of 1 on an Au substrate demonstrated that the optical properties in the UV-vis-NIR region were not affected by the change of the substrate (Fig. S6†). The out-of-plane/in-plane vibrational peak intensity ratio changed with increasing annealing temperature. The trend in the spectral changes paralleled that of the polarized optical waveguide spectra in the UV-vis-NIR region. At 250 °C, the in-plane vibrational mode was enhanced, and the orientation parameter S was increased, indicating that annealing altered the molecular orientation of the Pc on the film. The change in the molecular orientation on the thin film affected the optical properties of the UV-vis-NIR region and induced a significant visible color change that could be detected by the naked human eye.
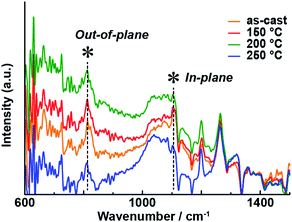 |
| | Fig. 8 IR-RAS spectra of 1 on a gold substrate for different annealing temperatures. | |
Conclusions
In summary, we have investigated the chromic responses of phthalocyanines functionalized with oxygen atoms at the α-position in response to solvent and temperature. Although the central-metal effect and the substituent effect of the groups on the oxygen atoms are weak in dilute THF solution, α-butoxy Pc zinc complex 1 in non-coordinating solvents shows a significant visible color change accompanied by spectral changes in the NIR region. A fluorescence lifetime analysis of 1 revealed that the selective J-aggregation mode of 1 induces an intense absorption band in the NIR region (>800 nm), which was not observed for the Pcs with other metals or substituents. Moreover, these spectral changes were also observed in the thin film of 1 upon increasing the annealing temperature of the film. Operando spectroscopy techniques (optical waveguide spectroscopy and IR-RAS) showed a dynamic change in the molecular orientation upon heating the film. Typical Pcs show high thermostability; however, the changes in their spectra upon heating are usually small. In our system, the ‘weak’ coordination-induced aggregation allows the molecular orientation to be changed even in the thin film. The fact that its solvatochromic behavior involves ‘invisible’ NIR properties is useful, as this leads to a visible-color change recognizable by the naked human eye in response to small external stimuli. Fine-tuning both the single-molecule optical properties and aggregation properties of Pcs thus allows the design of a thermochromic organic device with a wide (>200 °C) temperature range. The simplicity of the synthetic procedures of the Pcs can be expected to facilitate further screening of this type of compounds for practical applications.
Conflicts of interest
The authors declare no competing financial interest.
Acknowledgements
This work was partly supported by a JSPS KAKENHI grant (18K19071) and the Uehara Memorial Foundation. The authors thank the Nanotechnology Platform Program (Molecule and Material Synthesis) of the Ministry of Education, Culture, Sports, Science and Technology (MEXT) Japan for conducting mass spectrometry measurements (Dr Akio Miyazato at JAIST).
References
- J. Lin, M. Lai, L. Dou, C. S. Kley, H. Chen, F. Peng, J. Sun, D. Lu, S. A. Hawks, C. Xie, F. Cui, A. P. Alivisatos, D. T. Limmer and P. Yang, Nat. Mater., 2018, 17, 261–267 CrossRef CAS PubMed.
- K. Okabe, N. Inada, C. Gota, Y. Harada, T. Funatsu and S. Uchiyama, Nat. Commun., 2012, 3, 705 CrossRef PubMed.
- X.-d. Wang, O. S. Wolfbeis and R. J. Meier, Chem. Soc. Rev., 2013, 42, 7834–7869 RSC.
- J. Huo, Z. Hu, G. He, X. Hong, Z. Yang, S. Luo, X. Ye, Y. Li, Y. Zhang, M. Zhang, H. Chen, T. Fan, Y. Zhang, B. Xiong, Z. Wang, Z. Zhu and D. Chen, Appl. Surf. Sci., 2017, 423, 951–956 CrossRef CAS.
- T. Fukuda and N. Kobayashi, in Handbook of Porphyrin Science, ed. K. M. Kadish, K. M. Smith and R. Guilard, World Scientific, Singapore, 2010, vol. 9, pp. 1–650 Search PubMed.
- T. Saito, Y. Iwakabe, T. Kobayashi, S. Suzuki and T. Iwayanagi, J. Phys. Chem., 1994, 98, 2726–2728 CrossRef CAS.
- M. Kasha, H. R. Rawls and M. Ashraf El-Baoumi, Pure Appl. Chem., 1965, 11, 371–392 CAS.
- H. Isago, Chem. Commun., 2003, 1864–1865 RSC.
- K. Cai, J. Xie and D. Zhao, J. Am. Chem. Soc., 2014, 136, 28–31 CrossRef CAS PubMed.
- Z. Chen, Y. Liu, W. Wagner, V. Stepanenko, X. Ren, S. Ogi and F. Würthner, Angew. Chem., Int. Ed., 2017, 56, 5729–5733 CrossRef CAS PubMed.
- M. Morisue, I. Ueno, K. Muraoka, S. Omagari, T. Nakanishi, Y. Hasegawa, T. Hikima and S. Sasaki, Chem.–Eur. J., 2019, 25, 7322–7329 CrossRef CAS PubMed.
- L.-Y. Cui, J. Yang, Q. Fu, B.-Z. Zhao, L. Tian and H.-L. Yu, J. Mol. Struct., 2007, 827, 149–154 CrossRef CAS.
- C. S. Velázquez, G. A. Fox, W. E. Broderick, K. A. Andersen, O. P. Anderson, A. G. M. Barrett and B. M. Hoffman, J. Am. Chem. Soc., 1992, 114, 7416–7424 CrossRef.
- N. Kobayashi, H. Ogata, N. Nonaka and E. A. Luk'yanets, Chem.–Eur. J., 2003, 9, 5123–5134 CrossRef CAS PubMed.
- T. Furuyama, S. Uchiyama, T. Iwamoto, H. Maeda and M. Segi, J. Porphyrins Phthalocyanines, 2018, 22, 88–94 CrossRef CAS.
- N. Toriumi, A. Muranaka, K. Hirano, K. Yoshida, D. Hashizume and M. Uchiyama, Angew. Chem., Int. Ed., 2014, 53, 7814–7818 CrossRef CAS PubMed.
- Y. Wu, T. He, K. Chen, Y. Lu and D. Zhu, Dyes Pigm., 1998, 37, 317–325 CrossRef CAS.
- K. Kasuga, K. Yashiki, T. Sugimori and M. Handa, J. Porphyrins Phthalocyanines, 2005, 9, 646–650 CrossRef CAS.
- W.-F. Law, K. M. Lui and D. K. P. Ng, J. Mater. Chem., 1997, 7, 2063–2067 RSC.
- R. C. Benson and H. A. Kues, J. Chem. Eng. Data, 1977, 22, 379–383 CrossRef CAS.
- A. D. Becke, Phys. Rev. A, 1988, 38, 3098–3100 CrossRef CAS PubMed.
- A. D. Becke, J. Chem. Phys., 1993, 98, 1372–1377 CrossRef CAS.
- A. D. Becke, J. Chem. Phys., 1993, 98, 5648–5652 CrossRef CAS.
- C. Lee, W. Yang and R. G. Parr, Phys. Rev. B: Condens. Matter Mater. Phys., 1988, 37, 785–788 CrossRef CAS PubMed.
- M. J. Frisch, et al., Gaussian 09, Gaussian, Inc., 2009, http://www.gaussian.com/ Search PubMed.
- Phthalocyanines: Properties and Applications, ed. C. C. Leznoff and A. B. P. Lever, VCH, Weinheim, 1989 Search PubMed.
- J. L. Bricks, Y. L. Slominskii, I. D. Panas and A. P. Demchenko, Methods Appl. Fluoresc., 2018, 6, 012001 CrossRef PubMed.
- M. Brinkmann, J.-C. Wittmann, M. Barthel, M. Hanack and C. Chaumont, Chem. Mater., 2002, 14, 904–914 CrossRef CAS.
- K.-I. Tsunoda, Y. Kasuya, T. Umemura and T. Odake, Talanta, 2005, 65, 1097–1101 CrossRef CAS PubMed.
- K. Fujita, K. Taniguchi and H. Ohno, Talanta, 2005, 65, 1066–1070 CrossRef CAS PubMed.
- H. Takahashi, K. Fujita and H. Ohno, Anal. Sci., 2017, 33, 465–467 CrossRef CAS PubMed.
- W. J. Doherty III, C. L. Donley, N. R. Armstrong and S. Saavedra, Appl. Spectrosc., 2002, 56, 920–927 CrossRef.
- N. Iida, K. Tanaka, E. Tokunaga, H. Takahashi and N. Shibata, ChemistryOpen, 2015, 4, 102–106 CrossRef CAS PubMed.
- M. K. Debe, J. Appl. Phys., 1984, 55, 3354–3366 CrossRef CAS.
- J. Dowdy, J. J. Hoagland and K. W. Hipps, J. Phys. Chem. C, 1991, 95, 3751–3755 CrossRef CAS.
- Y. Zhou, T. Taima, T. Miyadera, T. Yamanari and Y. Yoshida, J. Appl. Phys., 2012, 111, 103117 CrossRef.
- T. Chikamatsu, M. Shahiduzzaman, K. Yamamoto, M. Karakawa, T. Kuwabara, K. Takahashi and T. Taima, ACS Omega, 2018, 3, 5678–5684 CrossRef CAS PubMed.
- J. S. Louis, D. Lehmann, M. Friedrich and D. R. T. Zahn, J. Appl. Phys., 2007, 101, 013503 CrossRef.
Footnote |
| † Electronic supplementary information (ESI) available: Additional spectroscopic data, full details of experimental and calculation procedures for all studied compounds. See DOI: 10.1039/d0ra06273a |
|
| This journal is © The Royal Society of Chemistry 2020 |
Click here to see how this site uses Cookies. View our privacy policy here. 
 Open Access Article
 This Open Access Article is licensed under a Creative Commons Attribution-Non Commercial 3.0 Unported Licence
 *ab,
Shiori Uchiyamaa,
Tatsuki Chikamatsua,
Takafumi Horikawaa,
Hajime Maeda
*ab,
Shiori Uchiyamaa,
Tatsuki Chikamatsua,
Takafumi Horikawaa,
Hajime Maeda