
 Open Access Article
 This Open Access Article is licensed under a Creative Commons Attribution-Non Commercial 3.0 Unported Licence
Pt–Ni/ZnO-rod catalysts for hydrogen production by steam reforming of methanol with oxygen†
Ventura Rodríguez Lugoa,
Gilberto Mondragón-Galiciab,
Albina Gutiérrez-Martínezb,
Claudia Gutiérrez-Wingb,
Omar Rosales Gonzáleza,
Pavel Lópezb,
Pastora Salinas-Hernández c,
Francisco Tzompantzid,
María I. Reyes Valderramaa and
Raúl Pérez-Hernández*b
c,
Francisco Tzompantzid,
María I. Reyes Valderramaa and
Raúl Pérez-Hernández*b
aUniversidad Autónoma del Estado de Hidalgo, Área Académica de Ciencias de la Tierra y Materiales, Carr. Pachuca – Tulancingo km. 4.5, C.P. 42184 Pachuca, Hidalgo, Mexico. E-mail: raul.perez@inin.gob.mx
bInstituto Nacional de Investigaciones Nucleares, Carr. México-Toluca S/N, La Marquesa, Ocoyoacac, Edo. de Mexico C. P. 52750, Mexico
cInstituto de Estudios de la Energía, Universidad del Istmo-Campus Tehuantepec, Santo Domingo Tehuantepec, Oaxaca C.P. 70760, Mexico
dDepto. de Química, Area de Catalisis, Universidad Autonoma Metropolitana-Iztapalapa, Av. San Rafael Atlixco No. 189, Iztapalapa, CDMX 09340, Mexico
First published on 12th November 2020
Abstract
Ni, Pt and a mixture of Ni and Pt supported on ZnO-rods were evaluated in autothermal steam reforming of methanol (ASRM) for hydrogen production as a function of the reaction temperature. The catalytic materials were characterized by SEM-EDS, XRD, TEM, HRTEM, TPR and BET. Analysis by SEM and TEM showed structural modifications on the surface of the ZnO rods after Ni impregnation. The reactivity of the catalytic materials in the range of 200–500 °C showed that the bimetallic sample had better catalytic activity among all the catalysts studied. This finding could be associated to PtZn and NiZn alloys present in this catalyst, which were identified by XRD and HRTEM analyses. Catalyst characterization by XRD after the catalytic testing showed that the intermetallic PtZn phase was stable during the reaction in the Pt/ZnO-rod sample. The cubic Ni0.75–Zn0.25 structure identified in the Ni/ZnO-rod sample was transformed to Zn0.1–Ni0.9–O and metallic Ni phases, respectively. On the bimetallic PtNi/ZnO-rod sample, the cubic Ni0.75–Zn0.25 structure remained, although the tetragonal NiZn structure is unstable and was destroyed during the ASRM reaction and then a new phase of Ni0.7Pt0.3 emerged. The promotion effect of Pt and/or Ni on the ZnO-rod was clearly shown.
Introduction
The worldwide drive to access diverse, reliable, renewable energy sources and attain desirable sustainability within a cyclic economic context, commonly involves the use of new green fuels. This has certainly attracted great interest because it envisions a hydrogen-based society in the forthcoming future. Thus, in the process of achieving the benefits from a hydrogen economy, it is preferable to produce H2 from non-fossil resources, such as water or biofuels (methanol or ethanol). Methanol is a promising candidate due to its easy handling, high H/C ratio and low price. Several ways to produce H2 from methanol through different processes have been reported, such as steam reforming-SRM,1–3 partial oxidation-POM4,5 or autothermal steam reforming-ASRM.6–14 R. Pérez-Hernández and collaborators10,14 studied the ASRM reaction on bimetallic Cu/Ni/ZrO2 catalysts, observing higher methanol conversion and selectivity toward H2 in NicoreCushell and Cucore–Nishell nanoparticles than in CuNi alloy catalysts. They suggested that the crystalline anisotropy of the Cu and/or Ni had a beneficial influence on H2 selectivity and methanol conversion. Moraes et al.,15,16 observed that the presence of surface Pt on Ni particles minimized the formation of nickel carbide while increasing the stability of the catalyst at low temperature, during the SRE reaction. Cesar et al.,17 showed that the Ni catalyst was more efficient than the bimetallic PtNi catalyst in the aqueous phase reforming of ethylene glycol reaction, but the bimetallic PtNi catalyst showed a greater conversion and hydrogen selectivity in SR at 450 °C. It was reported elsewhere that catalysts based on zinc oxide have high methanol conversion and selectivity toward CO2 and H2 in the SRM reaction18 with low selectivity to CO and methane.1 It was reported also that Pt1 and Au1 single-atom catalysts (SACs) supported on ZnO {10![[1 with combining macron]](https://www.rsc.org/images/entities/char_0031_0304.gif) 0} nanofacets promote the electron transfer between Pt1 and Au1 atoms to ZnO {100} surfaces, causing that Pt1 and Au1 atoms become positively charged. This charge transfer is proposed to facilitate the intermediaries adsorption reaction during SRM and thus modify the reaction pathways.19 High selectivity for crotyl alcohol (CH3CH
0} nanofacets promote the electron transfer between Pt1 and Au1 atoms to ZnO {100} surfaces, causing that Pt1 and Au1 atoms become positively charged. This charge transfer is proposed to facilitate the intermediaries adsorption reaction during SRM and thus modify the reaction pathways.19 High selectivity for crotyl alcohol (CH3CH![[double bond, length as m-dash]](https://www.rsc.org/images/entities/char_e001.gif) CHCH2OH) was observed when a PtZn alloy was formed in the Pt/ZnO catalyst, during the crotonaldehyde reaction.20 In the same way, Iwasa et al.,21 observed high selectivity during methanol steam reforming on PdZn and PtZn alloys that were formed by reduction of Pd/ZnO and Pt/ZnO catalysts. Among metals supported on ZnO, Pd has performed better than other metals such as Co, Ni, Pt, Ru and Ir.21 Changes in CO production were attributed to the presence of an intermetallic PdZn compound in the Pd/ZnO sample.22 When Pt was supported on ZnO, methanol conversion was 28% lower than in the Pd/ZnO sample, and high selectivity toward CO was observed.23 The selectivity towards CO in the Pt/ZnO catalyst was attributed to the PtZn alloy formation.23,24 The SRM reaction was studied in presence and absence of O2 on Pd/ZnO and Pt/ZnO catalysts composed by PdZn and PtZn alloys. In the same study it was reported that the formation of a NiZn alloy was not favored. On this sample, the decomposition of methanol occurs in the steam reforming reaction. In the presence of oxygen, the oxidation of methanol occurs predominantly and the hydrogen production is not improved, although the total conversion of methanol is increased.25 Wang et al.,26 claimed that particle size of the active phase did not have influence on the crotonaldehyde hydrogenation reaction on the Pt–ZnO catalyst, instead, electronic effects are believed to play essential roles. Higher reactivity and selectivity were observed in ZnNiAl catalysts on the hydrogenolysis of glycerol reaction toward 1,2-propanediol due to the formation of Ni–Zn alloys.27 Catalysts were studied for many reactions using zinc oxide catalysts; a few reports using ZnO-rod samples on the ASRM reaction were reported lately.1,12,13,28,29 Hu et al.,30 found that ZnO-rods exhibit a high production rate of 1,2-propandiol in the reforming hydrogenolysis on non-polar planes. In this way, the use of new materials with catalytic applications is necessary in the industry of high-quality fuels transportation. In this context, the development of one-dimensional (1D) catalysts such as rods, with large surface-to-volume ratio and dimension, are especially sensitive to surface-interactions of the active phase and molecules, to produce hydrogen. Based on all the above, the goal of this work was to evaluate the catalytic properties of Pt and Ni supported on ZnO rods in the ASRM reaction. The new 1D-rod catalysts obtained were characterized by SEM, EDS, XRD, TEM, HRTEM and TPR. The catalytic properties of the PtNi/ZnO-rod catalysts were evaluated for the autothermal steam reforming methanol reaction.
CHCH2OH) was observed when a PtZn alloy was formed in the Pt/ZnO catalyst, during the crotonaldehyde reaction.20 In the same way, Iwasa et al.,21 observed high selectivity during methanol steam reforming on PdZn and PtZn alloys that were formed by reduction of Pd/ZnO and Pt/ZnO catalysts. Among metals supported on ZnO, Pd has performed better than other metals such as Co, Ni, Pt, Ru and Ir.21 Changes in CO production were attributed to the presence of an intermetallic PdZn compound in the Pd/ZnO sample.22 When Pt was supported on ZnO, methanol conversion was 28% lower than in the Pd/ZnO sample, and high selectivity toward CO was observed.23 The selectivity towards CO in the Pt/ZnO catalyst was attributed to the PtZn alloy formation.23,24 The SRM reaction was studied in presence and absence of O2 on Pd/ZnO and Pt/ZnO catalysts composed by PdZn and PtZn alloys. In the same study it was reported that the formation of a NiZn alloy was not favored. On this sample, the decomposition of methanol occurs in the steam reforming reaction. In the presence of oxygen, the oxidation of methanol occurs predominantly and the hydrogen production is not improved, although the total conversion of methanol is increased.25 Wang et al.,26 claimed that particle size of the active phase did not have influence on the crotonaldehyde hydrogenation reaction on the Pt–ZnO catalyst, instead, electronic effects are believed to play essential roles. Higher reactivity and selectivity were observed in ZnNiAl catalysts on the hydrogenolysis of glycerol reaction toward 1,2-propanediol due to the formation of Ni–Zn alloys.27 Catalysts were studied for many reactions using zinc oxide catalysts; a few reports using ZnO-rod samples on the ASRM reaction were reported lately.1,12,13,28,29 Hu et al.,30 found that ZnO-rods exhibit a high production rate of 1,2-propandiol in the reforming hydrogenolysis on non-polar planes. In this way, the use of new materials with catalytic applications is necessary in the industry of high-quality fuels transportation. In this context, the development of one-dimensional (1D) catalysts such as rods, with large surface-to-volume ratio and dimension, are especially sensitive to surface-interactions of the active phase and molecules, to produce hydrogen. Based on all the above, the goal of this work was to evaluate the catalytic properties of Pt and Ni supported on ZnO rods in the ASRM reaction. The new 1D-rod catalysts obtained were characterized by SEM, EDS, XRD, TEM, HRTEM and TPR. The catalytic properties of the PtNi/ZnO-rod catalysts were evaluated for the autothermal steam reforming methanol reaction.
Results and discussion
Surface area of the ZnO rods and that of the commercial ZnO before impregnation was ca. 1.5 and 1.2 m2 g−1, respectively.1 These surface area values are close to those of the Ni/ZnO, PtNi/ZnO and Pt/ZnO synthesized catalysts, which were 1.3, 1.0 and 1.2 m2 g−1 respectively. Some catalysts with high specific surface area have shown low catalytic activity, which has been attributed to the low diffusivity of the reactants toward the active sites inside the micropores of the sample. Also, high surface area in the support promotes high dispersion of the active phase in the catalyst, obtaining small particle sizes of this phase, which increases the metal–support interaction, decreasing the activity. Contrary to high surface area-catalysts, the low surface area of the synthesized ZnO rods and its non-porous structure promotes the deposit of the active phase onto the surface of the rod, avoiding the diffusion of the active phase inside the support. In this case, all the active phase is fully exposed for the catalytic reaction. This characteristic makes the ZnO rods-based catalyst suitable for this and other reactions. Another concomitant advantage is the fact that ZnO rods have different exposed planes, which can contribute to reactivity in different ways, in contrast to those structures which do not have a specific shape as observed on Pt/ZnO-powders. Hexagonal ZnO prismatic rods with six smooth planes throughout their length were observed by SEM technique. While, catalysts characterization showed rough surface along the ZnO-rods only in Ni-based samples (ESI 1†).The XRD powder patterns of the synthesized bare ZnO rods, and the ZnO rod-based catalysts (Pt/ZnO, Ni/ZnO and PtNi/ZnO respectively), are presented in Fig. 1. Diffraction peaks of the hexagonal zincite crystalline structure (according to the JCPDS 04-003-2106) were identified in all samples. The strong and well-defined peaks reveal highly crystalline samples. No diffraction peaks of metallic zinc or another impurity element were found in the ZnO-rods (Fig. 1a). XRD powder patterns of reduced samples before the catalytic reaction, showed characteristic diffraction peaks of ZnO–zincite structure. Additionally, low intensity diffraction peaks ca. 41°, 44°, 47° and 51° were observed. High resolution (HR) X-ray diffraction analysis from 39–55° (2 theta) was performed (Fig. 1b) in order to identify these peaks and are reported in Table 1. It is clear that the intensity of the diffraction peak at 43.56° is slightly higher in the bimetallic sample than the one at 43.73° on the monometallic Ni/ZnO-rod catalyst. This finding indicates that the double thermal treatment during the catalyst preparation process, promotes the segregation of Pt and Ni phases, and the NiZn or PtZn alloys along the ZnO-rod were obtained. As well, the tetragonal PtZn phase was favored instead of the cubic Ni0.75–Zn0.25 phase.
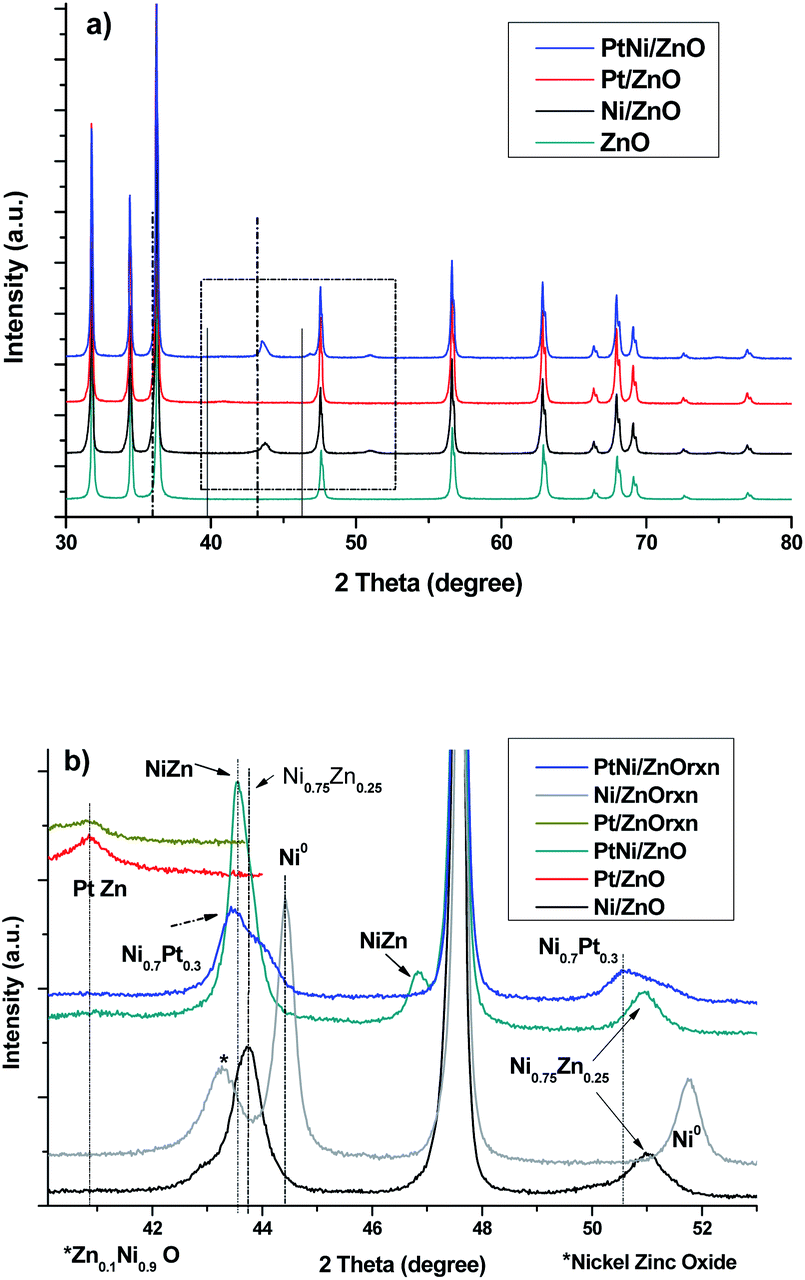 | ||
| Fig. 1 (a) XRD patterns of bare ZnO-rod, PtNi/ZnO-rod catalysts, (b) high resolution XRD respectively (zone in the rectangle in (a)) *nickel zinc oxide. Dash line-Zn and continuous line Pt-(in (a)). | ||
| Sample | Phase 1 | Phase 2 | Phase 3 |
|---|---|---|---|
| a *cubic Ni0.75–Zn0.25 phase (PDF-04-004-4485), **tetragonal PtZn phase (04-016-2848), ***tetragonal NiZn (PDF-00-006-0672). | |||
| Ni/ZnO | *(111) and (200) planes, (43.73° and 50.94°) | — | — |
| Pt/ZnO | **(111) plane, (40.62°) | — | — |
| PtNi/ZnO | **(111) plane, (40.64°) | *(200) plane, (50.94°) | ***(101) and (110) planes, (43.56°, 46.81°) |
No evidence of diffraction peaks corresponding to PtO or NiO phases were observed on the fresh PtNi/ZnO-rod sample. This result indicates that a complete reduction of the active phase of the catalyst has taken place, and most of the metallic nickel and platinum form NiZn or PtZn alloys during the reduction step. A similar behavior was reported with the Pd/ZnO catalyst prepared either with commercial ZnO or ZnO rods as supports.31 Iwasa et al.,25 reported the presence of the PdZn and PtZn alloys obtained by the reduction of Pd/ZnO and Pt/ZnO, but no NiZn alloy was reported in the Ni/ZnO catalyst.
Catalysts characterization after the catalytic test are shown in Fig. 1b. No changes in the XRD pattern of the Pt/ZnO-rod catalyst was observed, indicating that the tetragonal PtZn phase is stable under the reaction conditions used in this research. For Ni/ZnO-rod sample, the cubic Ni0.75–Zn0.25 phase was transformed to Zn0.1–Ni0.9–O (PDF 04-013-0897) and metallic cubic Ni (PDF 04-010-6148) respectively. This result showed that the intermetallic cubic Ni0.75–Zn0.25 phase present in the as-prepared Ni/ZnO-rod sample, is unstable during the reaction. Analysis of the bimetallic PtNi/ZnO-rod catalyst after the catalytic reaction shows Ni0.75–Zn0.25 and Ni0.7Pt0.3 (PDF 04-018-6851) cubic phases.
TEM characterization of raw ZnO-rods, showed that ZnO grows with star-like morphologies ca. 3 μm long (ESI 2†). TEM image of Pt/ZnO rod catalyst is shown in Fig. 2. Nanoparticles with sizes between 4–13 nm distributed along the ZnO rod were observed (Fig. 2a). Inset in Fig. 2a shows an electron diffraction pattern of the rod in the [100] zone axes, indicating that its growth took place in the 〈0002〉 direction. The EDS chemical analysis of the nanoparticles observed on the surface of the Pt/ZnO rods catalyst, indicated the presence of Pt, Zn, and O at 4.27, 76.41 and 19.32 wt% respectively. Fig. 2b shows a HRTEM image of a nanoparticle observed over a Pt/ZnO-rod. The FFT (Fast Fourier Transform, inset image) analysis of this nanoparticle shows that it corresponds to the tetragonal phase of the intermetallic PtZn alloy, with a = 0.2858 nm and c = 0.3465 nm lattice parameters (04-016-2848), associated to the (110) and (10) planes respectively, in the [001] zone axes. This agrees with the XRD pattern of this sample. The PtZn alloy particle size distribution (ESI 3†), indicating an average particle size of 6.5 nm. The analysis was based on the measurement of more than 1300 particles. Hyman et al.,32 impregnated Pd on the ZnO (1010) and ZnO (0001) facets of a single crystal, observing the formation of a PdZn alloy on the ZnO (0001) polar facets. Zhang et al.,31 observed a stable formation of the PdZn alloy on polar ZnO facets in Pd/ZnO catalyst. In agreement with literature, we observed nanoparticles of the intermetallic PtZn alloy distributed over the surface of the polar and non-polar facets of the ZnO-rods support.
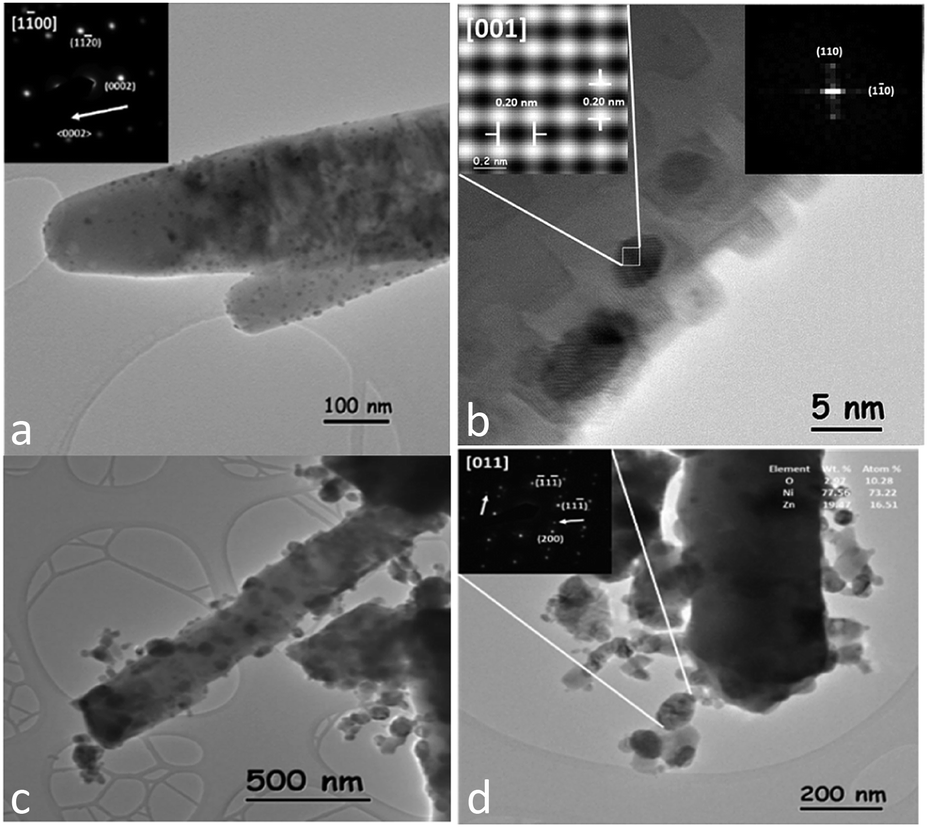 | ||
| Fig. 2 (a) TEM image of the Pt/ZnO-rod catalyst, inset electron diffraction pattern in [100] direction indicated that the rod grows in the 〈0002〉 direction and particle size distribution, (b) HRTEM image of the PtZn nanoparticle on the ZnO rods, inset image shows the FFT pattern of the PtZn alloy, (c) Ni/ZnO-catalyst with large nanoparticles distributed along the rod and (d) Ni/ZnO, electron diffraction pattern and EDS chemical analysis from a nanoparticle (inset) respectively. | ||
Ni/ZnO-rod catalyst showed nanoparticles with sizes ranging from 20 to 120 nm along the ZnO-rod (Fig. 2c). However, these nanoparticles apparently were released from the rod surface. The EDS chemical analysis of these nanoparticles indicated the presence of Ni, Zn, and O at 77.56, 19.47 and 2.97 wt% respectively. No HRTEM images were taken from this sample due to detection limit of the TEM equipment, and the magnetic character of the sample that causes distortion in the image. Instead, the electron diffraction pattern (EDP) of some nanoparticles was taken. Fig. 2d shows a Ni/ZnO-rod image. The EDP in [011] zone axes (inset) taken from a nanoparticle of 120 nm in diameter, indicates that it corresponds to the cubic crystalline phase of the intermetallic Ni0.75Zn0.25 alloy with lattice parameter a = 0.3582 nm (PDF 04-004-4485), which corresponds to (1), (11) and (200) planes respectively. This finding is consistent with the XRD pattern obtained from this sample.
PtNi/ZnO-rod catalyst showed the same morphology as the Ni/ZnO-rod sample. Irregular edges and detached material were observed when Pt and Ni were impregnated on ZnO-rods (Fig. 3a). The size of the nanoparticles distributed along the rod ranges from 3 to 140 nm. Fig. 3b shows a HRTEM image of a nanoparticle of 10 nm in size. According to FFT and IFFT analysis, its lattice parameters correspond to the intermetallic PtZn phase (PDF 04-016-2848) with a = 0.2858 nm and c = 0.3465 nm. The identified planes of the tetragonal PtZn alloy are the (110) and (101) in the [11]. The cubic NiZn phase (PDF 04-004-4485) on the bimetallic catalyst was identified by EDP and EDS chemical analysis. Fig. 3c shows an intermetallic NiZn nanoparticle of about 80 nm in diameter. The EDP (inset) along the [011] zone axis indicates the (111) and (200) planes respectively.
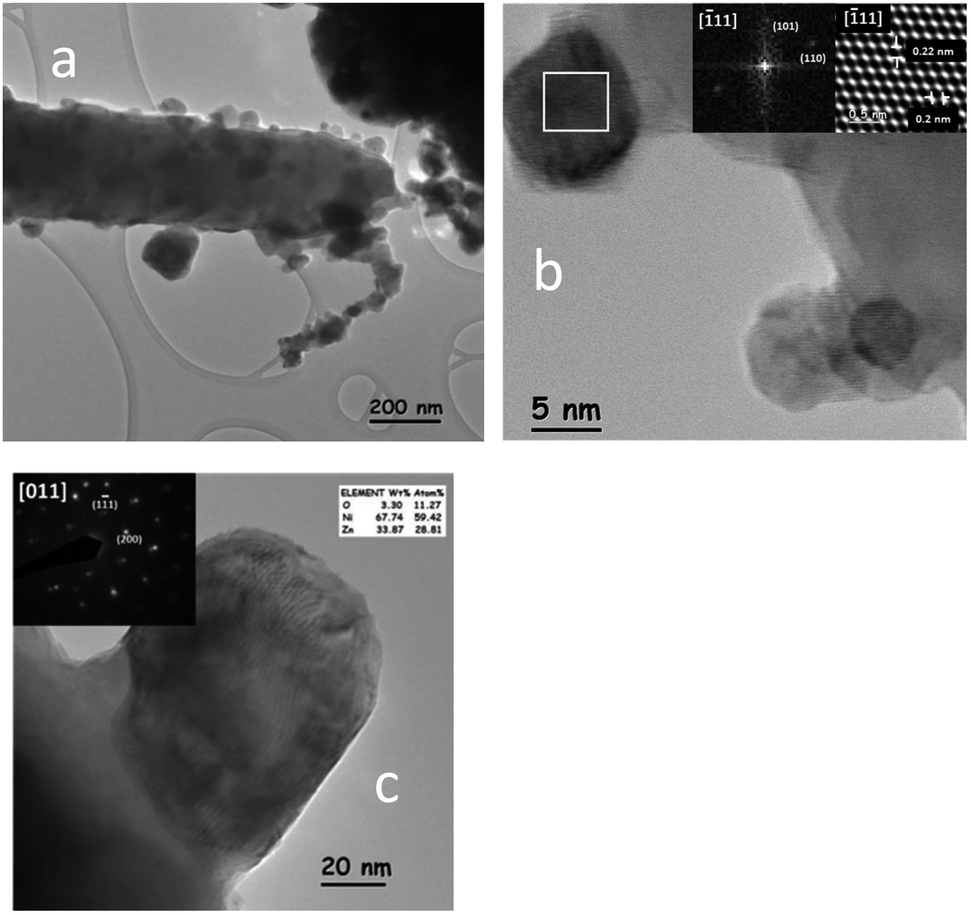 | ||
| Fig. 3 (a) Nanoparticles distributed along the ZnO rod in the PtNi/ZnO-rod catalyst, (b) a PtZn nanoparticle identified by HRTEM analysis and (c) NiZn identified by EDP and EDS analysis. | ||
The average size of the PtZn alloy and the NiZn particles on the PtNi/ZnO catalyst was 6.26 nm and 54.22 nm respectively, as determined by the analysis of more than 2300 particles in the sample by TEM (ESI 3b and c†). The PtZn alloy identified in the bimetallic PtNi/ZnO-rod sample, showed (101) and (110) planes, while in the monometallic Pt/ZnO-rod catalyst, the exposed planes were {110}. This finding might have influenced the catalytic properties of the bimetallic sample. The NiZn nanoparticles showed the same particle size and zone axis as those nanoparticles identified in the monometallic Ni/ZnO-rod sample, implying a structural similarity between the two samples.
The TPR profiles of calcined Pt/ZnO-rod, Ni/ZnO-rod, and PtNi/ZnO-rod catalytic materials are presented in Fig. 4. Bare ZnO-rods without Ni, Pt or PtNi showed a hydrogen consumption before 100 °C which increases as a function of temperature, showing that a small section of the surface zinc oxide was reduced. The TPR profile of the Ni/ZnO rod sample was described by two hydrogen consumption peaks and a shoulder at 190, 310 and 405 °C, respectively. The first hydrogen consumption peak was attributed to the reduction of large NiO particles that have weak interaction with the support, thus making the nickel particles easy to be reduced. The second hydrogen consumption peak could be assigned to the reduction of NiO in intimate contact with the support. In addition, the existence of bulk NiO, delays the H2 diffusion into the NiO particles to complete its reduction. This causes the broadening of the reduction peak at high temperature,6,10,11,13,14,33 since large particles tend to be reduced slower than the small particles, due to their relatively smaller surface area exposed to hydrogen. The Pt/ZnO-rod sample showed two low intensity reduction peaks. The first peak is attributed to the reduction of Zn–PtOx oxidized species that can be formed by the metal–support interaction,34 the second reduction peak observed at 355 °C is attributed to the surface reduction of the ZnO generated by the interaction with the Pt particles. The hydrogen consumption of the PtNi/ZnO-rod sample showed a reduction peak at 425 °C and is higher in comparison to the monometallic samples. This finding could be attributable to sintering of the active phase, since this catalyst was exposed to a two stages-calcination. During the reduction of the PtNi/ZnO-rod catalyst, the PtO is reduced before the NiO (Fig. 4). During the TPR experiments, the hydrogen is first activated on Pt (or Ni) surface, then the active hydrogen is transferred to the surface ZnO by the hydrogen spillover, reducing it. After this, most of the metallic Ni (or Pt) and Zn atoms react between them to form the intermetallic NiZn or PtZn alloys,35 eq. I. The H2 consumption (M/H2) was 0.83, 1.13 and 0.93 for Ni/ZnO, PtNi/ZnO and Pt/ZnO respectively. Monometallic samples clearly exceed the H2 consumption in comparison with the bimetallic catalyst.
| Pt (or Ni)/ZnO (s) + H2 → ZnPt (or NiZn) (s) + H2O… (l) |
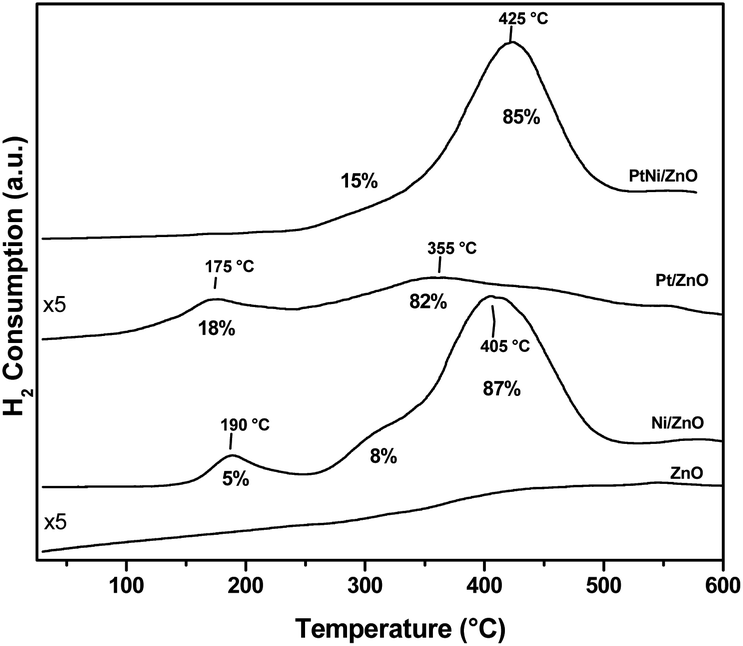 | ||
| Fig. 4 TPR profiles of the bare ZnO rod and catalysts. | ||
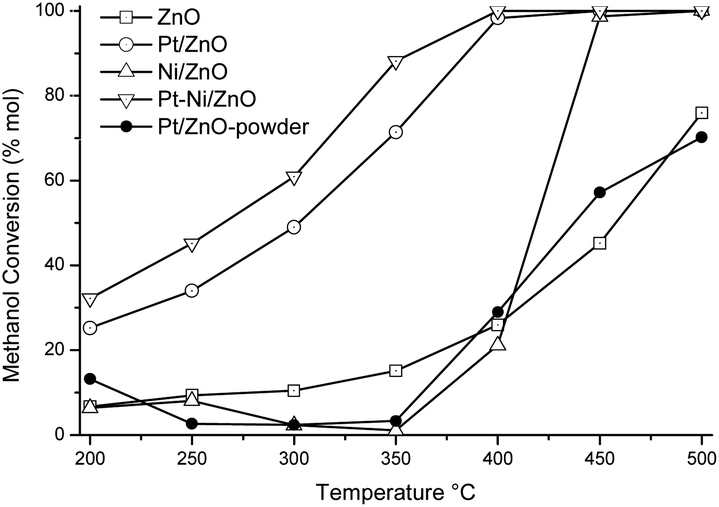
The overall activity as a function of the reaction temperature is shown in Fig. 5. Methanol conversion of the support is included for purposes of comparison. The methanol conversion on the catalysts and the support starts at about 200 °C. The bare ZnO-rod and Ni/ZnO-rod catalyst showed low methanol conversion at the beginning of the reaction. ZnO-rod support reaches its maximum methanol conversion of nearly 76% at 500 °C, whereas, the Ni/ZnO-rod achieved a 100% methanol conversion at the end of the studied reaction temperature.
 | ||
| Fig. 5 Temperature dependence of ARM activity of catalysts. | ||
The catalytic activity of bare ZnO-rod support was higher than that reported by Koga et al.,36 and Mo et al.,37 where no catalytic activity was observed when they used ZnO whiskers and commercial ZnO powders for SRM and POM reaction, respectively. But the methanol conversion is close to that reported previously in ref. 1. Hu et al.,30 used ZnO with different morphologies as co-catalysts in combined reforming hydrogenolysis of glycerol, where they observed a positive effect in the 1,2-propendiol production rate and its dependence on their crystal habits. This is, more abundant nonpolar planes improve selectivity to hydrogenolysis products and production rate of 1,2-propendiol. The methanol conversion after 400 °C on the catalyst containing both Ni and ZnO-rod, is better than on the ZnO-rod. The methanol conversion of Pt/ZnO-powder synthesized with ZnO-Sigma-Aldrich powder (0.5 wt% of Pt) was included to compare both Pt-based catalysts. The catalytic activity of Pt/ZnO-powder and Pt/ZnO-rod samples showed differences in methanol conversion. The methanol conversion of Pt/ZnO-powder and Pt/ZnO-rod catalysts was 14% and 26% respectively at the beginning of catalytic test. The Pt/ZnO-powder sample exhibited a methanol conversion close to that of bare ZnO-rod. This finding clearly demonstrated the beneficial effect of the ZnO-rods as support for Pt instead of, the ZnO-powder for the ASRM reaction. The Pt/ZnO-rod catalyst achieved 100% of methanol conversion at 450 °C, while the monometallic Pt/ZnO-powder only reached 72% conversion at 500 °C. On these samples, the tetragonal PtZn phase identified by XRD technique remained after the catalytic reaction on the Pt/ZnO-rod catalyst, while in the Pt/ZnO-powder, a mixture of the PtZnO and tetragonal PtZn phase were identified by XRD technique (figure not shown). This result might explain the better catalytic performance observed in the Pt/ZnO-rod than in the Pt/ZnO-powder catalysts. That is, the nonpolar planes of the ZnO-rod, stabilized the PtZn phase, that are beneficial for the catalytic reaction1 than on the polycrystalline commercial ZnO. Ito et al.,38 used different alloys with Pt supported on activated carbon, and found that the PtZn alloy had the best catalytic behavior in methanol reforming.
The bimetallic catalyst achieves 100% conversion at 400 °C. The better catalytic properties of this sample, could be associated to different crystalline phases on the surface of the catalyst (Table 1). This kind of active phase on the bimetallic PtNi/ZnO-rod catalyst had a cooperative effect on the methanol conversion. However, the bimetallic sample after the catalytic test, showed that PtZn and NiZn phases were not present, instead, the Ni0.7Pt0.3 phase merged and only the cubic Ni0.75–Zn0.25 phase remained. This indicates that the tetragonal NiZn and PtZn phase are not stable during the ASRM reaction and these were transformed into intermetallic Ni0.7Pt0.3 and ZnO phases, respectively. So, after catalytic reaction, metallic Ni was obtained in the monometallic catalyst, while in the bimetallic sample Ni interacted with Pt to obtain the Ni0.7Pt0.3 phase. Palma and colleagues,39,40 prepared a NiPt/CeO2 catalyst by adding first Ni to ceria, then the Pt was impregnated. They observed higher activity and selectivity. However, carbon formation was observed on the low temperature steam reforming (LTSR) of ethanol. The studied catalysts showed the following behavior to achieve maximum methanol conversion: PtNi/ZnO-rod > Pt/ZnO-rod > Ni/ZnO-rod ≫ Pt/ZnO powder ≅ ZnO-rod.
The products obtained from the ASRM reaction on the Ni/ZnO-rod, Pt/ZnO-rod and PtNi/ZnO-rod samples were H2, CO and CO2, Fig. 6a–c. The selectivity towards CO2 on the ASRM reaction decreases up to 22% near 350 °C due to H2 and CO formation, although beyond this temperature, it remains constant in all catalysts. Iwasa et al.21 mentioned that Pt/ZnO catalysts exhibit higher activity and selectivity towards CO2 production compared with the Pt/SiO2 sample in methanol reforming. It is clear that CO selectivity in the bimetallic catalyst is slightly higher up to 300 °C, above this temperature ZnO has a greater selectivity towards this product respect to other samples. The Ni/ZnO-rod catalyst had high selectivity toward H2 and CO2 and is practically CO free (Fig. 6b). This suggests that the interaction between the active phase and the ZnO-rod plays an important role in decreasing the CO concentration. In addition, the ZnO support is better to produce low CO selectivity and high selectivity for H2 production, ESI 4.† The same behavior was observed on the Pd/ZnO catalyst which exhibited high selectivity to CO2 with low CO selectivity. This was attributable to formation of the PdZn alloy (Pd/Zn = 1![[thin space (1/6-em)]](https://www.rsc.org/images/entities/char_2009.gif) :1) via reduction of Pd/ZnO in H2 at >350 °C.41 Zhang et al.,31 observed differences in the CO selectivity when Pd was supported on ZnO rods or commercial ZnO, without any dominant facets. They associated the higher CO selectivity at lower Pd loading to the formation of Pd-rich PdxZny preferentially on ZnO nonpolar facets in the SRM reaction. Low CO selectivity was observed on the Ag/ZnO-rod catalysts during SMR reaction.1 On the Pd/ZrO2, Pd/TiO2 and Pd/ZrO2–TiO2 catalysts tested in the SRM reaction, the H2 selectivity was reported in the range of 60 to 70% and 25 to 35% for CO, respectively. In our case, the selectivity towards CO is much lower, being beneficial since it means a lower production of this gas. The monometallic Pt/ZnO-rod catalyst was slightly better in H2 production than the other catalysts tested, Fig. 6c. However, the bimetallic sample showed better performance in methanol conversion than the other samples. This finding is attributed to the presence of the stable tetragonal PtZn phase of this sample, as discussed in the XRD section. In addition, this PtZn phase was more effective for H2 production, than the Ni°, Ni0.7Pt0.3 alloy and NiZnO observed on the monometallic Ni/ZnO-rod and bimetallic NiPt/ZnO samples respectively, as discussed above.
:1) via reduction of Pd/ZnO in H2 at >350 °C.41 Zhang et al.,31 observed differences in the CO selectivity when Pd was supported on ZnO rods or commercial ZnO, without any dominant facets. They associated the higher CO selectivity at lower Pd loading to the formation of Pd-rich PdxZny preferentially on ZnO nonpolar facets in the SRM reaction. Low CO selectivity was observed on the Ag/ZnO-rod catalysts during SMR reaction.1 On the Pd/ZrO2, Pd/TiO2 and Pd/ZrO2–TiO2 catalysts tested in the SRM reaction, the H2 selectivity was reported in the range of 60 to 70% and 25 to 35% for CO, respectively. In our case, the selectivity towards CO is much lower, being beneficial since it means a lower production of this gas. The monometallic Pt/ZnO-rod catalyst was slightly better in H2 production than the other catalysts tested, Fig. 6c. However, the bimetallic sample showed better performance in methanol conversion than the other samples. This finding is attributed to the presence of the stable tetragonal PtZn phase of this sample, as discussed in the XRD section. In addition, this PtZn phase was more effective for H2 production, than the Ni°, Ni0.7Pt0.3 alloy and NiZnO observed on the monometallic Ni/ZnO-rod and bimetallic NiPt/ZnO samples respectively, as discussed above.
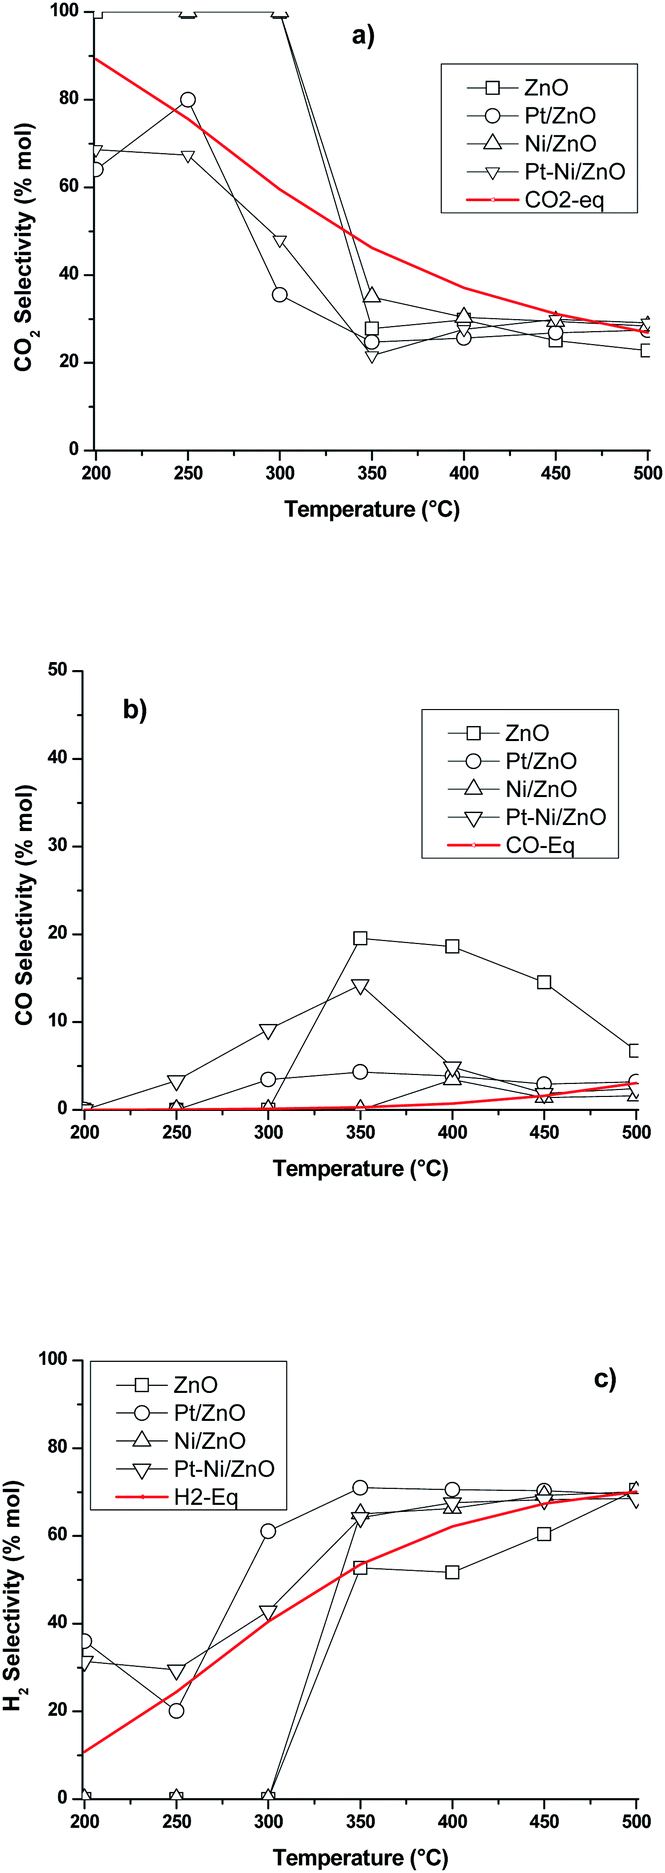 | ||
| Fig. 6 Reaction products of ASRM reaction (a) CO2, (b) CO and (c) H2. Equilibrium (red lines) distribution as a function of reaction temperature on PtNi/ZnO-rod catalysts respectively. | ||
Temperature-programmed of ASRM reaction (TP – CH3OH + H2O + O2)
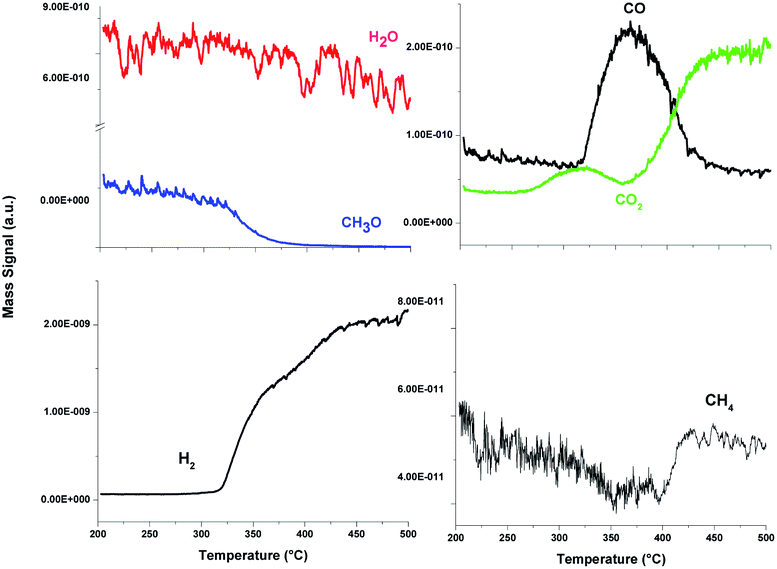
Based on our GC results it can be seen that the PtNi/ZnO-rod sample was the most suitable catalyst in terms of methanol conversion. A detailed study was carried out with this catalyst. Online mass spectrometry (MS) was used to monitor the products of the reaction from this catalyst on the autothermal steam reforming of methanol reaction. The steam sample was taken immediately at the outlet of the reactor as a means of enabling real-time analysis of catalytic reaction. Since CH3OH and O2 had the same molecular mass, we followed the CH3O instead of the CH3OH mass signal in order to differentiate these compounds during the TP-ASRM reaction.Fig. 7 shows the CH3O, H2O, H2, CO2, CO and CH4 mass signals monitored by MS of bimetallic PtNi/ZnO catalyst. The CH3O mass signal profile showed a decrease, while the mass signal of the other reaction products increased as reaction temperature rose. This behavior agrees with methanol conversion and selectivity as reported above, suggesting that the catalyst is stable during the reaction, because no further changes in the outlet signals on the real-time monitoring analysis by MS were observed. So, if there were any intermediates during the reaction, they could be released to the effluent and be determined by MS.
 | ||
| Fig. 7 MS profiles during temperature-programmed of ASRM reaction of the PtNi/ZnO-rod catalyst. | ||
These species can furnish valuable insights into a catalytic process. At the beginning of the reaction, the mass signal of CO2 increases slightly; this result indicates a complete combustion of methanol. Then, the selectivity of the catalyst changes, the CO production begins, and the H2 mass signal rises. The maximum CO production resulted at 325 °C, then it diminishes, and the mass signal of CO2 grows, in addition, the CH4 mass signal slightly increases. The following sequence of reactions can be summarized during autothermal steam reforming reaction over this PtNi/ZnO catalyst, according with mass spectrometry (MS) results:
| CH3OH + 3/2O2 → CO2 + 2H2O |
| CH3OH + H2O → CO2 + 3H2 |
| CO2 + H2 = H2O + CO (RWGSR) |
| CO + H2O → CO2 + H2 (WGSR) |
| 2CO + 2H2 → CH4 + CO2 |
Conclusions
Zinc oxide synthesized by a simple hydrothermal method, results in flower shaped structures that provide high interaction with Pt and Ni atoms on the surface of the polar and non-polar facets of the ZnO-rods support, increasing the bifunctional behavior and thermal stability of samples. All catalysts showed high methanol conversion and selectivity to H2 and CO2, avoiding CO formation. Which is highly desirable in catalytic reactions for the production of H2 as fuel for PEM cells, where CO is highly damaging. It was observed that the sample that showed the highest methanol conversion on ASRM reaction was the PtNi/ZnO-rod catalyst, in comparison with the monometallic Pt/ZnO-rod and Ni/ZnO-rod samples respectively. However, H2 selectivity of Pt/ZnO-rod sample was much higher than on PtNi/ZnO-rod catalyst. This difference is attributed to the crystalline structure on each catalyst. In addition, the high degree of selectivity is attributed to a bifunctional behavior between the carrier and the PtZn and NiZn alloys, where the ZnO-rod provides adsorption sites for intermediate reactions, whereas intermetallic PtZn and NiZn alloy particles facilitate the mobility and hydrogen utilization. However, these intermetallic phases that were observed in the Ni/ZnO-rod and PtNi/ZnO-rod samples, are unstable during the reaction and are destroyed, yielding new phases. Our results demonstrate that the catalytic activity and selectivity are not related to the specific surface area, but rather appears to be determined by the catalyst composition and crystalline structure, indicating that the reaction is structure-sensitive.Experimental
The ZnO rods were synthesized by the hydrothermal method. A 0.2 M of Zn(NO3)2·6H2O and 1 M of NaOH solutions were prepared separately. At room temperature, these solutions were mixed and stirred for 10 min. The obtained mixture was transferred into a Teflon-lined stainless-steel autoclave (1 L) and heated for 6 h at 100 °C. Then, the autoclave was cooled to room temperature and the obtained precipitate was filtered and washed several times with deionized water until a neutral pH was reached. Next, the powder was dried at 90 °C for 24 h. The solid was calcined at 600 °C for 3 h using a heating ramp of 10 °C min−1.The impregnation of the active phase was performed using the incipient impregnation method. Pt (0.5 wt%) was impregnated using Pt-acetylacetonate (Sigma-Aldrich, 97%) in an acetone solution. Another Pt/ZnO-powder was prepared using commercial ZnO (Sigma-Aldrich) to compare the effect of the ZnO-rod versus the ZnO-powder. Ni (5 wt%) was impregnated using a Ni(NO3)2·6H2O (Meyer, purity 98%) in ethanol solution. The remaining liquid was removed at 50 °C with constant stirring. The obtained solid were calcined at 400 °C for 1 h. The bimetallic PtNi/ZnO-rod catalyst was synthesized by successive impregnations with Pt (0.5 wt%) and Ni (5 wt%) respectively. Briefly, an aliquot of the Ni/ZnO-rod sample previously synthesized and calcined was impregnated with a Pt-acetylacetonate solution in acetone. The remaining liquid was removed at 50 °C under constant stirring. The resulting solid was calcined at 400 °C for 1 h. All the samples were reduced at 500 °C in H2 stream (40 mL min−1) 1 h before the characterization, except for the TPR analysis.
The XRD patterns were acquired on a Bruker D8 Advance X-ray diffractometer using Cu Kα radiation (λ = 0.15418 nm), with a step size of 0.02515, from 5° to 80°, 2θ. ZnO-1D morphology was analyzed by Field Emission Scanning Electron Microscopy (FESEM) JEOL JSM – JSM7800FEG, equipped with an OXFORD microprobe for chemical analysis, using energy dispersive X-ray spectroscopy (EDS). HRTEM and TEM analyses of the samples were performed in a JEOL JEM-2010HT transmission electron microscope with a spatial resolution of 0.19 nm point to point equipped with a ThermoNoran EDS microprobe for chemical analysis. The reducibility of the catalysts was analyzed by Temperature-Programmed Reduction (TPR) experiments in an automatic multitask unit BELCAT-B (Bel Japan Inc.) equipped with a Thermal Conductivity Detector (TCD) coupled to a mass spectrometer (BELMass) with output to a computer. The fresh sample (0.050 g) was placed in the “U” type reactor. For TPR measurements, a H2 (5%)/Ar gas mixture was used (40 mL min−1). The temperature was increased at a rate of 10 °C min−1 from room temperature to 600 °C. The effluent gas from the reactor was passed through silica gel to remove water before measuring the amount of H2 consumed by the oxidized catalyst during the reduction by the TCD. Surface area was determined (in the same equipment) by N2 adsorption–desorption using a gas mixture 30% N2 in 70% He. The measurement was carried out at −196 °C (liquid nitrogen temperature).
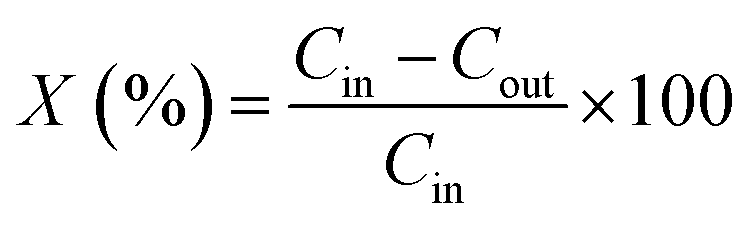
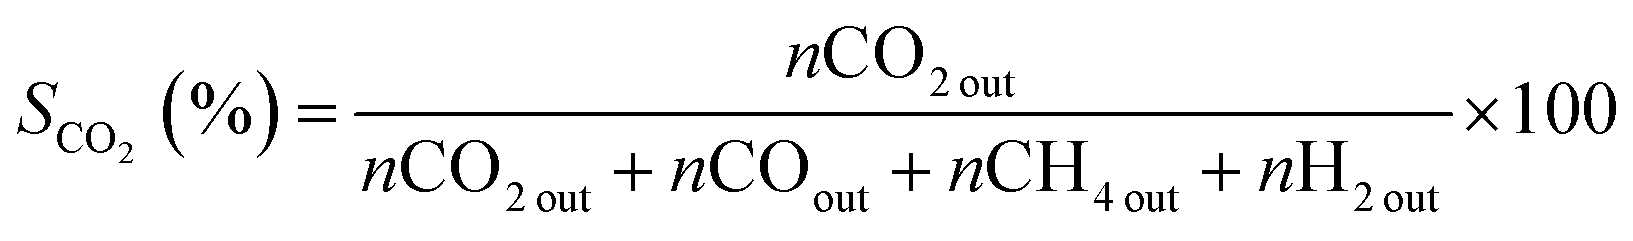
The catalytic properties of samples were determined in the ASRM reaction. The analysis was carried out using a fixed flow quartz reactor (8 mm i.d.) with dynamic flow in a RIG-100 ISR Inc. automatic multitask unit. 0.1 g of the catalyst diluted in 0.5 g of SiC was used for the analysis at a temperature range of 200 to 500 °C, at atmospheric pressure, with steps of 50 °C and a stabilization time of 7 h in each temperature. A K-type thermocouple in contact with the catalyst bed to measure and control the catalyst bed temperature. The sample was activated prior the test using a H2 flow (60 mL min−1) at 500 °C, 1 h. The sample was brought up to the reaction temperature in He and the reaction mixture was introduced. For the catalytic test, 30 mL min−1 of the O2 (5%)–He mixture was fed into a stainless-steel saturator that contained methanol. 30 mL min−1 of He was fed to the stainless-steel saturator that contained water and 140 mL min−1 of He was used as a diluent. A total flow rate of 200 mL min−1 (38197 h−1) was maintained. The amount of methanol, water and oxygen in the feed was 1.0, 3.4 and 0.1 mol h−1 respectively. The gases from the quartz reactor were examined in a gas chromatograph equipped with a TCD and two columns system (5 Å molecular sieve operated at 45 °C and Porapack Q, working at 110 °C) and two injectors controlled by Clarity software V 7.2.0.73 (ESI 5†). The following equations were employed to calculate the activity during methanol conversion (eqn (1)) and selectivity for CO2, CO, and H2 (eqn (2)–(4) respectively). The effluent gases from the catalytic reactor (RIG-100) of the ASRM reaction were monitored in real-time from 200 to 500 °C by MS, using a BELMass benchtop-type quadrupole mass spectrometer.
 | (1) |
 | (2) |
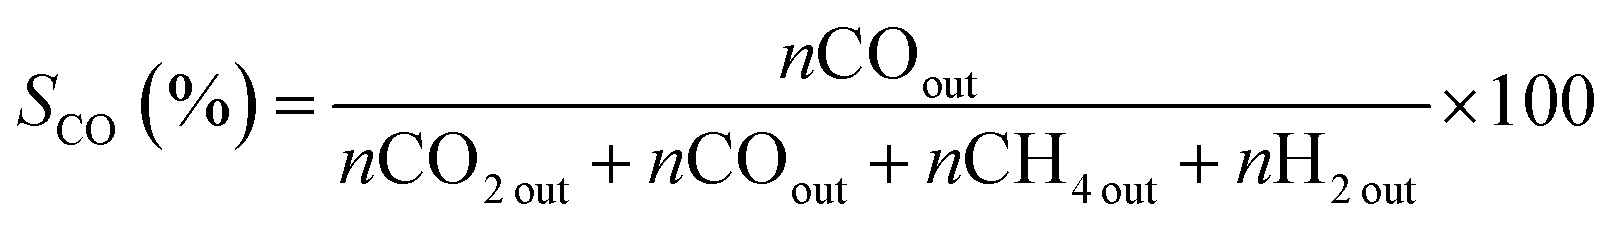 | (3) |
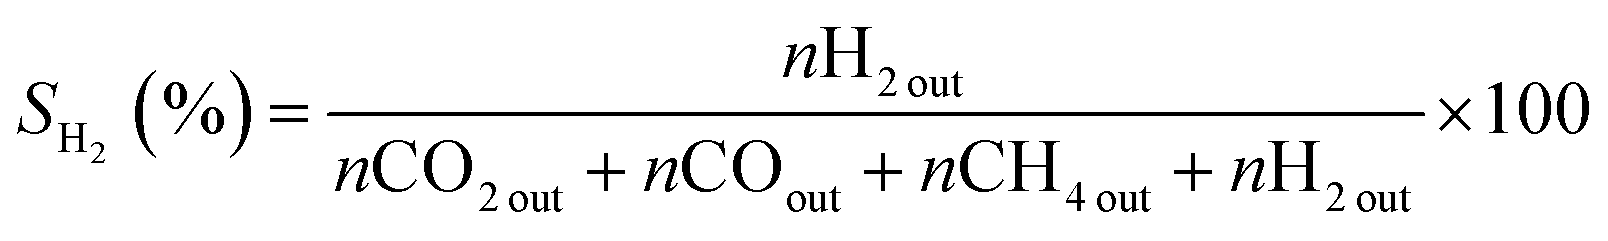 | (4) |
Conflicts of interest
There are no conflicts to declare.Acknowledgements
This work has been supported by the CONACYT-SENER (grant No. 226151) and ININ (grant CA-607). The authors thanks Dr M. A. Romero-Romo for his valuable support in the revision of the manuscript.References
- R. Pérez-Hernández, et al., Hydrogen Production by Steam Reforming of Methanol Over a Ag/ZnO One Dimensional Catalyst, Adv. Mater. Res., 2010, 132, 205–219 Search PubMed.
- R. Pérez-Hernández, A. D. Avendaño, E. Rubio and V. Rodríguez-Lugo, Hydrogen Production by Methanol Steam Reforming Over Pd/ZrO2–TiO2 Catalysts, Top. Catal., 2011, 54, 572–578 CrossRef.
- M. Lenarda, et al., Finely dispersed Pd-Zn catalyst supported on an organized mesoporous alumina for hydrogen production by methanol steam reforming, Appl. Catal., A, 2006, 312, 220–228 CrossRef CAS.
- D. G. Araiza, A. Gómez-Cortés and G. Díaz, Partial oxidation of methanol over copper supported on nanoshaped ceria for hydrogen production, Catal. Today, 2017, 282, 185–194 CrossRef CAS.
- J. Agrell, G. Germani, S. G. Jaras and M. Boutonnet, Production of hydrogen by partial oxidation of methanol over ZnO-supported palladium catalysts prepared by microemulsion technique, Appl. Catal., A, 2003, 242, 233–245 CrossRef CAS.
- R. Pérez-Hernández, A. Gutiérrez-Martínez and C. E. Gutiérrez-Wing, Effect of Cu loading on CeO2 for hydrogen production by oxidative steam reforming of methanol, Int. J. Hydrogen Energy, 2007, 32, 2888–2894 CrossRef.
- R. Pérez-Hernández, et al., Synthesis and characterization of bimetallic Cu-Ni/ZrO2 nanocatalysts: H2 production by oxidative steam reforming of methanol, Int. J. Hydrogen Energy, 2008, 33, 4569–4576 CrossRef.
- R. Pérez-Hernández, L. C. Longoria, J. Palacios, M. M. Aguila and V. Rodríguez, Oxidative steam reforming of methanol for hydrogen production over Cu/CeO2-ZrO2 catalysts, Energy Mater., 2008, 3, 152–157 CrossRef.
- R. Pérez-Hernández, A. Gutiérrez-Martínez, J. Palacios, M. Vega-Hernández and V. Rodríguez-Lugo, Hydrogen production by oxidative steam reforming of methanol over Ni/CeO2-ZrO2 catalysts, Int. J. Hydrogen Energy, 2011, 36, 6601–6608 CrossRef.
- P. López, et al., Hydrogen production from oxidative steam reforming of methanol: Effect of the Cu and Ni impregnation on ZrO2 and their molecular simulation studies, Int. J. Hydrogen Energy, 2012, 37, 9018–9027 CrossRef.
- R. Perez-Hernandez, D. Mendoza-Anaya, A. Gutierrez and A. Gomez-Cortes, Catalytic Steam Reforming of Methanol to Produce Hydrogen on Supported Metal Catalysts, in Hydrogen Energy - Challenges and Perspectives, ed. D. Minic, InTech, 2012, vol. 149–174, DOI:10.5772/49965.
- R. Pérez-Hernández, et al., Ag nanowires as precursors to synthesize novel Ag-CeO2 nanotubes for H2 production by methanol reforming, Catal. Today, 2013, 212, 225–231 CrossRef.
- R. Pérez-Hernández, G. Mondragón-Galicia, A. Allende Maravilla and J. Palacios, Nano-dimensional CeO2 nanorods for high Ni loading catalysts: H2 production by autothermal steam reforming of methanol reaction, Phys. Chem. Chem. Phys., 2013, 15, 12702 RSC.
- R. Pérez-Hernández, A. Gutiérrez-Martínez, M. E. Espinosa-Pesqueira, M. L. Estanislao and J. Palacios, Effect of the bimetallic Ni/Cu loading on the ZrO2 support for H2 production in the autothermal steam reforming of methanol, Catal. Today, 2015, 250, 166–172 CrossRef.
- T. S. Moraes, R. C. R. Neto, M. C. Ribeiro, L. V. Mattos, M. Kourtelesis, S. Ladas, X. Verykios and F. B. Noronha, The study of the performance of PtNi/CeO2–nanocube catalysts for low temperature steam reforming of ethanol, Catal. Today, 2015, 242, 35–49 CrossRef CAS.
- T. S. Moraes, R. C. R. Neto, M. C. Ribeiro, L. V. Mattos, M. Kourtelesis, S. Ladas, X. Verykios and F. B. Noronha, Ethanol conversion at low temperature over CeO2—supported Ni-based catalysts. Effect of Pt addition to Ni catalyst, Appl. Catal., B, 2016, 181, 754–768 CrossRef CAS.
- D. V. Cesar, G. F. Santori, F. Pompeo, M. A. Baldanza, C. A. Henriques, E. Lombardo, M. Schmal, L. Cornaglia and N. N. Nichio, Hydrogen production from ethylene glycol reforming catalyzed by Ni and Ni-Pt hydrotalcite-derived catalysts, Int. J. Hydrogen Energy, 2016, 41, 22000–22008 CrossRef CAS.
- N. Iwasa, T. Mayanagi, N. Ogawa, K. Sakata and N. Takezawa, New catalytic functions of Pd–Zn, Pd–Ga, Pd–In, Pt–Zn, Pt–Ga and Pt–In alloys in the conversions of methanol, Catal. Lett., 1998, 54, 119–123 CrossRef CAS.
- X. K. Gu, et al., Supported single Pt1/Au1 atoms for methanol steam reforming, ACS Catal., 2014, 4, 3886–3890 CrossRef CAS.
- F. Ammari, J. Lamotte and R. Touroude, An emergent catalytic material: Pt/ZnO catalyst for selective hydrogenation of crotonaldehyde, J. Catal., 2004, 221, 32–42 CrossRef CAS.
- N. Iwasa and N. Takezawa, New Supported Pd and Pt Alloy Catalysts for Steam Reforming and Dehydrogenation of Methanol, Top. Catal., 2003, 22, 215–224 CrossRef CAS.
- N. Iwasa, S. Masuda, N. Ogawa and N. Takezawa, Steam reforming of methanol over Pd/ZnO: effect of the formation of PdZn alloys upon the reaction, Appl. Catal., A, 1995, 125, 145–157 CrossRef CAS.
- N. Iwasa, S. Masuda and N. Takezawa, Steam reforming of methanol over Ni, Co, Pd and Pt supported on ZnO, React. Kinet. Catal. Lett., 1995, 55, 349–353 CrossRef CAS.
- L. Arroyo-Ramírez, C. Chen, M. Cargnello, C. B. Murray, P. Fornasiero and R. J. Gorte, Supported platinum–zinc oxide core–shell nanoparticle catalysts for methanol steam reforming, J. Mater. Chem. A, 2014, 2, 19509–19514 RSC.
- N. Iwasa, M. Yoshikawa, W. Nomura and M. Arai, Transformation of methanol in the presence of steam and oxygen over ZnO-supported transition metal catalysts under stream reforming conditions, Appl. Catal., A, 2005, 292, 215–222 CrossRef CAS.
- D. Wang, F. Ammari, R. Touroude, D. S. Su and R. Schlögl, Promotion effect in Pt–ZnO catalysts for selective hydrogenation of crotonaldehyde to crotyl alcohol: a structural investigation, Catal. Today, 2009, 147, 224–230 CrossRef CAS.
- X. Li, et al., Effect of Zn doping on the hydrogenolysis of glycerol over ZnNiAl Catalyst, J. Mol. Catal. A: Chem., 2014, 395, 1–6 CrossRef CAS.
- B. Ouyang, W. Tan and B. Liu, Morphology effect of nanostructure ceria on the Cu/CeO2 catalysts for synthesis of methanol from CO2 hydrogenation, Catal. Commun., 2017, 95, 36–39 CrossRef CAS.
- A. Romero-Núñez and G. Díaz, High oxygen storage capacity and enhanced catalytic performance of NiO/NixCe1−O2−δ nanorods: synergy between Ni-doping and 1D morphology, RSC Adv., 2015, 5, 54571–54579 RSC.
- J. Hu, et al., Shape Effect of ZnO Crystals as Cocatalyst in Combined Reforming–Hydrogenolysis of Glycerol, ACS Catal., 2013, 3, 2280–2287 CrossRef CAS.
- H. Zhang, et al., Influence of ZnO facets on Pd/ZnO catalysts for methanol steam reforming, ACS Catal., 2014, 4, 2379–2386 CrossRef CAS.
- M. P. Hyman, V. M. Lebarbier, Y. Wang, A. K. Datye and J. M. Vohs, A Comparison of the reactivity of Pd supported on ZnO(100) and ZnO(0001), J. Phys. Chem. C, 2009, 113, 7251–7259 CrossRef CAS.
- X. Du, D. Zhang, L. Shi, R. Gao and J. Zhang, Morphology Dependence of Catalytic Properties of Ni/CeO2 Nanostructures for Carbon Dioxide Reforming of Methane, J. Phys. Chem. C, 2012, 116, 10009–10016 CrossRef CAS.
- V. Subramanian, et al., Synthesis of a Novel Nano-Sized Pt/ZnO Catalyst for Water Gas Shift Reaction in Medium Temperature Application, Catal. Lett., 2012, 142, 1075–1081 CrossRef CAS.
- H. Kumagai, Y. Sakamoto, H. Takeda, S. Matsunaga and M. Ohba, An Effective Synthetic Process for Pt-ZnO Composite and PtZn Alloy Using Spherical Coordination Polymer Particles as Precursors, Chem. Lett., 2017, 46, 1112–1115 CrossRef CAS.
- H. Koga, T. Kitaoka and H. Wariishi, In situ synthesis of Cu nanocatalysts on ZnO whiskers embedded in a microstructured paper composite for autothermal hydrogen production, Chem. Commun., 2008, 5616–5618, 10.1039/b812216d.
- L. Mo, X. Zheng and C.-T. Yeh, A Novel CeO2/ZnO Catalyst for Hydrogen Production from the Partial Oxidation of Methanol, ChemPhysChem, 2005, 6, 1470–1472 CrossRef CAS.
- S. Ito, et al., Steam reforming of methanol over Pt-Zn alloy catalyst supported on carbon black, Catal. Commun., 2003, 4, 499–503 CrossRef CAS.
- V. Palma, E. Palo, F. Castaldo, P. Ciambelli and G. Iaquaniello, Catalytic activity of CeO2 supported Pt-Ni and Pt-Co catalysts in the low temperature bio-ethanol steam reforming, Chem. Eng. Trans., 2011, 25, 947–952 Search PubMed.
- V. Palma, F. Castaldo, P. Ciambelli and G. Iaquaniello, Bio-ethanol steam reforming reaction over bimetallic ceria-supported catalysts, Chem. Eng. Trans., 2012, 29, 109–114 CrossRef.
- A. M. Karim, T. Conant and A. K. Datye, Controlling ZnO morphology for improved methanol steam reforming reactivity, Phys. Chem. Chem. Phys., 2008, 10, 5584 RSC.
Footnote |
| † Electronic supplementary information (ESI) available. See DOI: 10.1039/d0ra06181f |
| This journal is © The Royal Society of Chemistry 2020 |