 Open Access Article
Improving the all-polymer solar cell performance by adding a narrow bandgap polymer as the second donor†
Kai Wanga,
Sheng Dong*b,
Xudong Chenc,
Ping Zhouc,
Kai Zhang b,
Jun Huang*a and
Ming Wang
 *a
*a
aCenter for Advanced Low-Dimension Materials, State Key Laboratory for Modification of Chemical Fibers and Polymer Materials, College of Materials Science and Engineering, Donghua University, Shanghai 201620, China. E-mail: mwang@dhu.edu.cn; huangj@dhu.edu.cn
bInstitute of Polymer Optoelectronic Materials & Devices, State Key Laboratory of Luminescent Materials and Devices, South China University of Technology, Guangzhou 510640, China. E-mail: dongsheng5175000@126.com
cShanghai International College of Design & Innovation, Tongji University, Shanghai 200080, China
First published on 19th October 2020
Abstract
Ternary all-polymer solar cells are fabricated using an N2200 acceptor and two donor polymers (PF2 and PM2) with complementary absorption. The major donor PF2 is a relatively wide bandgap polymer that contributes the most photon absorption in the UV-vis region while the second donor PM2 improves the light harvesting due to its strong absorption in the near-IR region. By carefully tuning the ratio of two donor polymers, the best ratio of 9![[thin space (1/6-em)]](https://www.rsc.org/images/entities/char_2009.gif) :
:![[thin space (1/6-em)]](https://www.rsc.org/images/entities/char_2009.gif) 1
1![[thin space (1/6-em)]](https://www.rsc.org/images/entities/char_2009.gif) :
:![[thin space (1/6-em)]](https://www.rsc.org/images/entities/char_2009.gif) 5 (PF2
5 (PF2![[thin space (1/6-em)]](https://www.rsc.org/images/entities/char_2009.gif) :
:![[thin space (1/6-em)]](https://www.rsc.org/images/entities/char_2009.gif) PM2
PM2![[thin space (1/6-em)]](https://www.rsc.org/images/entities/char_2009.gif) :
:![[thin space (1/6-em)]](https://www.rsc.org/images/entities/char_2009.gif) N2200) is achieved and shows a PCE of 6.90%, which is better than two binary devices. This work demonstrates an effective strategy of utilizing a narrow bandgap donor polymer as the second donor to improve the performance of all-polymer solar cells.
N2200) is achieved and shows a PCE of 6.90%, which is better than two binary devices. This work demonstrates an effective strategy of utilizing a narrow bandgap donor polymer as the second donor to improve the performance of all-polymer solar cells.
Introduction
Tremendous efforts have been devoted in solution-processed polymer solar cells (PSCs) in the past decades because of their advantages of low-cost, light-weight, flexibility and large-area production.1 It is reported that the record power conversion efficiency (PCE) is up to ∼18%.2,3 High performance PSCs usually employ a bulk heterojunction (BHJ) architecture, where a narrow bandgap polymer donor (PD) is used as a p-type component and a small molecule or polymer acceptor (SMA or PA) is used as the n-type component.4–6 The combination of PD and PA (all-PSC) exhibits excellent film processing properties, and superior thermal and mechanical stability, which are essential for practical applications.7,8 However, the reported highest PCE of all-PSCs is still significantly lower than that of PSCs using SMAs.9 One reason is the absence of high-efficiency narrow bandgap PAs that could utilize the photons effectively in the near-IR region (700–1000 nm), which has been successfully achieved in SMA PSCs.10–13 Currently, poly{[N,N′-bis(2-octyldodecyl)naphthalene-1,4,5,8-bis(dicarboximide)-2,6-diyl]-alt-5,5′-(2,2′-bithiophene)} (N2200) is still one of the best PAs due to its high electron mobility, narrow bandgap and excellent compatibility with varieties of PAs.14–21 Though N2200 thin film displays a relatively wide absorption range of 300–900 nm, the absorption coefficient is dramatically smaller than those high-performance narrow bandgap SMAs in the near-IR region, such as ITIC10 and Y6.11 Since the typical high-performance PDs have relatively wider bandgap than N2200,22 the weak light absorption of N2200 would lead to low EQEs in the near-IR region in comparison to UV-vis region. How to utilize photons in the near-IR region efficiently remains a challenge for all-PSCs. Either developing new narrow bandgap polymers23–28 or device fabrication technics29 are needed in future.In this manuscript, we demonstrate a ternary all-PSC strategy to improving the PCEs by enhancing the absorption in the near-IR region with the loading of second donor. As shown in Scheme 1, three polymers (namely PF2, PM2 and N2200) are studied in the devices. It is worth noting that the chemical structures of PF2 and PM2 have a same benzodithiophene (BDT) building block. PF2 is a relatively wide bandgap polymer in comparison with N2200, which is similar to J51.17 PM2 is a relatively narrow bandgap polymer which displayed low energy loss in PSCs with SMAs.30 We first fabricated binary all-PSCs using PF2/N2200 and PM2/N2200 respectively. PF2/N2200 devices exhibited a decent PCE of 6.24% but low EQEs in the range of 600–900 nm. PM2/N2200 displayed better EQEs in the near-IR range but a relatively low PCE of 3.54%. Then PM2 is added into PF2:N2200 blend layer proportionally as the second donor. Finally, the ternary device with a polymer ratio of 1/9/5 (PM2/PF2/N2200) shows an improved PCE of 6.90%, mainly due to the improvement of light absorption in the near-IR range.
Results and discussion
UV-vis absorption
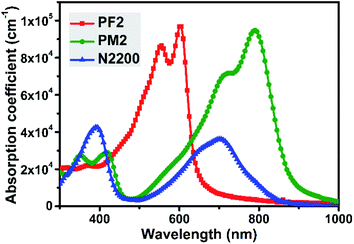
Fig. 1 showed the thin film UV-vis spectra of three polymers. PF2 exhibits an intramolecular charge transfer (ICT) peak at ca. 555 nm and a shoulder at ca. 605 nm, which indicates the strong intermolecular interaction duo to π–π stacking. The maximum absorption coefficient of PF2 is 9.7 × 104 cm−1. For PM2 thin film, the ICT peak together with the shoulder are around 730 nm and 790 nm, which shows the maximum absorption coefficient of 9.5 × 104 cm−1. It is noted that the narrow bandgap of PM2 is attributed to the strong electron-deficient nature of PT building block.31–33 For N2200, it is observed that the maximum absorption peak locates at ca. 390 nm with an absorption coefficient of 4.3 × 104 cm−1. In the near-IR region, there is an ICT peak together with a shoulder around 700 nm, which gives an absorption coefficient of 3.6 × 104 cm−1. Both peaks' absorption coefficient values of N2200 are dramatically less than those values of PF2 and PM2. In addition, it is clear that PF2 and PM2 show complementary absorption spectra, and PM2 could absorb more photons in the near-IR region than N2200. The complementary absorption feature of above three polymers imply that ternary blend film might be an option to improve the photon absorption from 300 nm to 900 nm than the binary blend films.Energy levels
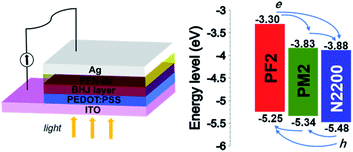
The energy levels of donor and acceptor are crucial for PSCs, which should provide the driving force at the D/A interface for holes and electrons separation and transport. We measured their ionization potential and electron affinity by cyclic voltammetry in the thin film state, which approximately represent their HOMO and LUMO to simplify the discussion.34,35 As shown in Fig. 2, N2200 shows the deepest HOMO (−5.48 eV) and LUMO (−3.88 eV) among three polymers, which allows the charge separation in the PM2/N2200 and PF2/N2200 interface. For PF2 and PM2 polymers, the HOMO of PM2 is −5.34 eV, which is slightly deeper than that of PF2 (−5.25 eV); the LUMO of PM2 is −3.83 eV, which is significantly deeper than that of PF2 (−3.30 eV). This phenomenon implies that the electrons of PF2 could transport to N2200 directly or through PM2, and the holes of N2200 could transport to PF2 directly or through PM2. Overall, PF2–PM2–N2200 system forms an energy cascade model of in the blend film that allows both charge separation and transport properly in PSCs.36–39Solar cell device fabrication
Since both complementary absorption and energy cascade suggest that ternary solar cells is a possible strategy based on these three polymers, we then fabricated all-polymer solar cells to examine the idea with a conventional configuration of ITO/PEDOT:PSS/active layer/PFN-Br/Ag (PEDOT:PSS, poly(3,4-ethylenedioxythiophene) polystyrene sulfonate; PFN-Br, poly(9,9-bis(3′-(N,N-dimethyl)-N-ethylammonium-propyl-2,7-fluorene)-alt-2,7-(9,9-dioctylfluorene))dibromide).40 The optimal active layer thickness is about 100 nm.The binary device of PF2:N2200 was firstly fabricated. The optimized condition is under the D![[thin space (1/6-em)]](https://www.rsc.org/images/entities/char_2009.gif) :
:![[thin space (1/6-em)]](https://www.rsc.org/images/entities/char_2009.gif) A ratio of 10
A ratio of 10![[thin space (1/6-em)]](https://www.rsc.org/images/entities/char_2009.gif) :
:![[thin space (1/6-em)]](https://www.rsc.org/images/entities/char_2009.gif) 5 using chlorobenzene (CB) as the solvent with 1,8-diiodooctane additive (DIO, 1% volume). As a result, the best PF2:N2200 device achieved a Jsc of 11.85 mA cm−2, a Voc of 0.83 V, an FF of 0.64, and finally give the best PCE of 6.24%. For PM2:N2200 devices, the best PCE is 3.54% under the similar processing condition with a Jsc of 9.22 mA cm−2, a Voc of 0.85 V, an FF of 0.45. Fig. 3b provided their EQE curves. One can clearly see the EQE values in the UV-visible light region (300–625 nm) of PF2:N2200 device is substantially greater than those of PM2:N2200 device. But in the near-IR region (>625 nm), the PM2:N2200 device is better. Especially for the region of 800–900 nm, most of electrons are contributed by the absorbance of PM2 since the absorbance of PF2 is very weak here. These difference in the EQE is almost represented in their blend absorption spectra, as shown in Fig. 3c. In addition, it is also noted that PM2:N2200 exhibited a low energy loss of 0.53 eV (Eloss, defined as Eloss = Eoptg − eVoc, where Eoptg is refer to the optical bandgap of blend film).41,42 The low Eloss feature of PM2 devices imply that PM2 would be a suitable narrow bandgap donor in the ternary system, which contribute Jsc without decreasing Voc.
5 using chlorobenzene (CB) as the solvent with 1,8-diiodooctane additive (DIO, 1% volume). As a result, the best PF2:N2200 device achieved a Jsc of 11.85 mA cm−2, a Voc of 0.83 V, an FF of 0.64, and finally give the best PCE of 6.24%. For PM2:N2200 devices, the best PCE is 3.54% under the similar processing condition with a Jsc of 9.22 mA cm−2, a Voc of 0.85 V, an FF of 0.45. Fig. 3b provided their EQE curves. One can clearly see the EQE values in the UV-visible light region (300–625 nm) of PF2:N2200 device is substantially greater than those of PM2:N2200 device. But in the near-IR region (>625 nm), the PM2:N2200 device is better. Especially for the region of 800–900 nm, most of electrons are contributed by the absorbance of PM2 since the absorbance of PF2 is very weak here. These difference in the EQE is almost represented in their blend absorption spectra, as shown in Fig. 3c. In addition, it is also noted that PM2:N2200 exhibited a low energy loss of 0.53 eV (Eloss, defined as Eloss = Eoptg − eVoc, where Eoptg is refer to the optical bandgap of blend film).41,42 The low Eloss feature of PM2 devices imply that PM2 would be a suitable narrow bandgap donor in the ternary system, which contribute Jsc without decreasing Voc.
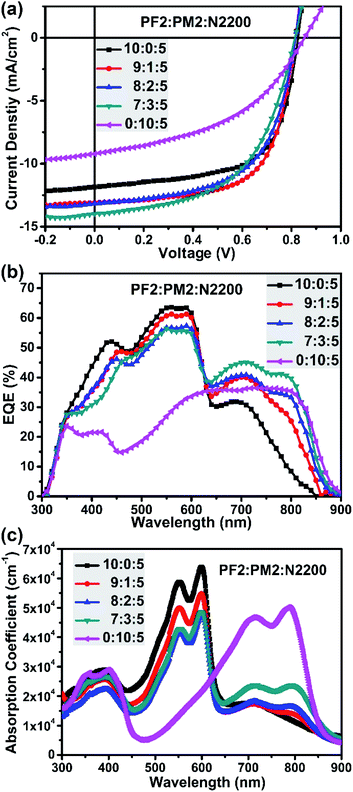 | ||
| Fig. 3 (a) Device J–V curves; (b) device EQE curves; (c) blend film absorption with different polymer ratios. | ||
Since the PF2:N2200 device showed a better PCE than PM2:N2200 device, we then fabricated ternary devices by directly adding PM2 proportionally into the optimal PF2:N2200 blend film to systematically evaluate the influence of PM2 in the ternary system, such as the strong absorption coefficient in the near-IR region and low energy loss. The total D/A ratio is kept as 10![[thin space (1/6-em)]](https://www.rsc.org/images/entities/char_2009.gif) :
:![[thin space (1/6-em)]](https://www.rsc.org/images/entities/char_2009.gif) 5 and CB/DIO (DIO, 1%) mixed-solvent system is used. As shown in Table 1, a significantly improved PCE of 6.90% is achieved for PF2
5 and CB/DIO (DIO, 1%) mixed-solvent system is used. As shown in Table 1, a significantly improved PCE of 6.90% is achieved for PF2![[thin space (1/6-em)]](https://www.rsc.org/images/entities/char_2009.gif) :
:![[thin space (1/6-em)]](https://www.rsc.org/images/entities/char_2009.gif) PM2
PM2![[thin space (1/6-em)]](https://www.rsc.org/images/entities/char_2009.gif) :
:![[thin space (1/6-em)]](https://www.rsc.org/images/entities/char_2009.gif) N2200-based ternary devices at the ratio of 9
N2200-based ternary devices at the ratio of 9![[thin space (1/6-em)]](https://www.rsc.org/images/entities/char_2009.gif) :
:![[thin space (1/6-em)]](https://www.rsc.org/images/entities/char_2009.gif) 1
1![[thin space (1/6-em)]](https://www.rsc.org/images/entities/char_2009.gif) :
:![[thin space (1/6-em)]](https://www.rsc.org/images/entities/char_2009.gif) 5, which gives a Voc of 0.82 V, a Jsc of 13.10 mA cm−2 and the same FF of 0.65. The improvement of PCE is attributed to the enhancement of the Jsc. When increasing the PM2 weight fraction at the polymer ratio of 8
5, which gives a Voc of 0.82 V, a Jsc of 13.10 mA cm−2 and the same FF of 0.65. The improvement of PCE is attributed to the enhancement of the Jsc. When increasing the PM2 weight fraction at the polymer ratio of 8![[thin space (1/6-em)]](https://www.rsc.org/images/entities/char_2009.gif) :
:![[thin space (1/6-em)]](https://www.rsc.org/images/entities/char_2009.gif) 2
2![[thin space (1/6-em)]](https://www.rsc.org/images/entities/char_2009.gif) :
:![[thin space (1/6-em)]](https://www.rsc.org/images/entities/char_2009.gif) 5, the Jsc is 13.18 mA cm−2 and Voc is 0.82 V, which are almost identical as the ratio of 9
5, the Jsc is 13.18 mA cm−2 and Voc is 0.82 V, which are almost identical as the ratio of 9![[thin space (1/6-em)]](https://www.rsc.org/images/entities/char_2009.gif) :
:![[thin space (1/6-em)]](https://www.rsc.org/images/entities/char_2009.gif) 1
1![[thin space (1/6-em)]](https://www.rsc.org/images/entities/char_2009.gif) :
:![[thin space (1/6-em)]](https://www.rsc.org/images/entities/char_2009.gif) 5. However, the FF decreases to 0.59, and finally results a PCE of 6.37%. When further increasing the PM2 weight fraction at the polymer ratio of 7
5. However, the FF decreases to 0.59, and finally results a PCE of 6.37%. When further increasing the PM2 weight fraction at the polymer ratio of 7![[thin space (1/6-em)]](https://www.rsc.org/images/entities/char_2009.gif) :
:![[thin space (1/6-em)]](https://www.rsc.org/images/entities/char_2009.gif) 3
3![[thin space (1/6-em)]](https://www.rsc.org/images/entities/char_2009.gif) :
:![[thin space (1/6-em)]](https://www.rsc.org/images/entities/char_2009.gif) 5, the Jsc improves to 13.99 mA cm−2, the Voc keeps the same and the FF decreases to 0.55. Overall, the PCE drops to 6.23%. In addition, it is interesting that all ternary devices achieved a similar Voc of 0.83 V, which is independent with the weight fraction of PM2 and almost identical to value of PF2:N2200 binary device. This phenomenon implies that the ternary devices form a cascade model and the Voc is up to offset between N2200 and the donor with upper HOMO level. Though we designed two donor polymers with the same BDT building blocks, the polymer alloy was not formed according to the Voc values of ternary devices.39
5, the Jsc improves to 13.99 mA cm−2, the Voc keeps the same and the FF decreases to 0.55. Overall, the PCE drops to 6.23%. In addition, it is interesting that all ternary devices achieved a similar Voc of 0.83 V, which is independent with the weight fraction of PM2 and almost identical to value of PF2:N2200 binary device. This phenomenon implies that the ternary devices form a cascade model and the Voc is up to offset between N2200 and the donor with upper HOMO level. Though we designed two donor polymers with the same BDT building blocks, the polymer alloy was not formed according to the Voc values of ternary devices.39
| Ratio | Jsca (mA cm−2) | Voc (V) | FF | PCEb (%) |
|---|---|---|---|---|
| a Numbers in parentheses are Jsc calculated from the EQE.b Numbers in parentheses are the average PCEs. | ||||
10![[thin space (1/6-em)]](https://www.rsc.org/images/entities/char_2009.gif) : :![[thin space (1/6-em)]](https://www.rsc.org/images/entities/char_2009.gif) 0 0![[thin space (1/6-em)]](https://www.rsc.org/images/entities/char_2009.gif) : :![[thin space (1/6-em)]](https://www.rsc.org/images/entities/char_2009.gif) 5 5 |
11.85 (11.17) | 0.83 | 0.64 | 6.24 (6.18) |
9![[thin space (1/6-em)]](https://www.rsc.org/images/entities/char_2009.gif) : :![[thin space (1/6-em)]](https://www.rsc.org/images/entities/char_2009.gif) 1 1![[thin space (1/6-em)]](https://www.rsc.org/images/entities/char_2009.gif) : :![[thin space (1/6-em)]](https://www.rsc.org/images/entities/char_2009.gif) 5 5 |
13.10 (12.27) | 0.82 | 0.65 | 6.90 (6.71) |
8![[thin space (1/6-em)]](https://www.rsc.org/images/entities/char_2009.gif) : :![[thin space (1/6-em)]](https://www.rsc.org/images/entities/char_2009.gif) 2 2![[thin space (1/6-em)]](https://www.rsc.org/images/entities/char_2009.gif) : :![[thin space (1/6-em)]](https://www.rsc.org/images/entities/char_2009.gif) 5 5 |
13.18 (12.47) | 0.82 | 0.59 | 6.37 (6.34) |
7![[thin space (1/6-em)]](https://www.rsc.org/images/entities/char_2009.gif) : :![[thin space (1/6-em)]](https://www.rsc.org/images/entities/char_2009.gif) 3 3![[thin space (1/6-em)]](https://www.rsc.org/images/entities/char_2009.gif) : :![[thin space (1/6-em)]](https://www.rsc.org/images/entities/char_2009.gif) 5 5 |
13.99 (13.06) | 0.82 | 0.55 | 6.23 (6.20) |
0![[thin space (1/6-em)]](https://www.rsc.org/images/entities/char_2009.gif) : :![[thin space (1/6-em)]](https://www.rsc.org/images/entities/char_2009.gif) 10 10![[thin space (1/6-em)]](https://www.rsc.org/images/entities/char_2009.gif) : :![[thin space (1/6-em)]](https://www.rsc.org/images/entities/char_2009.gif) 5 5 |
9.22 (9.06) | 0.85 | 0.45 | 3.54 (3.39) |
Fig. 3b provide the EQE curves of ternary devices. It is clear that these EQE curves could be divided into two regions. In the UV-visible light region (300–625 nm), the EQE values decreased gradually when increasing the fraction of PM2, which is reasonable since the main UV-vis absorber fraction (PF2) is decreased. In the near-IR region (625–900 nm), the EQE values increased gradually when increasing the weight fraction of PM2. The overall effect shows that the Jsc is improved when adding PM2 as the second donor. As shown in Fig. 3c, similar trend could be found in their blend film absorption spectra. However, the FF of ternary devices were also suffered when PM2 fraction is more than 10% in total donor component. Finally, the balanced ratio is achieved at the polymer ratio of 9![[thin space (1/6-em)]](https://www.rsc.org/images/entities/char_2009.gif) :
:![[thin space (1/6-em)]](https://www.rsc.org/images/entities/char_2009.gif) 1
1![[thin space (1/6-em)]](https://www.rsc.org/images/entities/char_2009.gif) :
:![[thin space (1/6-em)]](https://www.rsc.org/images/entities/char_2009.gif) 5.
5.
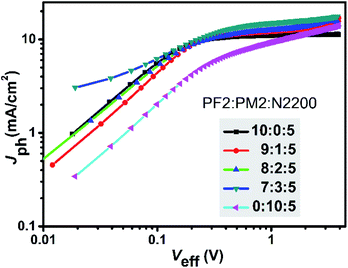
To have a deep insight of the exciton generation and dissociation processes, photocurrent density (Jph) versus effective voltage (Veff) curves of the five devices were investigated. Fig. 4 provides the Jph–Veff curves of five devices. Here, Jph is defined as Jph = JL − JD, where JL and JD are the current density under AM1.5G light illumination and in dark, respectively. Veff is defined as Veff = V0 − Va, where V0 corresponds to the voltage when Jph is equal to zero, and Va is the applied voltage. It is assumed that all photogenerated excitons could be dissociated into free charges and then collected by two electrodes at high Veff.36 Therefore, the saturated current density (Jsat) is dominated by the maximum exciton generation rate (Gmax) and follows the equation of Jsat = qLGmax, where q is elementary charge and L is the active layer thickness. For PF2:N2200 device, the Gmax value was 6.78 × 1027 m−3 s−1 that was calculated at Veff = 2.0 V. For ternary devices, their Gmax values were calculated at the similar Veff and were 7.75 × 1027 m−3 s−1 (9![[thin space (1/6-em)]](https://www.rsc.org/images/entities/char_2009.gif) :
:![[thin space (1/6-em)]](https://www.rsc.org/images/entities/char_2009.gif) 1
1![[thin space (1/6-em)]](https://www.rsc.org/images/entities/char_2009.gif) :
:![[thin space (1/6-em)]](https://www.rsc.org/images/entities/char_2009.gif) 5), 7.44 × 1027 m−3 s−1 (8
5), 7.44 × 1027 m−3 s−1 (8![[thin space (1/6-em)]](https://www.rsc.org/images/entities/char_2009.gif) :
:![[thin space (1/6-em)]](https://www.rsc.org/images/entities/char_2009.gif) 2
2![[thin space (1/6-em)]](https://www.rsc.org/images/entities/char_2009.gif) :
:![[thin space (1/6-em)]](https://www.rsc.org/images/entities/char_2009.gif) 5), 8.70 × 1027 m−3 s−1 (7
5), 8.70 × 1027 m−3 s−1 (7![[thin space (1/6-em)]](https://www.rsc.org/images/entities/char_2009.gif) :
:![[thin space (1/6-em)]](https://www.rsc.org/images/entities/char_2009.gif) 3
3![[thin space (1/6-em)]](https://www.rsc.org/images/entities/char_2009.gif) :
:![[thin space (1/6-em)]](https://www.rsc.org/images/entities/char_2009.gif) 5), respectively. For PM2:N2200 device, Gmax was not obtained as the current density was not saturated. It is clear that the exciton generation rates of ternary devices are faster than PF2:N2200 device. Meanwhile, the charge collection efficiency could be evaluated by Jph/Jsat value at the maximal power output condition. For PF2:N2200 device, Jph/Jsat was 98.1%, which was higher than that of ternary devices (92.5% at the ratio of 9
5), respectively. For PM2:N2200 device, Gmax was not obtained as the current density was not saturated. It is clear that the exciton generation rates of ternary devices are faster than PF2:N2200 device. Meanwhile, the charge collection efficiency could be evaluated by Jph/Jsat value at the maximal power output condition. For PF2:N2200 device, Jph/Jsat was 98.1%, which was higher than that of ternary devices (92.5% at the ratio of 9![[thin space (1/6-em)]](https://www.rsc.org/images/entities/char_2009.gif) :
:![[thin space (1/6-em)]](https://www.rsc.org/images/entities/char_2009.gif) 1
1![[thin space (1/6-em)]](https://www.rsc.org/images/entities/char_2009.gif) :
:![[thin space (1/6-em)]](https://www.rsc.org/images/entities/char_2009.gif) 5, 91.4% at the ratio of 8
5, 91.4% at the ratio of 8![[thin space (1/6-em)]](https://www.rsc.org/images/entities/char_2009.gif) :
:![[thin space (1/6-em)]](https://www.rsc.org/images/entities/char_2009.gif) 2
2![[thin space (1/6-em)]](https://www.rsc.org/images/entities/char_2009.gif) :
:![[thin space (1/6-em)]](https://www.rsc.org/images/entities/char_2009.gif) 5 and 89.9% at the ratio of 7
5 and 89.9% at the ratio of 7![[thin space (1/6-em)]](https://www.rsc.org/images/entities/char_2009.gif) :
:![[thin space (1/6-em)]](https://www.rsc.org/images/entities/char_2009.gif) 3
3![[thin space (1/6-em)]](https://www.rsc.org/images/entities/char_2009.gif) :
:![[thin space (1/6-em)]](https://www.rsc.org/images/entities/char_2009.gif) 5). The result shows that the charge collections in ternary devices are worse than that in PF2:N2200 devices, indicating a negative effect of PM2 loading. In conclusion, the ternary devices have better exciton generation efficiency but exhibit lower charge collection efficiencies and more bimolecular recombination than PF2:N2200 device.
5). The result shows that the charge collections in ternary devices are worse than that in PF2:N2200 devices, indicating a negative effect of PM2 loading. In conclusion, the ternary devices have better exciton generation efficiency but exhibit lower charge collection efficiencies and more bimolecular recombination than PF2:N2200 device.
SCLC mobility measurements
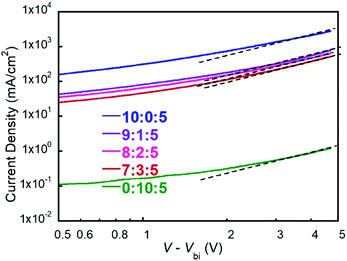
Previous studies have revealed that the charge carrier mobility is highly correlated with FF.43,44 To investigate the FF variations in above ternary devices, we measured the hole mobility of five devices by space-charge-limited current (SCLC) method.45,46 The hole-only diodes were fabricated with the device structure of ITO/PEDOT:PSS/active layer/MoO3/Ag, and the J–V curves are shown in Fig. 5. It is obvious that the hole mobilities are gradually decreased during the increasing of PM2 ratio in the blend, which shows a similar trend of the FF values. For 10![[thin space (1/6-em)]](https://www.rsc.org/images/entities/char_2009.gif) :
:![[thin space (1/6-em)]](https://www.rsc.org/images/entities/char_2009.gif) 0
0![[thin space (1/6-em)]](https://www.rsc.org/images/entities/char_2009.gif) :
:![[thin space (1/6-em)]](https://www.rsc.org/images/entities/char_2009.gif) 5 and 9
5 and 9![[thin space (1/6-em)]](https://www.rsc.org/images/entities/char_2009.gif) :
:![[thin space (1/6-em)]](https://www.rsc.org/images/entities/char_2009.gif) 1
1![[thin space (1/6-em)]](https://www.rsc.org/images/entities/char_2009.gif) :
:![[thin space (1/6-em)]](https://www.rsc.org/images/entities/char_2009.gif) 5 blend films, their hole mobilities are on the order of 10−4 cm2 V−1 s−1 and the PSC devices show a high FF around 0.65. For 8
5 blend films, their hole mobilities are on the order of 10−4 cm2 V−1 s−1 and the PSC devices show a high FF around 0.65. For 8![[thin space (1/6-em)]](https://www.rsc.org/images/entities/char_2009.gif) :
:![[thin space (1/6-em)]](https://www.rsc.org/images/entities/char_2009.gif) 2
2![[thin space (1/6-em)]](https://www.rsc.org/images/entities/char_2009.gif) :
:![[thin space (1/6-em)]](https://www.rsc.org/images/entities/char_2009.gif) 5 and 7
5 and 7![[thin space (1/6-em)]](https://www.rsc.org/images/entities/char_2009.gif) :
:![[thin space (1/6-em)]](https://www.rsc.org/images/entities/char_2009.gif) 3
3![[thin space (1/6-em)]](https://www.rsc.org/images/entities/char_2009.gif) :
:![[thin space (1/6-em)]](https://www.rsc.org/images/entities/char_2009.gif) 5 blend films, their hole mobilities decrease to the order of 10−5 cm2 V−1 s−1 and the PSC devices give decent FF values of 0.55–0.59. The 0
5 blend films, their hole mobilities decrease to the order of 10−5 cm2 V−1 s−1 and the PSC devices give decent FF values of 0.55–0.59. The 0![[thin space (1/6-em)]](https://www.rsc.org/images/entities/char_2009.gif) :
:![[thin space (1/6-em)]](https://www.rsc.org/images/entities/char_2009.gif) 10
10![[thin space (1/6-em)]](https://www.rsc.org/images/entities/char_2009.gif) :
:![[thin space (1/6-em)]](https://www.rsc.org/images/entities/char_2009.gif) 5 film has the lowest hole mobility at the order of 10−6 cm2 V−1 s−1 and the device displays the lowest FF of 0.45. These results suggest that the hole transport in PM2 phase is undesirable since the mobility decreasing as the function of PM2 ratio. Therefore, FF shows a similar trend as the charge carrier mobility significantly bias the charge recombination. In conclusion, the amount of PM2 should be restricted in the ternary devices to attain a trade-off between Jsc and FF.
5 film has the lowest hole mobility at the order of 10−6 cm2 V−1 s−1 and the device displays the lowest FF of 0.45. These results suggest that the hole transport in PM2 phase is undesirable since the mobility decreasing as the function of PM2 ratio. Therefore, FF shows a similar trend as the charge carrier mobility significantly bias the charge recombination. In conclusion, the amount of PM2 should be restricted in the ternary devices to attain a trade-off between Jsc and FF.
Light intensity measurements
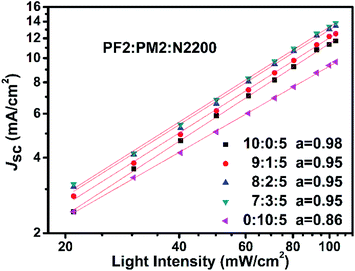
To reveal the insight of charge recombination dynamics in above PSC devices, we investigated the variations of Jsc as function of light intensity. It is reported that the light intensity (L) of Jsc in PSCs could be described as the following power relation of Jsc ∝ La.47,48 The deviation from a = 1 is typically attributed to the bimolecular recombination. When a approaches to 0.75, space charge effect must be considered. As shown in Fig. 6, all devices show clearly sub-linear dependence of Jsc on light intensity. For PM2:N2200 binary device (0![[thin space (1/6-em)]](https://www.rsc.org/images/entities/char_2009.gif) :
:![[thin space (1/6-em)]](https://www.rsc.org/images/entities/char_2009.gif) 10
10![[thin space (1/6-em)]](https://www.rsc.org/images/entities/char_2009.gif) :
:![[thin space (1/6-em)]](https://www.rsc.org/images/entities/char_2009.gif) 5), it suggests that both bimolecular recombination and the space charge effects contribute to a relatively low a of 0.86. It could be attributed to the low hole mobility of PM2 in the PM2:N2200 blend film, which is in agreement with the hole mobility measurement. For other four devices, there is bimolecular recombination but not significant since their a close to 1. Over all, it suggests that the fraction of PM2 could not be high in the blend films, as the hole transport is not desired in the PM2 phase that promote bimolecular recombination in blend films.
5), it suggests that both bimolecular recombination and the space charge effects contribute to a relatively low a of 0.86. It could be attributed to the low hole mobility of PM2 in the PM2:N2200 blend film, which is in agreement with the hole mobility measurement. For other four devices, there is bimolecular recombination but not significant since their a close to 1. Over all, it suggests that the fraction of PM2 could not be high in the blend films, as the hole transport is not desired in the PM2 phase that promote bimolecular recombination in blend films.
Morphology study
To investigate morphology changes when PM2 was loaded into the PF2:N2200 blend film, we prepared these films under the same condition in fabricating PSCs and then tested their morphologies using transmission electron microscope (TEM) in bright-field mode. Fig. 7 provides all the TEM images. The white regions represent the donor polymer domains that absorb the electron weakly, while the dark regions represent the acceptor polymer domains that could prevent the electron transmission. The white-dark contrast and domain size indicate the phase separation scale of donor and acceptor polymers. As shown in Fig. 7a, it is displayed that the donor and acceptor polymers are fine-mixed in PF2:N2200 blend films. One could roughly estimate that both PF2 and N2200 domains' sizes are below 50 nm. For the film of PF2![[thin space (1/6-em)]](https://www.rsc.org/images/entities/char_2009.gif) :
:![[thin space (1/6-em)]](https://www.rsc.org/images/entities/char_2009.gif) PM2
PM2![[thin space (1/6-em)]](https://www.rsc.org/images/entities/char_2009.gif) :
:![[thin space (1/6-em)]](https://www.rsc.org/images/entities/char_2009.gif) N2200 = 9
N2200 = 9![[thin space (1/6-em)]](https://www.rsc.org/images/entities/char_2009.gif) :
:![[thin space (1/6-em)]](https://www.rsc.org/images/entities/char_2009.gif) 1
1![[thin space (1/6-em)]](https://www.rsc.org/images/entities/char_2009.gif) :
:![[thin space (1/6-em)]](https://www.rsc.org/images/entities/char_2009.gif) 5, as shown in Fig. 7b, it is clearly displayed that the image contrast is enhanced relative to that of Fig. 7a, and the donor-rich domain (white region) size is about ∼50–100 nm, which is significantly greater than that in Fig. 7a. In Fig. 7c (PF2
5, as shown in Fig. 7b, it is clearly displayed that the image contrast is enhanced relative to that of Fig. 7a, and the donor-rich domain (white region) size is about ∼50–100 nm, which is significantly greater than that in Fig. 7a. In Fig. 7c (PF2![[thin space (1/6-em)]](https://www.rsc.org/images/entities/char_2009.gif) :
:![[thin space (1/6-em)]](https://www.rsc.org/images/entities/char_2009.gif) PM2
PM2![[thin space (1/6-em)]](https://www.rsc.org/images/entities/char_2009.gif) :
:![[thin space (1/6-em)]](https://www.rsc.org/images/entities/char_2009.gif) N2200 = 8
N2200 = 8![[thin space (1/6-em)]](https://www.rsc.org/images/entities/char_2009.gif) :
:![[thin space (1/6-em)]](https://www.rsc.org/images/entities/char_2009.gif) 2
2![[thin space (1/6-em)]](https://www.rsc.org/images/entities/char_2009.gif) :
:![[thin space (1/6-em)]](https://www.rsc.org/images/entities/char_2009.gif) 5), the phase-separation scale seems similar to that in Fig. 7b. In Fig. 7d (PF2
5), the phase-separation scale seems similar to that in Fig. 7b. In Fig. 7d (PF2![[thin space (1/6-em)]](https://www.rsc.org/images/entities/char_2009.gif) :
:![[thin space (1/6-em)]](https://www.rsc.org/images/entities/char_2009.gif) PM2
PM2![[thin space (1/6-em)]](https://www.rsc.org/images/entities/char_2009.gif) :
:![[thin space (1/6-em)]](https://www.rsc.org/images/entities/char_2009.gif) N2200 = 7
N2200 = 7![[thin space (1/6-em)]](https://www.rsc.org/images/entities/char_2009.gif) :
:![[thin space (1/6-em)]](https://www.rsc.org/images/entities/char_2009.gif) 3
3![[thin space (1/6-em)]](https://www.rsc.org/images/entities/char_2009.gif) :
:![[thin space (1/6-em)]](https://www.rsc.org/images/entities/char_2009.gif) 5), the size of donor-rich domain (white region) is over 200 nm, which is substantially greater than that in Fig. 7a–c. Moreover, the size of acceptor-rich domain (dark region) is also enhanced. For PM2:N2200 blend film, as shown in Fig. 7e, the donor-rich domain is formed clearly with the size over 200 nm, which is similar to that in Fig. 7d. In conclusion, the PF2:N2200 blend film shows the best fine-mixed morphology with a preferred size-scale for exciton diffusion. On the contrary, the PM2:N2200 film obtained the worst morphology with a large-scale phase-separation. With small amount PM2 loading (9
5), the size of donor-rich domain (white region) is over 200 nm, which is substantially greater than that in Fig. 7a–c. Moreover, the size of acceptor-rich domain (dark region) is also enhanced. For PM2:N2200 blend film, as shown in Fig. 7e, the donor-rich domain is formed clearly with the size over 200 nm, which is similar to that in Fig. 7d. In conclusion, the PF2:N2200 blend film shows the best fine-mixed morphology with a preferred size-scale for exciton diffusion. On the contrary, the PM2:N2200 film obtained the worst morphology with a large-scale phase-separation. With small amount PM2 loading (9![[thin space (1/6-em)]](https://www.rsc.org/images/entities/char_2009.gif) :
:![[thin space (1/6-em)]](https://www.rsc.org/images/entities/char_2009.gif) 1
1![[thin space (1/6-em)]](https://www.rsc.org/images/entities/char_2009.gif) :
:![[thin space (1/6-em)]](https://www.rsc.org/images/entities/char_2009.gif) 5 and 8
5 and 8![[thin space (1/6-em)]](https://www.rsc.org/images/entities/char_2009.gif) :
:![[thin space (1/6-em)]](https://www.rsc.org/images/entities/char_2009.gif) 2
2![[thin space (1/6-em)]](https://www.rsc.org/images/entities/char_2009.gif) :
:![[thin space (1/6-em)]](https://www.rsc.org/images/entities/char_2009.gif) 5), films could still maintain an acceptable phase-separation scale with interpenetrating polymer network (IPN).
5), films could still maintain an acceptable phase-separation scale with interpenetrating polymer network (IPN).
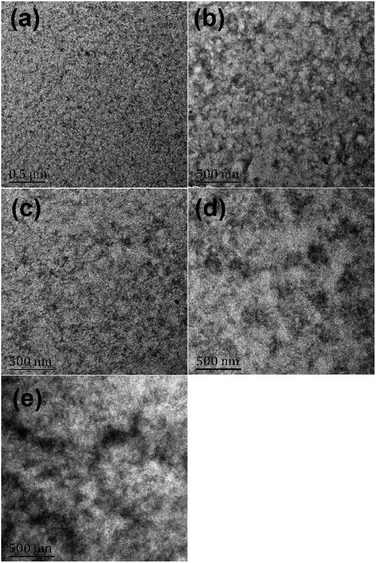 | ||
Fig. 7 TEM images of blend films with different polymer (PF2![[thin space (1/6-em)]](https://www.rsc.org/images/entities/char_2009.gif) : :![[thin space (1/6-em)]](https://www.rsc.org/images/entities/char_2009.gif) PM2 PM2![[thin space (1/6-em)]](https://www.rsc.org/images/entities/char_2009.gif) : :![[thin space (1/6-em)]](https://www.rsc.org/images/entities/char_2009.gif) N2200) ratios: (a) 10 N2200) ratios: (a) 10![[thin space (1/6-em)]](https://www.rsc.org/images/entities/char_2009.gif) : :![[thin space (1/6-em)]](https://www.rsc.org/images/entities/char_2009.gif) 0 0![[thin space (1/6-em)]](https://www.rsc.org/images/entities/char_2009.gif) : :![[thin space (1/6-em)]](https://www.rsc.org/images/entities/char_2009.gif) 5; (b) 9 5; (b) 9![[thin space (1/6-em)]](https://www.rsc.org/images/entities/char_2009.gif) : :![[thin space (1/6-em)]](https://www.rsc.org/images/entities/char_2009.gif) 1 1![[thin space (1/6-em)]](https://www.rsc.org/images/entities/char_2009.gif) : :![[thin space (1/6-em)]](https://www.rsc.org/images/entities/char_2009.gif) 5; (c) 8 5; (c) 8![[thin space (1/6-em)]](https://www.rsc.org/images/entities/char_2009.gif) : :![[thin space (1/6-em)]](https://www.rsc.org/images/entities/char_2009.gif) 2 2![[thin space (1/6-em)]](https://www.rsc.org/images/entities/char_2009.gif) : :![[thin space (1/6-em)]](https://www.rsc.org/images/entities/char_2009.gif) 5; (d) 7 5; (d) 7![[thin space (1/6-em)]](https://www.rsc.org/images/entities/char_2009.gif) : :![[thin space (1/6-em)]](https://www.rsc.org/images/entities/char_2009.gif) 3 3![[thin space (1/6-em)]](https://www.rsc.org/images/entities/char_2009.gif) : :![[thin space (1/6-em)]](https://www.rsc.org/images/entities/char_2009.gif) 5; (e) 0 5; (e) 0![[thin space (1/6-em)]](https://www.rsc.org/images/entities/char_2009.gif) : :![[thin space (1/6-em)]](https://www.rsc.org/images/entities/char_2009.gif) 10 10![[thin space (1/6-em)]](https://www.rsc.org/images/entities/char_2009.gif) : :![[thin space (1/6-em)]](https://www.rsc.org/images/entities/char_2009.gif) 5. 5. | ||
Above results suggest that the loading of PM2 could induce both donor and acceptor polymers forming aggregates and therefore increase the phase-separation scale. It is well-known that the over-sized donor/acceptor domain is difficult for excitons diffusions.49 In addition, polymer fibre-network is not found in above images.50 The relatively large-size donor polymer aggregates would also induce grain-boundaries, which increase the energy barriers for charge hoping and prevent the hole transport in different donor domains.51 Therefore, the hole mobility decreases when the donor domain size increasing. Since both exciton diffusion and hole mobility are crucial for FF, the FF display a trend that is consistent with the phase-separation variations.
Conclusions
In conclusion, we successfully fabricated ternary all-polymer solar cells consisting of two donor polymers with complementary absorption. The second donor PM2 improves the light harvesting due to its strong absorption in the near-IR range, but it also decreases the hole mobility in the blend film and results low FFs when increasing the PM2 ratio. By carefully tuning the ratio of two donor polymers, the trade-off has been achieved at the ratio of 9![[thin space (1/6-em)]](https://www.rsc.org/images/entities/char_2009.gif) :
:![[thin space (1/6-em)]](https://www.rsc.org/images/entities/char_2009.gif) 1
1![[thin space (1/6-em)]](https://www.rsc.org/images/entities/char_2009.gif) :
:![[thin space (1/6-em)]](https://www.rsc.org/images/entities/char_2009.gif) 5 (PF2
5 (PF2![[thin space (1/6-em)]](https://www.rsc.org/images/entities/char_2009.gif) :
:![[thin space (1/6-em)]](https://www.rsc.org/images/entities/char_2009.gif) PM2
PM2![[thin space (1/6-em)]](https://www.rsc.org/images/entities/char_2009.gif) :
:![[thin space (1/6-em)]](https://www.rsc.org/images/entities/char_2009.gif) N2200) showing a PCE of 6.90%, which is better than that of two binary devices. More importantly, ternary devices with introducing of PM2 remain a similar Voc in comparing with the PF2:N2200 devices, meaning that there is no extra expense of Voc when increasing the light harvesting in the near-IR region. This work successfully demonstrates a strategy that utilizing a narrow bandgap donor polymer as the second donor to improve the performance of all-polymer solar cells.
N2200) showing a PCE of 6.90%, which is better than that of two binary devices. More importantly, ternary devices with introducing of PM2 remain a similar Voc in comparing with the PF2:N2200 devices, meaning that there is no extra expense of Voc when increasing the light harvesting in the near-IR region. This work successfully demonstrates a strategy that utilizing a narrow bandgap donor polymer as the second donor to improve the performance of all-polymer solar cells.
Conflicts of interest
There are no conflicts to declare.Acknowledgements
This work was financially supported by the National Natural Science Foundation of China (21805032), the Pearl River Nova Program of Guangzhou (201906010074) and the Shanghai Design Science (Category IV) Peak Discipline Open Grant (DB8109).References
- L. Lucera, F. Machui, P. Kubis, H. D. Schmidt, J. Adams, S. Strohm, T. Ahmad, K. Forberich, H.-J. Egelhaaf and C. J. Brabec, Energy Environ. Sci., 2016, 9, 89–94 RSC
.
- Q. Liu, Y. Jiang, K. Jin, J. Qin, J. Xu, W. Li, J. Xiong, J. Liu, Z. Xiao, K. Sun, S. Yang, X. Zhang and L. Ding, Sci. Bull., 2020, 65, 272–275 CrossRef CAS
.
- L. Meng, Y. Zhang, X. Wan, C. Li, X. Zhang, Y. Wang, X. Ke, Z. Xiao, L. Ding, R. Xia, H.-L. Yip, Y. Cao and Y. Chen, Science, 2018, 361, 1094–1098 CrossRef CAS
.
- G. Yu, J. Gao, J. C. Hummelen, F. Wudl and A. J. Heeger, Science, 1995, 270, 1789–1791 CrossRef CAS
.
- C. Zhao, J. Wang, J. Jiao, L. Huang and J. Tang, J. Mater. Chem. C, 2019, 8, 28–43 RSC
.
- Q. Yue, W. Liu and X. Zhu, J. Am. Chem. Soc., 2020, 142, 11613–11628 CrossRef CAS
.
- H. Kang, W. Lee, J. Oh, T. Kim, C. Lee and B. J. Kim, Acc. Chem. Res., 2016, 49, 2424–2434 CrossRef CAS
.
- C. Lee, S. Lee, G.-U. Kim, W. Lee and B. J. Kim, Chem. Rev., 2019, 119, 8028–8086 CrossRef CAS
.
- T. Jia, J. Zhang, W. Zhong, Y. Liang, K. Zhang, S. Dong, L. Ying, F. Liu, X. Wang, F. Huang and Y. Cao, Nano Energy, 2020, 72, 104718 CrossRef CAS
.
- Y. Lin, J. Wang, Z.-G. Zhang, H. Bai, Y. Li, D. Zhu and X. Zhan, Adv. Mater., 2015, 27, 1170–1174 CrossRef CAS
.
- J. Yuan, Y. Zhang, L. Zhou, G. Zhang, H.-L. Yip, T.-K. Lau, X. Lu, C. Zhu, H. Peng, P. A. Johnson, M. Leclerc, Y. Cao, J. Ulanski, Y. Li and Y. Zou, Joule, 2019, 3, 1140–1151 CrossRef CAS
.
- H. Yao, Y. Chen, Y. Qin, R. Yu, Y. Cui, B. Yang, S. Li, K. Zhang and J. Hou, Adv. Mater., 2016, 28, 8283–8287 CrossRef CAS
.
- F. Liu, Z. Zhou, C. Zhang, J. Zhang, Q. Hu, T. Vergote, F. Liu, T. P. Russell and X. Zhu, Adv. Mater., 2017, 29, 1606574 CrossRef
.
- H. Yan, Z. Chen, Y. Zheng, C. Newman, J. R. Quinn, F. Dötz, M. Kastler and A. Facchetti, Nature, 2009, 457, 679–686 CrossRef CAS
.
- Z. Li, L. Ying, P. Zhu, W. Zhong, N. Li, F. Liu, F. Huang and Y. Cao, Energy Environ. Sci., 2019, 12, 157–163 RSC
.
- B. Fan, W. Zhong, L. Ying, D. Zhang, M. Li, Y. Lin, R. Xia, F. Liu, H.-L. Yip, N. Li, Y. Ma, C. J. Brabec, F. Huang and Y. Cao, Nat. Commun., 2019, 10, 4100 CrossRef
.
- L. Gao, Z.-G. Zhang, L. Xue, J. Min, J. Zhang, Z. Wei and Y. Li, Adv. Mater., 2016, 28, 1884–1890 CrossRef CAS
.
- Z. Li, X. Xu, W. Zhang, X. Meng, W. Ma, A. Yartsev, O. Inganäs, M. R. Andersson, R. A. J. Janssen and E. Wang, J. Am. Chem. Soc., 2016, 138, 10935–10944 CrossRef CAS
.
- Z. Li, X. Xu, W. Zhang, X. Meng, Z. Genene, W. Ma, W. Mammo, A. Yartsev, M. R. Andersson, R. A. J. Janssen and E. Wang, Energy Environ. Sci., 2017, 10, 2212–2221 RSC
.
- X. Liu, C. Zhang, C. Duan, M. Li, Z. Hu, J. Wang, F. Liu, N. Li, C. J. Brabec, R. A. J. Janssen, G. C. Bazan, F. Huang and Y. Cao, J. Am. Chem. Soc., 2018, 140, 8934–8943 CrossRef CAS
.
- L. Zhu, W. Zhong, C. Qiu, B. Lyu, Z. Zhou, M. Zhang, J. Song, J. Xu, J. Wang, J. Ali, W. Feng, Z. Shi, X. Gu, L. Ying, Y. Zhang and F. Liu, Adv. Mater., 2019, 31, 1902899 CrossRef CAS
.
- P. Zhu, B. Fan, L. Ying, F. Huang and Y. Cao, Chem.–Asian J., 2019, 14, 3109–3118 CrossRef CAS
.
- C. Dou, J. Liu and L. Wang, Sci. China: Chem., 2017, 60, 450–459 CrossRef CAS
.
- K. Feng, J. Huang, X. Zhang, Z. Wu, S. Shi, L. Thomsen, Y. Tian, H. Y. Woo, C. R. McNeill and X. Guo, Adv. Mater., 2020, 2001476 CrossRef CAS
.
- Z.-G. Zhang, Y. Yang, J. Yao, L. Xue, S. Chen, X. Li, W. Morrison, C. Yang and Y. Li, Angew. Chem., Int. Ed., 2017, 56, 13503–13507 CrossRef CAS
.
- H. Yao, F. Bai, H. Hu, L. Arunagiri, J. Zhang, Y. Chen, H. Yu, S. Chen, T. Liu, J. Y. L. Lai, Y. Zou, H. Ade and H. Yan, ACS Energy Lett., 2019, 4, 417–422 CrossRef CAS
.
- G. Feng, J. Li, F. J. M. Colberts, M. Li, J. Zhang, F. Yang, Y. Jin, F. Zhang, R. A. J. Janssen, C. Li and W. Li, J. Am. Chem. Soc., 2017, 139, 18647–18656 CrossRef CAS
.
- S. Liu, Y. Firdaus, S. Thomas, Z. Kan, F. Cruciani, S. Lopatin, J.-L. Brédas and P. M. Beaujuge, Angew. Chem., Int. Ed., 2018, 57, 531–535 CrossRef CAS
.
- Y. Xu, J. Yuan, S. Liang, J.-D. Chen, Y. Xia, B. W. Larson, Y. Wang, G. M. Su, Y. Zhang, C. Cui, M. Wang, H. Zhao and W. Ma, ACS Energy Lett., 2019, 4, 2277–2286 CrossRef CAS
.
- M. Wang, H. Wang, M. Ford, J. Yuan, C.-K. Mai, S. Fronk and G. C. Bazan, J. Mater. Chem. A, 2016, 4, 15232–15239 RSC
.
- N. Blouin, A. Michaud, D. Gendron, S. Wakim, E. Blair, R. Neagu-Plesu, M. Belletête, G. Durocher, Y. Tao and M. Leclerc, J. Am. Chem. Soc., 2008, 130, 732–742 CrossRef CAS
.
- L. Ying, B. B. Y. Hsu, H. Zhan, G. C. Welch, P. Zalar, L. A. Perez, E. J. Kramer, T.-Q. Nguyen, A. J. Heeger, W.-Y. Wong and G. C. Bazan, J. Am. Chem. Soc., 2011, 133, 18538–18541 CrossRef CAS
.
- H. Zhou, L. Yang and W. You, Macromolecules, 2012, 45, 607–632 CrossRef CAS
.
- C. M. Cardona, W. Li, A. E. Kaifer, D. Stockdale and G. C. Bazan, Adv. Mater., 2011, 23, 2367 CrossRef CAS
.
- J.-L. Bredas, Mater. Horiz., 2013, 1, 17–19 RSC
.
- L. Lu, T. Xu, W. Chen, E. S. Landry and L. Yu, Nat. Photonics, 2014, 8, 716–722 CrossRef CAS
.
- Y. Yang, W. Chen, L. Dou, W.-H. Chang, H.-S. Duan, B. Bob, G. Li and Y. Yang, Nat. Photonics, 2015, 9, 190–198 CrossRef CAS
.
- P. P. Khlyabich, B. Burkhart and B. C. Thompson, J. Am. Chem. Soc., 2012, 134, 9074–9077 CrossRef CAS
.
- Z. Wang, X. Zhu, J. Zhang, K. Lu, J. Fang, Y. Zhang, Z. Wang, L. Zhu, W. Ma, Z. Shuai and Z. Wei, J. Am. Chem. Soc., 2018, 140, 1549–1556 CrossRef CAS
.
- T. Yang, M. Wang, C. Duan, X. Hu, L. Huang, J. Peng, F. Huang and X. Gong, Energy Environ. Sci., 2012, 5, 8208–8214 RSC
.
- M. Wang, H. Wang, T. Yokoyama, X. Liu, Y. Huang, Y. Zhang, T.-Q. Nguyen, S. Aramaki and G. C. Bazan, J. Am. Chem. Soc., 2014, 136, 12576–12579 CrossRef CAS
.
- W. Li, K. H. Hendriks, A. Furlan, M. M. Wienk and R. A. J. Janssen, J. Am. Chem. Soc., 2015, 137, 2231–2234 CrossRef CAS
.
- C. M. Proctor, J. A. Love and T.-Q. Nguyen, Adv. Mater., 2014, 26, 5957–5961 CrossRef CAS
.
- J. A. Bartelt, D. Lam, T. M. Burke, S. M. Sweetnam and M. D. McGehee, Adv. Energy Mater., 2015, 5, 1500577 CrossRef
.
- A. Rose, Phys. Rev., 1955, 97, 1538–1544 CrossRef CAS
.
- M. A. Lampert and P. Mark, Current Injection in Solids, Academic, New York, 1970 Search PubMed
.
- C. M. Proctor, C. Kim, D. Neher and T.-Q. Nguyen, Adv. Funct. Mater., 2013, 23, 3584–3594 CrossRef CAS
.
- A. K. K. Kyaw, D. H. Wang, V. Gupta, W. L. Leong, L. Ke, G. C. Bazan and A. J. Heeger, ACS Nano, 2013, 7, 4569–4577 CrossRef CAS
.
- M. Menke and R. J. Holmes, Energy Environ. Sci., 2014, 7, 499–512 RSC
.
- J. J. van Franeker, G. H. L. Heintges, C. Schaefer, G. Portale, W. Li, M. M. Wienk, P. van der Schoot and R. A. J. Janssen, J. Am. Chem. Soc., 2015, 137, 11783–11794 CrossRef CAS
.
- R. Noriega, J. Rivnay, K. Vandewal, F. P. V. Koch, N. Stingelin, P. Smith, M. F. Toney and A. Salleo, Nat. Mater., 2013, 12, 1038–1044 CrossRef CAS
.
Footnote |
| † Electronic supplementary information (ESI) available: Cyclic voltammetry, SCLC mobility, AFM, solar cell device measurements. See DOI: 10.1039/d0ra06143c |
| This journal is © The Royal Society of Chemistry 2020 |


