 Open Access Article
Development of starch based intelligent films by incorporating anthocyanins of butterfly pea flower and TiO2 and their applicability as freshness sensors for prawns during storage
Siji K. Maryab,
Rekha Rose Koshyab,
Jomol Daniela,
Jijo Thomas Koshya,
Laly A. Pothen *b and
Sabu Thomas
 c
c
aDepartment of Chemistry, Bishop Moore College, Mavelikara, Kerala, India
bDepartment of Chemistry, CMS College, Kottayam, Kerala, India. E-mail: lapothen@gmail.com; Tel: +91 306 966-5030
cIIUCNN, Mahatma Gandhi University, Kottayam, Kerala, India
First published on 2nd November 2020
Abstract
Intelligent pH sensitive starch films were developed by incorporation of anthocyanin pigment extracted from butterfly pea flower (BPE) and nanosized TiO2 using the method of solution casting. This research work evaluated the influence of BPE and TiO2 on the physical and structural properties of starch films. The physical properties of the starch films could be significantly altered by the addition of BPE and or TiO2. The starch films S/BPE and S/BPE/TiO2 exhibited higher barrier properties against water vapour as compared to the control films. Incorporation of BPE and TiO2 could decrease the thickness and moisture content of films. S, S/BPE starch films were transparent and, S/TiO2 and S/BPE/TiO2 films were opaque. Control starch films were colourless, whereas S/BPE films have purple colour. Owing to the inclusion of BPE and TiO2 particles, structural characterization by X-ray diffraction (XRD) and Fourier Transform Infrared Spectroscopy (FTIR) did not show any major changes in polymer structure. Thermogravimetric analysis revealed that the addition of TiO2 enhanced the thermal stability of starch films to a significant extent. The color of different starch-based films was determined using the CIE Lab scale under different pH conditions and compared with the control. The fabricated (S/BPE and S/BPE/TiO2) films exhibited visually perceptible colour changes in the pH range between 1 and 12. Consequently these films could be used as intelligent pH indicators for monitoring the freshness of prawn seafood samples. During the storage of prawn food samples for 6 days, the color of the film changed from light pink to green which is a clear indication of spoilage of food material.
1 Introduction
Increased environmental awareness and growing need for the creation of biodegradable polymers have resulted in the advancement of polymer chemistry in a new direction. Rigorous efforts have been taken by researchers to solve the problems generated by the extensive use of plastic materials. Much of the current research is focused on the substitution of petro-based plastics by biodegradable materials with properties comparable to some synthetic polymers.1,2 In recent decades there has been rapidly growing interest in developing intelligent packaging films as freshness sensors, which is an important aspect for fresh, high quality and safe foods with a longer shelf life, particularly for perishable foods like fish, shrimp, milk, etc.3–6Researchers recently developed anthocyanin based material as intelligent or smart materials for food packaging to evaluate the freshness of a food sample. Novel pH responsive biopolymer films made by immobilising the anthocyanin pigment from natural dyes have received great interest recently.7–11 The pigment particles immobilised during evaporation and drying process. Immobilisation boosts the orientation of pigments are vertically within the film layer and it is reported that sol gel method is a popular method for immobilisation of pigment. Colorimetric films made from natural pigments and biopolymers are nontoxic safe and biodegradable.
Two main constituents of pH sensitive colorimetric films are a solid base and a pigment to check pH change. Several intelligent pH sensitive biopolymer based films were developed by using different biopolymers like starch8,10,12–14 bacterial nanocellulose,8 chitosan,15 methyl cellulose,16 polyvinyl alcohol.15
Recently natural colour pigments are focused more because they are eco-friendly compared to synthetic dyes. Anthocyanin is one of the best natural pigment and is a water soluble phenolic compound responsible for red, purple, and blue colours in flowers fruits and vegetables. Anthocyanin generally undergo structural changes and exhibit colour variations under different pH conditions. It is an environment friendly pH indicator and acted as sensor within broad range of pH.17 Butterfly pea flower (Clitoria ternatea L. flowers) are the natural colouring ingredients in tea, food etc. The main anthocyanin responsible for the deep blue to purple colour in butterfly pea flower is delphinidin.18,19
Titanium dioxide (TiO2) is an inert, non-toxic, eco-friendly and inexpensive metal oxide. It exists in three different crystalline forms: rutile (the most stable phase), anatase and brookite. Among these crystalline forms, anatase has the highest photocatalytic activity. TiO2 can be used to make biopolymer-based packaging films to provide protection against food-borne micro-organisms and allergens in the presence of ultraviolet radiation.20,21 The anti-microbial activity of TiO2 is related to reactive oxygen species production.21 The use of TiO2 nanoparticles as reinforcement in biopolymer films such as whey protein isolate,22 wheat starch,21 soy protein isolate,23 poly(L-lactic acid)24 etc. have been reported. TiO2 is generally used in packaging applications as a UV light absorber, and the addition of TiO2 prevents pathogenic bacteria through antibacterial and antimicrobial effect. The incorporation of TiO2 nanoparticle also improved the water vapour and oxygen permeability of films.20
In this work intelligent packaging films were prepared from potato starch, anthocyanin pigment extracted from butterfly pea Flower and TiO2. We studied the interesting and promising effect of immobilised anthocyanin and TiO2 pigment on the properties of starch based films. Influence of BPE extract and TiO2 on the physical, structural and pH sensitive properties were studied. Finally these intelligent pH sensitive films were employed to monitor the freshness of prawn food sample at refrigeration temperature (4 °C).
2 Materials and methods
2.1 Materials
Potato starch (S), glycerol, ethyl alcohol, hydrochloric acid, buffer solutions having pH range 1–12, fresh butterfly pea flower collected from local area, TiO2 (anatase, purity > 98.5%) purchased from KMML Chavara Industry Co., Ltd. All the reagents were of analytical grade. Distilled water was used for all sample preparations.2.2 Extraction of anthocyanin from butterfly pea flower
Anthocyanins were extracted from dried butterfly pea flower by using acid–alcohol mixture.4,15,17 Dried butterfly pea flower were cut in to small piece and chopped flower were immersed in 1 L of acid–alcohol mixture(ethyl alcohol and water) in the ratio (1![[thin space (1/6-em)]](https://www.rsc.org/images/entities/char_2009.gif) :
:![[thin space (1/6-em)]](https://www.rsc.org/images/entities/char_2009.gif) 3) for 24 h. The extract was filtered and centrifuged at 4000 rpm for 10 minutes. The resultant clear violet coloured supernatant solution was collected and stored in dark place.
3) for 24 h. The extract was filtered and centrifuged at 4000 rpm for 10 minutes. The resultant clear violet coloured supernatant solution was collected and stored in dark place.
2.3 Determination of total anthocyanin content (TAC) in BPE by UV
The TAC in BPE was measured via the pH differential method using UV-visible spectrophotometer.6,9,11,25,26 The absorbance of test portion of BPE diluted with pH 1.0 buffer and pH 4.5 buffer at both 520 and 700 nm was measured. In order to get the absorbance within linear range (between 0.2 and 1.4 absorbance units) determine the appropriate dilution factor. The diluted test portions are read versus a blank cell filled with distilled water. Absorbance was measured within 20–50 min of preparation. The anthocyanin content was calculated as cyanidin-3-glucoside (refer to the eqn (1)) with an extinction coefficient of 26![[thin space (1/6-em)]](https://www.rsc.org/images/entities/char_2009.gif) 900 and a molecular weight of 484.83 g mol−1.
900 and a molecular weight of 484.83 g mol−1.
 | (1) |
![[thin space (1/6-em)]](https://www.rsc.org/images/entities/char_2009.gif) 900 molar extinction coefficient, in L & mol−1 cm−1, 1000 = factor for conversion from g to mg.
900 molar extinction coefficient, in L & mol−1 cm−1, 1000 = factor for conversion from g to mg.
2.4 Colour responses of anthocyanin in BPE to pH changes
Measurement of the colour intensity of anthocyanin extract of BPE was performed on ten pH conditions and the resultant solutions were photographed. Buffer solutions were prepared at a range of pH from 1 to 12 with an aqueous solution of 0.2 M citric acid and 0.2 M disodium hydrogen phosphate and distilled water and then checked by a digital pH meter. To 1 mL of BPE added 9 mL buffer solution and the colour changes were photographed using a digital camera.2.5 Development of starch/extract films by immobilising the anthocyanin pigment
To develop S/TiO2 (0.5 wt% of TiO2 on starch matrix), the TiO2 suspension was ultrasonicated for 1 h and then added slowly to starch solution.32 To develop S/BPE/TiO2 (4 wt% of BPE on starch basis) and TiO2 (0.5 wt% on starch basis) were simultaneously added into starch film forming solution. The solution was mixed well using homogeniser (Ika Ultra-Turrax T 25) and heated to at 85 °C for 10 min.
The film-forming solution was immediately poured into a smooth Teflon sheet. Then, film hydrogels were formed. The hydrogels were dried to films at a temperature of 55 °C for 18 hours. The film was peeled from a Teflon sheet and dried starch films were preserved in a relative humidity (RH = 55%, 25 °C) for further use. The control film was prepared under the same conditions, except that the anthocyanin extract.
2.6 Determination of physical properties of films
Total colour difference (ΔE) and whiteness index (WI) of the films were calculated by the eqn (1) and (2).4,8,9,14,25
| ΔE = √(L* − L)2 + (a* − a)2 + (b* − b)2 | (2) |
| WI = 100 − √(100 − L)2 + a2 + b2 | (3) |
WVP for four starch based films was calculated by the equation:
 | (4) |
2.7 Structural characterization of the films
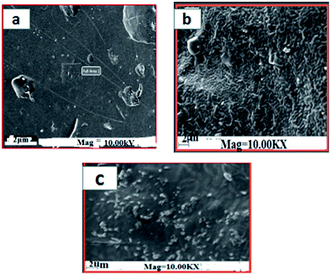
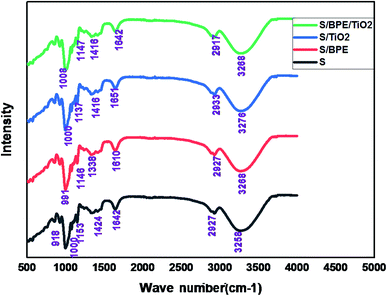
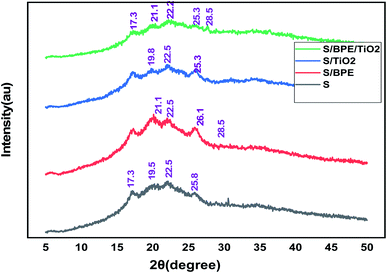
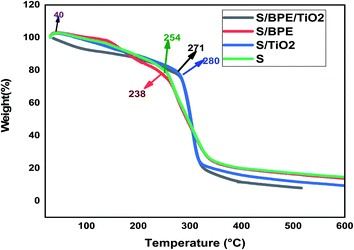
The surface morphology of the prepared films was observed using an SEM (Carl Zeiss Evo 18 Secondary Electron Microscope With EDS) at room temperature. To obtain SEM images samples were placed on an aluminium base and then covered with gold. FTIR microscopy was conducted on a Perkin Elmer Spectrum 100 FTIR spectrometer within the wave number range of 450–4000 cm−1 using an attenuated total reflection (ATR) technique. XRD technique was applied to determine the crystalline character of the S, S/BPE, S/TiO2 and S/BPE/TiO2 films. Thermal stability of starch films were determined by thermogravimetric analysis(TGA). Samples weighing 10–20 mg were placed in ceramic crucibles, and tests were carried out under nitrogen atmosphere from room temperature (30 °C) up to 500 °C under air atmosphere (30 30 mL min−1) at a heating rate of 10 °C min−1.2.8 Colour responses of the films to different pH
Starch films were cut in to small squares (1 cm × 1 cm) and immersed in the buffer solutions having different pH (1–12) for about 5 minutes. Colour changes were photographed.2.9 Application of S/BPE and S/BPE/TiO2 films for monitoring the freshness of food sample
Inorder to use the intelligent pH sensitive starch–anthocyanin based films as the freshness sensor, spoilage experiment was carried out by sticking the square shaped (1 cm × 1 cm) films inside the box containing 20 g fresh prawn meat. The box was stored at 4 °C for 6 days. Colour change of pH indicator films were noted and photographed using a digital camera for 6 days. ΔE values of the indicator films were assessed in triplicate on days 0, 2, 4 and 6 of storage.2.10 Statistical analysis
Statistical analysis was conducted by using IBM SPSS Statistics 22.0. The Duncan test and one-way analysis of variance (ANOVA) were used for multiple comparisons by SPSS package. Difference was considered as statistically significant if p < 0.05.3 Results and discussion
3.1 Characterisation of BPE
TAC in BPE was determined as 236.1 mg g−1 by pH-differential assay. The colour responses of anthocyanins in BPE in different buffer solutions were shown in Fig. 1b. Anthocyanin pigment present in the BPE exhibited colour variations in 10 different pH buffer solutions: bright red at pH 1, purple violet at pH 2–3, purple at pH 4–6 and ocean blue green colour at pH 7–9 and olive green colour at pH 10–12. The colour change of BPE in different buffer solution was attributed to structural changes in anthocyanin pigment.37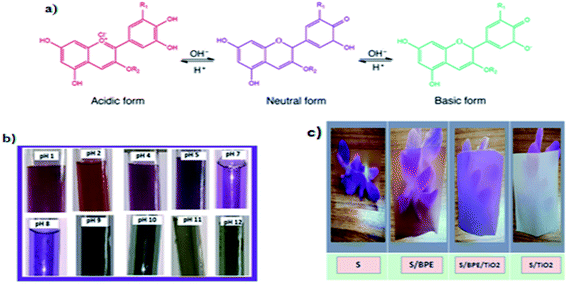 | ||
| Fig. 1 (a) Chemical diagram of colour-changing anthocyanin pH reaction37 (b) colour variations of BPE in different buffer solutions (c) photographs of starch films showing the transparency. | ||
Thus pH is very important for the colour of anthocyanin. The natural pigment contained in the BPE are red in acid solutions, violet or purple in neutral solutions, and green in alkaline pH. The colour variations of anthocyanin pigment in BPE depend directly on the number of hydroxyl group present in the molecule. Thus pH sensitive films could be used as pH indicators in food industry.9,19 In this work immobilisation of anthocyanin pigment can be done by incorporating in starch matrix.
3.2 Characterisation of S, S/BPE, S/TiO2 and S/BPE/TiO2films
| Films | L* | a* | b* | ΔE | Whiteness index (WI) | Thickness (mm) | Moisture content | WVP ×10−10 g−1 s−1 Pa−1 |
|---|---|---|---|---|---|---|---|---|
| a Values are given as mean ± SD (n = 10 for film thickness, and n = 5 for moisture content and WVP). Different letters in the same column indicate significantly different (p < 0.05). | ||||||||
| S | 70.18 ± 0.52b | 4.19 ± 0.41c | −2.51 ± 0.31c | 0 | 69.8 | 0.219 ± 0.009a | 15.63 ± 0.21a | 1.49 ± 0.22a,b |
| S/BPE | 52.25 ± 0.60d | 25.67 ± 0.31a | 2.83 ± 0.41b | 29.12 | 45.72 | 0.179 ± 0.008b | 12.78 ± 0.17c | 0.97 ± 0.057b,c |
| S/TiO2 | 88.64 ± 0.14a | 1.55 ± 0.18d | 5.58 ± 0.26a | 20.31 | 87.26 | 0.182 ± 0.008b | 13.34 ± 0.27b | 0.65 ± 0.056c,d |
| S/TiO2/BPE | 58.46 ± 0.44c | 18.54 ± 0.35b | −4.8 ± 0.33d | 18.50 | 54.26 | 0.184 ± 0.011b | 12.61 ± 0.34c | 0.46 ± 0.079d |
3.3 Structural characterization of the starch films
No sharp diffraction peaks were observed corresponding to the anthocyanin pigment and S/BPE films showed amorphous pattern similar to that of starch. The diffraction peak intensities of BPE incorporated films were stronger than other films. This may attributed to the formation of hydrogen bonding between starch and anthocyanin pigment.25 A weak diffractionpattern was observed for S/BPE/TiO2 film compared to S/TiO2 film, which could be attributed to the intermolecular interactions among S, TiO2 and BPE.38,46
The main weight loss occurred at this stage which was ascribed to the decomposition of starch films.9 The results revealed that the addition of BPE to starch matrix reduced the thermal stability of starch films. But the addition of TiO2 enhanced the thermal stability of starch films to a significant extent. The third stage in the thermogram ascribed to the complete degradation of polymer.
3.4 Colour responses of the films to different pH
Anthocyanin incorporated starch films should exhibit colour change with pH and could be used as intelligent pH indicator films to monitor the freshness of the packaged food. S/BPE and S/TiO2/BPE films both showed remarkable colour changes in the range of pH 1–12. For the determination of correlation of pH and colour change, pH indicator films with BPE were immersed in buffer solutions containing different pH values within the range 1–12. Similar colour changes were observed as per previous work, such as chitosan-purple sweet potato extract films, chitosan – black plum peel extract films, starch-blueberry residue films, chitosan-silver – purple corn extract films.7,14,46For pH values(1 to 4) colour of the S/BPE films varies from reddish pink to purple. The appearance of red and pink colour may be due to the presence of the flavylium cation.7,46 When the film was in contact with buffer solution with pH range 5–7, S/BPE films showed a violet colour. In basic buffer solution the film showed entirely different colour as compared to colour range in acidic medium. In basic buffer solution having pH 8–10 film, the colour of the film changed to blue. At pH 10 to 12 the S/BPE films appeared a bright greenish blue colour. Colour of the films varies from bright purple – blue – green from pH 1 to pH 12. This same colour spectrum was reported in ref. 15 who found that an anthocyanin based pH indicator films exhibit same colour change in acidic–neutral–basic buffer solutions. S/BPE/TiO2 also exhibited almost similar colour pattern in different pH conditions. At pH1 films shows an excellent bright red colour compared to S/BPE films. The presence of TiO2 increases the brightness of different colours. Our results suggested that both S/BPE and S/BPE/TiO2 films are excellent pH indicators for monitoring the freshness of packaged food samples.
The value of colour parameters L*, a*and b* obtained by using the Hunter Lab colorimeter is given in the Table 2 confirmed the results shown in Fig. 6. Table 2 summarizes the colour parameters L*a*b* values in CIELab* scale, colour difference (ΔE) and whiteness indices (WI) for the S/BPE films after being immersed in different buffer solution. Values of total colour difference (ΔE) greater than 3 can be considered visually perceptible to the human eye. In the present work, according to Table 2, ΔE were above 3.00. Films at alkaline pH showed highest ΔE values, which show a marked visual colour difference. Both the BPE incorporated samples (S/BPE and S/BPE/TiO2 starch films) exhibited visually perceptible differences.47
| pH | S/BPE | S/BPE/TiO2 | ||||||||
|---|---|---|---|---|---|---|---|---|---|---|
| L* | a* | b* | ΔE | Whiteness index (WI) | L* | a* | b* | ΔE | Whiteness index (WI) | |
| a Values are given as ± SD (n = 5). Different letters in the same column indicates the values are significantly different (p < 0.05). | ||||||||||
| 1 | 44.21 ± 0.44b | 21.68 ± 0.27c | −2.55 ± 0.24a | 24.53 | 43.14 | 56.40 ± 0.24a | 38.55 ± 0.36a | 15.71 ± 0.26f | 16.70 | 39.72 |
| 2 | 40.87 ± 0.16e | 25.48 ± 0.36b | −2.46 ± 0.30a | 29.07 | 35.57 | 53.69 ± 0.21b | 25.53 ± 0.35d | −8.56 ± 0.28d | 20.89 | 46.43 |
| 4 | 39.08 ± 0.25g | 31.53 ± 0.23a | −5.51 ± 0.50b | 32.59 | 31.19 | 46.72 ± 0.60e | 25.45 ± 0.42d | 20.60 ± 0.38g | 10.30 | 37.49 |
| 5 | 42.66 ± 0.29c | 21.67 ± 0.22c | 20.39 ± 0.25e | 7.62 | 38.46 | 52.35 ± 0.33d | 30.66 ± 0.32b | 27.41 ± 0.36h | 18.37 | 37.06 |
| 7 | 40.48 ± 0.24e | 25.64 ± 0.29b | 26.52 ± 0.37f | 0 | 29.98 | 45.34 ± 0.36f | 27.15 ± 0.15c | 10.53 ± 0.28e | 0 | 38.07 |
| 8 | 37.51 ± 0.38h | 16.48 ± 0.36d | 15.35 ± 0.21d | 14.75 | 33.58 | 41.89 ± 0.61g | 25.14 ± 0.56f | −3.37 ± 0.59b | 52.88 | 36.61 |
| 9 | 41.44 ± 0.41d | 15.43 ± 0.59d | −6.61 ± 0.43c | 22.39 | 39.10 | 45.64 ± 0.32f | 30.52 ± 0.36g | 0.51 ± 0.32a | 58.71 | 37.66 |
| 10 | 39.9 ± 0.21f | 10.35 ± 0.21f | 20.50 ± 0.32e | 16.44 | 35.66 | 52.95 ± 0.41c | 35.62 ± 0.39i | −7.70 ± 0.22c | 62.40 | 40.5 |
| 11 | 37.62 ± 0.34h | 19.42 ± 0.30g | −5.39 ± 0.34b | 49.85 | 34.45 | 37.62 ± 0.34h | 34.73 ± 0.76h | −3.77 ± 0.44b | 62.72 | 28.51 |
| 12 | 45.14 ± 0.55a | 30.58 ± 0.35h | −2.75 ± 0.33a | 61.29 | 37.14 | 40.59 ± 0.37h | 20.29 ± 0.62e | 10.03 ± 0.37e | 51.92 | 36.17 |
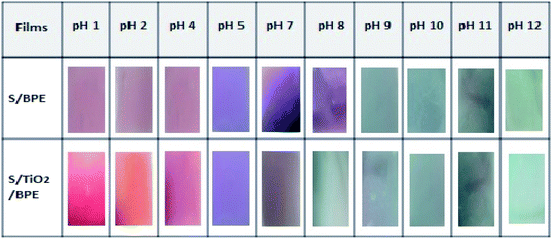 | ||
| Fig. 6 Visual aspect colour of the S/BPE and S/BPE/TiO2 starch pH indicator films with butterfly pea extract after immersion in buffer solutions having different pH values (1–12). | ||
In acidic region L* value is maximum for films at pH = 1, which indicates that at this pH film more intense red colour.17 In basic region L* value is maximum at pH = 12 and pH = 10 for S/BPE and S/BPE/TiO2 respectively, reveals that in alkaline medium intense green colour is exhibited by these films at this pH. The S/BPE films exhibited negative b* (blue to yellow) gradually increased from −2.55 ± 0.24 to −26.52 ± 0.37 corresponding to the colour change from red to blue. Almost similar variations in b values were also observed in the case of S/BPE/TiO2 films. The changes in the −b* values were in good agreement with the observed colour changes of the film. The colour parameter a* (red to green) from Table 2, with a maximum value of 38.55 ± 0.36 (pH1 for S/BPE/TiO2) agreed well with intense red colour of film. Among the two starch pH indicator films (S/BPE and S/BPE/TiO2), S/BPE/TiO2 was brightest confirmed by highest L* and WI values. This increase in whiteness may attribute to the white colour of TiO2 particles.
3.5 Application of pH indicator films as the freshness indicator
We used both S/BPE and S/BPE/TiO2 film as the freshness indicator to monitor the freshness of prawn sample. The photo catalytic self-cleaning property of TiO2 made the S/BPE/TiO2 film as a better suitable intelligent films for freshness monitoring. Microbial activity is the main reason for spoilage of prawn. High levels of total volatile basic nitrogen such as dimethylammonium, trimethylamine and ammonia were produced by the microbiological contamination of spoiled food. Since the film was stuck inside the cap of box there exist no direct contact between films and prawn sample. Initial pH of the fresh samples was 6.58. During the spoilage, pH of the sample increased due to the proteins hydrolysis followed by the formation of volatile compounds.8,9 The films will respond to the volatile basic compound evolved from the sample during the spoilage. The evolution of basic compounds resulted in the increase in pH near the atmosphere of films within the closed container. As pH gradually increased, the colour of S/BPE and S/BPE/TiO2 films changed from pink to green and visually demonstrated in the Fig. 7. Similar results was also reported by other researchers.48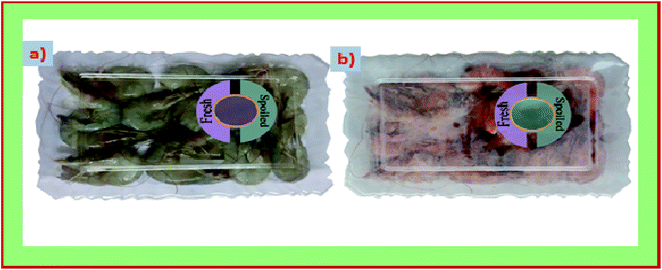 | ||
| Fig. 7 Color changes in the intelligent pH indicator starch based films (S/BPE/TiO2) attached to packages of prawn seafood sample (a) immediately after packaging (b) after 6 days of storage at 4 °C. | ||
Colour parameters L*a*b* values, and ΔE of freshness indicator films at different time intervals (0, 2, 4, 6 days) were summarized in the Table 3. Both the films showed an obvious colour change as storage time is prolonged. The colour of the film changed to green from light pink. For S/BPE and S/BPE/TiO2 the value of a* changes from 25.55 ± 0.37 to −30.69 ± 0.28 and 16.47 ± 0.47 to −33.90 ± 0.89 respectively. The value of ΔE indicates that there occurs appreciable colour change during the storage of prawn food sample for 6 days which is clear indication of spoilage of food material. S/BPE and S/BPE/TiO2 pH indicator films can thus acted as non-destructive detector for spoilage of food material by changing its colour form light pink(fresh stage) to intense green(beginning of spoilage). This colour change can be easily distinguished by direct observation. Ezati et al.8 prepared pH sensitive indicator film based on starch-cellulose and alizarin dye to monitor the freshness of rainbow trout fillet at 4 °C and analysed the color changes. These results indicated that natural pigment (anthocyanin extracted from butterfly pea flower) incorporated starch films are excellent eco-friendly and safe indicator for monitoring the freshness of food sample.
| Days | L* | a* | b* | ΔE |
|---|---|---|---|---|
| a Values are given as ± SD. Different letters in the same column indicates the values are significantly different (p < 0.05). | ||||
| S/BPE | ||||
| 0 | 50.90 ± 0.54c | 25.55 ± 0.37a | −1.79 ± 0.37b | |
| 2 | 58.82 ± 0.60a | 21.46 ± 0.91b | −7.00 ± 0.37c | 24.83 |
| 4 | 52.10 ± 0.67b | 10.60 ± 0.52c | −20.89 ± 0.37d | 20.44 |
| 6 | 41.29 ± 0.71d | −30.69 ± 0.28d | 4.93 ± 0.37a | 57.45 |
![[thin space (1/6-em)]](https://www.rsc.org/images/entities/char_2009.gif) |
||||
| S/BPE/TiO2 | ||||
| 0 | 54.94 ± 0.37d | 16.47 ± 0.47a | −7.04 ± 0.51c | |
| 2 | 60.88 ± 0.39c | 13.05 ± 0.84b | −12.16 ± 0.98d | 8.55 |
| 4 | 62.31 ± 0.46b | 8.96 ± 0.49c | −2.43 ± 0.49a | 11.48 |
| 6 | 65.49 ± 0.65a | −33.90 ± 0.89d | −5.08 ± 0.70b | 51.48 |
4 Conclusion
In this work intelligent pH sensitive starch based films were successfully developed by incorporating anthocyanin extracted from butterfly pea flower and TiO2. It was observed that the addition of BPE and TiO2 could greatly alter the physical properties of the films (colour, transparency, thickness, moisture content, water vapour permeability and thermal stability). SEM, FTIR XRD and TG analysis confirmed the presence of intermolecular interactions among S, BPE and TiO2. Starch based films (S/BPE and S/BPE/TiO2) exhibited an appreciable colour change in different buffer solutions having pH (1–12). The application trial for the usage of the film S/BPE/TiO2 as freshness monitor revealed that there occurs appreciable colour change from light pink (fresh stage) to intense green (beginning of spoilage). We could distinguish the colour with naked eye. This colour change is attributed to increase in pH of the food sample by evolution of basic compounds during spoilage. Hence, these intelligent films can be used as safe and eco-friendly pH indicator films for monitoring the freshness of seafood sample.Conflicts of interest
There are no conflicts to declare.References
- F. Zia, K. M. Zia, M. Zuber, S. Kamal and N. Aslam, Carbohydr. Polym., 2016, 134, 784–798 CrossRef.
- a. Orue, M. a. Corcuera, C. Pena, A. Eceiza and A. Arbelaiz, J. Thermoplast. Compos. Mater., 2014, 29, 817–832 CrossRef.
- B. Kuswandi, Freshness Sensors for Food Packaging, Elsevier, 2017 Search PubMed.
- H. Chen, M. Zhang, B. Bhandari and C. Yang, Food Hydrocolloids, 2020, 100, 105438 CrossRef CAS.
- S. Mohammadalinejhad, H. Almasi and M. Moradi, Food Control, 2020, 113, 107169 CrossRef CAS.
- M. M. Goodarzi, M. Moradi, H. Tajik, M. Forough, P. Ezati and B. Kuswandi, Int. J. Biol. Macromol., 2020, 153, 240–247 CrossRef.
- H. Yong, X. Wang, R. Bai, Z. Miao, X. Zhang and J. Liu, Food Hydrocolloids, 2019, 90, 216–224 CrossRef CAS.
- P. Ezati, H. Tajik, M. Moradi and R. Molaei, Int. J. Biol. Macromol., 2019, 132, 157–165 CrossRef CAS.
- D. Yun, H. Cai, Y. Liu, L. Xiao, J. Song and J. Liu, RSC Adv., 2019, 9, 30905–30916 RSC.
- D. Yun, H. Cai, Y. Liu, L. Xiao, J. Song and J. Liu, RSC Adv., 2019, 30905–30916 RSC.
- X. Zhai, Z. Li, J. Zhang, J. Shi, X. Zou, X. Huang, D. Zhang, Y. Sun, Z. Yang, M. Holmes, Y. Gong and M. Povey, J. Agric. Food Chem., 2018, 66, 12836–12846 CrossRef CAS.
- Z. Xiaodong, J. Shi, Z. Xiaobo, W. Sheng, J. Caiping, Z. Junjun, H. Xiaowei, W. Zhang and H. Mel, Food Hydrocolloids, 2017, 69, 308–317 CrossRef.
- I. Choi, J. Young, M. Lacroix and J. Han, Food Chem., 2017, 218, 122–128 CrossRef CAS.
- C. L. Luchese, V. F. Abdalla, J. C. Spada and I. C. Tessaro, Food Hydrocolloids, 2018, 82, 209–218 CrossRef CAS.
- Q. De Arruda, R. Stefani, V. Aniceto, P. Jr and I. Nat, Food Hydrocolloids, 2015, 43, 180–188 CrossRef.
- A. Nopwinyuwong, S. Trevanich and P. Suppakul, Talanta, 2010, 81, 1126–1132 CrossRef CAS.
- T. Vo and T. Dang, Polymers, 2020, 11, 107169 Search PubMed.
- A. Mehmood, M. Ishaq, L. Zhao, S. Yaqoob, B. Safdar, M. Nadeem, M. Munir and C. Wang, Ultrason. Sonochem., 2019, 51, 12–19 CrossRef CAS.
- S. A. T. Lakshan, N. Y. Jayanath, W. P. K. M. Abeysekera and W. K. S. M. Abeysekera, Evid.-Based Complementary Altern. Med., 2019, 1–13 Search PubMed.
- E. Arezoo, E. Mohammadreza, M. Maryam and M. N. Abdorreza, Int. J. Biol. Macromol., 2020, 157, 743–751 CrossRef CAS.
- V. Goudarzi, I. Shahabi-ghahfarrokhia and A. Babaei-qazvini, Int. J. Biol. Macromol., 2017, 95, 306–313 CrossRef CAS.
- Y. Li, Y. Jiang, F. Liu, F. Ren, G. Zhao and X. Leng, Food Hydrocolloids, 2011, 25, 1098–1104 CrossRef CAS.
- Z. Wang, N. Zhang, H. Y. Wang, S. Y. Sui, X. X. Sun and Z. S. Ma, LWT--Food Sci. Technol., 2014, 57, 548–555 CrossRef CAS.
- N. Nakayama and T. Hayashi, Polym. Degrad. Stab., 2007, 92, 1255–1264 CrossRef CAS.
- Y. Qin, Y. Liu, H. Yong, J. Liu, X. Zhang and J. Liu, Int. J. Biol. Macromol., 2019, 134, 80–90 CrossRef CAS.
- T. N. Pham, D. C. Nguyen, T. D. Lam, P. Van Thinh and X. Tien, Mater. Sci. Eng., 2019, 542, 12032 CAS.
- P. Kanmani and J.-W. Rhim, Carbohydr. Polym., 2014, 106, 190–199 CrossRef CAS.
- N. El Miri, K. Abdelouahdi, A. Barakat, M. Zahouily, A. Fihri, A. Solhy and M. El Achaby, Carbohydr. Polym., 2015, 129, 156–167 CrossRef CAS.
- Y. Qin, S. Zhang, J. Yu, J. Yang, L. Xiong and Q. Sun, Carbohydr. Polym., 2016, 147, 372–378 CrossRef CAS.
- H. Wang, L. Wang, S. Ye and X. Song, Food Hydrocolloids, 2019, 88, 92–100 CrossRef CAS.
- S. H. Othman, N. R. A. Kechik, R. A. Shapi, R. A. Talib and I. S. M. A. Tawakkal, J. Nanomater., 2019, 1–12 Search PubMed.
- V. Goudarzi, I. Shahabi-ghahfarrokhi and A. Babaei-ghazvini, Int. J. Biol. Macromol., 2017, 95, 306–313 CrossRef CAS.
- M. Sapper, P. Talens and A. Chiralt, Int. J. Polym. Sci., 2019, 1–9 Search PubMed.
- J. L. Guimarães, F. Wypych, C. K. Saul, L. P. Ramos and K. G. Satyanarayana, Carbohydr. Polym., 2010, 80, 130–138 CrossRef.
- Y. Qin, S. Zhang, J. Yu, J. Yang, L. Xiong and Q. Sun, Carbohydr. Polym., 2016, 147, 372–378 CrossRef CAS.
- K. González, A. Retegi, A. González, A. Eceiza and N. Gabilondo, Carbohydr. Polym., 2015, 117, 83–90 CrossRef.
- V. Kan, E. Vargo, N. Machover, H. Ishii, S. Pan, W. Chen and Y. Kakehi, Proc. 2017 CHI Conf. Hum. factors Comput. Syst., 2017, pp. 989–1000 Search PubMed.
- X. Zhang, Y. Liu, H. Yong, Y. Qin, J. Liu and J. Liu, Food Hydrocolloids, 2019, 94, 80–92 CrossRef CAS.
- G. F. Nogueira, F. M. Fakhouri, J. I. Velasco and R. A. de Oliveira, Polymers, 2019, 11, 1382 CrossRef CAS.
- Y. C. Wei, C. H. Cheng, Y. C. Ho, M. L. Tsai and F. L. Mi, Food Hydrocolloids, 2017, 69, 491–502 CAS.
- O. Lopez, M. a. Garcia, M. a. Villar, a. Gentili, M. S. Rodriguez and L. Albertengo, LWT--Food Sci. Technol., 2014, 57, 106–115 CAS.
- G. Abera, B. Woldeyes, H. D. Demash and G. Miyake, Int. J. Biol. Macromol., 2020, 155, 581–587 CrossRef CAS.
- A. Alshehri and A. Malik, RSC Adv., 2017, 7, 25149–25159 RSC.
- A. Ali, Y. Chen, H. Liu, L. Yu, Z. Baloch, S. Khalid, J. Zhu and L. Chen, Int. J. Biol. Macromol., 2019, 129, 1120–1126 CrossRef CAS.
- J. Chen, Z. Long, S. Wang, Y. Meng, G. Zhang and S. Nie, Int. J. Biol. Macromol., 2019, 139, 367–376 CrossRef CAS.
- Y. Qin, Y. Liu, L. Yuan, H. Yong and J. Liu, Food Hydrocolloids, 2019, 96, 102–111 CrossRef CAS.
- R. Andretta, C. L. Luchese, I. C. Tessaro and J. C. Spada, Food Hydrocolloids, 2019, 93, 317–324 CrossRef CAS.
- S. Kang, H. Wang, M. Guo, L. Zhang, M. Chen, S. Jiang, X. Li and S. Jiang, J. Agric. Food Chem., 2018, 66, 13268–13276 CrossRef CAS.
| This journal is © The Royal Society of Chemistry 2020 |

