 Open Access Article
Human red blood cell behaviour in hydroxyethyl starch: probed by single cell spectroscopy†
Mithun Na,
Jijo Lukose a,
Shamee Shastry
 b,
Ganesh Mohan
 b and
Santhosh Chidangil
 *a
*a
aCentre of Excellence for Biophotonics, Department of Atomic and Molecular Physics, Manipal Academy of Higher Education, Karnataka 576104, India. E-mail: santhosh.cls@manipal.edu
bDepartment of Immunohematology and Blood Transfusion, Kasturba Medical College, Manipal, Manipal Academy of Higher Education, Manipal, Karnataka 576104, India
First published on 26th August 2020
Abstract
Hydroxyethyl starch (HES) is a commonly used intravenous fluid in hospital settings. The merits and demerits of its application is still a debatable topic. Investigating the interaction of external agents like intravenous fluids with blood cells is of great significance in clinical environments. Micro-Raman spectroscopy combined with an optical tweezers technique has been utilized for conducting systematic investigations of single live red blood cells (RBCs) under the influence of external stress agents. The present work deals with a detailed biophysical study on the response of human live red blood cells in hydroxyethyl starch using optical techniques. Morphological changes in red blood cells were monitored using quantitate phase imaging techniques. Micro-Raman studies suggest that there is a significant reduction in the oxy-haemoglobin level in red blood cells suspended in HES. The spectra recorded by using different probe laser powers has shown that the cells are more vulnerable in HES under the influence of externally induced stress than in blood plasma. In addition, the spectral results support the possibility of heme aggregation and membrane damage for red blood cells in HES under externally induced stress. Principle component analysis performed on the Raman spectra were able to effectively discriminate between red blood cells in HES and in blood plasma. The use of Raman tweezers can be highly beneficial in elucidating biochemical alterations happening in live, human red blood cell.
Introduction
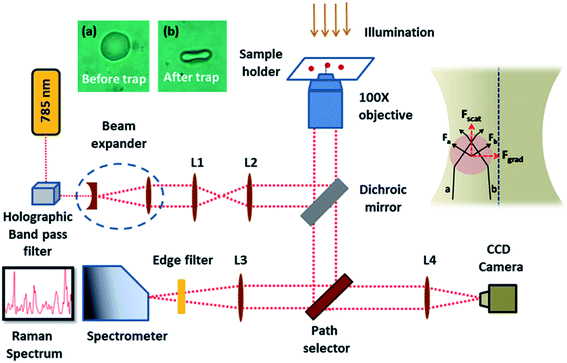
Investigation of whole blood and blood components is an area of importance in clinical diagnostics, blood transfusion, oncology etc. Spectroscopy tools and in particular Raman spectroscopy have been in the forefront for more than four decades in blood related research. This technique based on inelastic light scattering can provide the constituents of any material of interest because the method provides molecular fingerprints of the sample.1 The low scattering cross-section of water molecules, minimal sample preparation protocol and the absence of external labelling agents makes this technique more acceptable for assessing biological samples. Recently Barker et al. have demonstrated the potential of Raman spectroscopy as a promising tool for monitoring the biochemical features of Huntington's disease and its progression by studying blood serum.2 Similar reports have also appeared in the Lancet this year, recommending the use of Raman spectroscopy as a cost effective tool for identifying colorectal cancer (CRC) which can reduce colonoscopies and the other diagnostic requirements for patients in the Urgent Suspected Cancer (USC) pathway for CRC.3 Raman spectroscopy based blood tests have also provided better performance as compared to the conventional USC pathway for cancer prediction.3 Parlatan et al. have used the combination of Raman spectroscopy and statistical classification models for the diagnosis of endometriosis from blood serum thereby discouraging the necessity for laparoscopy.4 Similarly Raman technique along with multivariate analysis tools have been found effective in monitoring the prostate specific antigen (PSA) levels in serum samples, which can pave way for the detection of prostate cancer at a later stage.5 Researchers have enabled the discrimination of iron deficiency anemia and sickle cell anemia with 95% accuracy from blood samples using Raman spectroscopy and partial least squares (PLS-DA) discriminant analysis.6 Ullah et al. reported the ability of Raman technique for asthma screening by demonstrating the effective classification of serum spectra from asthmatic and healthy individuals using PLS-DA.7 Raman spectroscopy analysis have been reported as a potential tool in order to evaluate the therapeutic response in patients suffering from breast cancer. The relative changes of biomolecules such as tryptophan, tyrosine, phenylalanine, proteins, carotenoids and lipids in blood plasma have been observed in the Raman spectrum which was good enough to discriminate pre and post treatment conditions.8 Reports have also pointed out that the futuristic use of this technique as a primary tool for lung cancer detection since the spectral variations in blood serum were able to differentiate between healthy and individuals with lung cancer. In addition to diagnosis, spectral differences can also lead to the staging of cancers, which is crucial in deciding the treatment strategies.9 Discrimination of human and non-human samples from blood stains were estimated with a portable Raman spectrometer and principle component analysis, which suggested that the potential of this technique in forensic applications.10 Researchers have also demonstrated the possibility of this technique for the discrimination of individuals based on their chronological age by analyzing the blood stains. With the support of chemometrics, they were able to identify newborn from adolescent and adult donors without any false negative cases.11 Gender discrimination from the blood stains have been also realized by combing Raman spectral analysis with statistical tool such as support vector machines (SVM) and artificial neuron network (ANN).12Despite the ubiquitous applications of Raman spectroscopy, it also suffers from major pitfalls while performing single live cell (e.g. blood cells) studies in physiological conditions. Brownian motion of micron sized live cells in aqueous solutions restricts the application of Raman spectroscopy for studying single cells. Inherent functionality of the cells will be perturbed during its immobilization on a substrate via physical (freeze drying) or chemical approaches (chemical fixing).13 Wood et al. have also noticed considerable variations in the heme environment of red blood cell (RBC), which resulted in the formation of hemichrome and hemochrome respectively during cell fixation and dried cell samples.14 This limitation can be countered by the use of Optical Tweezers (OT), which is able to optically trap the live cell in an aqueous environment using a focused laser beam. The net trapping force resulted from laser beam on a dielectric particle (e.g. blood cell) is the cumulative effect of the scattering force which acts in the light propagation direction and gradient force which acts along spatial light gradient (inset of Fig. 1).
Optical tweezers have been commonly used to study the cell deformability under abnormal conditions, where the deformability index has been found to be less in diabetic individuals compared to normal.15 In a similar fashion, OT has also been utilized for assessing the RBC deformability in diseases such as sickle cell anemia, thalassemia, malaria etc.16,17 Increase in the rigidity of red blood cells was found in iron deficient anemic cases in an optical tweezers based study report.18 Raman spectroscopy coupled with optical tweezers have been established as a reliable method for inspecting the biochemical changes at individual cell level. Nanoparticle induced stress on human red blood cells has been investigated using Raman Tweezers and observed an increased adverse effects in silver nanoparticles as compared to gold nanoparticles.19 Raman Tweezers technique is proven as the best technique for the investigation of the oxygenation state of red blood cells and malaria infected cells were found to have reduced oxygen affinity.20 Researchers have performed blood grouping, where Raman Tweezers analysis combined with statistical models were able to discriminate AB group from other blood groups with 100% accuracy.21
Transfusion medicine in clinical settings is an area where the use of Raman Tweezers has not been explored much. Raman Tweezers can be a reliable tool for evaluating the impact of intravenous fluid therapy on human red blood cells, which is an area of concern. Intravenous fluid therapy involves the administration of crystalloids and colloidal solutions which plays a vital part in managing critical conditions in medical emergencies.22,23 Crystalloid solutions are used for patients hospitalized with sepsis, for the correction of hypovolemia, shock etc. Colloidal solutions have been using for acute fluid resuscitation in trauma and in hypovolemic shock in Intensive Care Unit (ICU) patients. Recent years have been witnessing a considerable number of studies regarding the use of various fluids for the intravenous infusion in hospital as well as pre hospital settings. Debates are still on in connection with safety concerns and advantages of colloids and crystalloids based therapies. National Confidential Enquiry into Perioperative Deaths (NCEPOD) report has pointed out that inappropriate administration of fluid therapy have been adversely affecting 1 out of every 5 patients.24 Colloidal fluids have been a superior choice for perioperative fluid therapy, even though the scientific merits regarding its pros over other fluids and cons over the patients with sepsis and critically ill are limited.22 Even though various colloids are in use in medical practice in different nations, hydroxyethyl starch is the most commonly used in a global perspective than the other competitors.25,26 Serious concerns have been reported against utilizing hydroxyethyl starch (HES) administration in clinical settings.27 Results based on multicentric trails reported that the patients with sepsis administrated with HES had a higher probability of renal failure and bleeding.28–30 Moreover the mortality of sepsis patients were higher in HES administration as compared to crystalloids.28,29 European Medicines Agency (EMA) have suspended the use of HES after receiving the petition by German Federal Institute for Drugs and Medical Devices, addressing the critical concerns pointed in different clinical trails. But the use of HES has received permission again after the second review by EMA committee. As per the global estimates, more than 200 million units of HES have been in use over the past 10 years.27 Some trials were not able to detect any complications in HES administration31–33 regardless of the prior trial results which questioned the safety of HES solution. To the best of our knowledge, the potential of Raman Tweezers technique for the analysis of human red blood cells under the influence of HES has not been assessed till date. In view of this, the present work deals with the micro-Raman spectroscopic monitoring of an optically trapped single, live human red blood cell suspended in HES as well as the cells under the influence of external stress.
Experimental method
The present set of experiments were conducted after obtaining permission (Ref: IEC: 68/2018) from the Institutional Ethics Committee, Kasturba Medical College and Kasturba Hospital, Manipal. Sample collection was carried out by the Blood Bank, Kasturba Medical College, Manipal, India. Informed consent was obtained from human subjects. Whole blood collected from healthy volunteers was centrifuged for 5 minutes at 3000 rpm in order to obtain the packed red blood cells (PRBC). PRBC obtained was diluted and suspended in blood plasma/HES solution prior to Raman measurements in order to avoid the chance of multiple cell trapping from laser spot. Hydroxyethyl Starch (HES) 6% solution (Voluven, Fresenius Kabi India Pvt. Limited) has been used for the present study, since it is the standard concentration (6 g HES in 100 mL of 0.9% normal saline) in use under clinical settings. To correct the hypovolemia, one of the life-threatening condition, HES solution has been transfused at a maximum dose of 50 mL per kg per 24 hours in resuscitating patients. All Raman spectra were recorded within an hour after the blood collection. All the Raman measurements shown in the present work were recorded using a home-built Raman Tweezers system as shown in Fig. 1. This system was equipped with a 785 nm wavelength laser (Star bright Diode Laser, Torsana Laser Tech, Denmark), which is tightly focused onto the sample solution via a high numerical aperture (1.3× NA), 100× oil immersion microscope objective of a Nikon Eclipse Ti-U microscope. The scattered Raman signals are dispersed using a Horiba Jobin Yvon iHR320 Spectrograph equipped with a 1200 grooves per mm holographic grating. A liquid nitrogen cooled CCD detector (Symphony CCD-1024 × 256-OPEN-1LS) is employed to acquire the Raman spectra of optically trapped cells. The instrument employed in the work has been already explained in the previous literature.19 Baseline correction as well as normalization of Raman spectra after smoothing was performed in MATLAB via vector normalization method. The picture of RBC before and under optical trap is provided in the inset of Fig. 1.Results and discussions
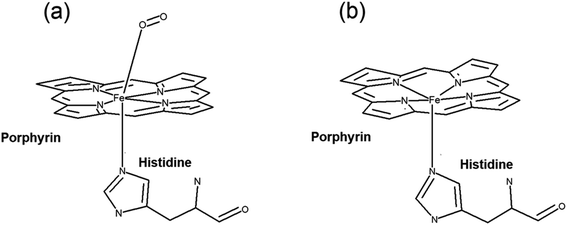
Raman tweezers set up can be exploited as an effective spectroscopic tool for investigating single live red blood cells since it can provide micro-Raman spectra of the cell. At the same time, laser powers used for trapping can itself act as an external stimuli which can impart a stress and the Raman signatures from the trapped cells enables the simultaneous monitoring of the biochemical response of the cell to the applied stress. The response of RBCs suspended in HES were subjected to different laser powers and compared the response of cells in blood plasma. RBCs in blood plasma is opted as control in the present study since it is the ideal solvent to mimic the physiological environment. Red blood cells are composed of a lipid bilayer with a globular protein (hemoglobin) embedded in it. Hemoglobin, the major protein in red blood cell holds the authority of carrying oxygen to the tissues all over the body from lungs. This protein is made up of two alpha and beta subunits, where each subunit carries a heme group.34 The iron in the form of Fe2+ surrounded by a heterocyclic porphyrin ring in heme is the crucial factor determining the oxygen carrying capacity of blood. The four out of six coordination sites are bonded by porphyrin nitrogen's, and the fifth site is covalently bound to proximal histidine residue from the globin chain. It is the vacant sixth coordination site in the iron atom, which holds the functioning of oxygen binding. In oxygenated hemoglobin, this site is occupied by the dioxygen molecule and remains vacant in deoxygenated hemoglobin. In the latter case, the bond formed between the iron at the heme center and the nitrogen of histidine F8 undergoes a small tilt in angle from perpendicular to the plane of porphyrin ring. In this case, iron is pulled ∼0.04 nm out of the porphyrin ring plane which results in a dome structure with iron at the apex.35 The change in heme from planar to domed configuration will be reflected in the major molecular vibrations associated with porphyrin ring (Fig. 2). This can be utilized for evaluating the oxygenation state of heme molecule inside a single cell under an external stimuli.Raman spectra obtained for red blood cells at different powers in plasma and HES are given in Fig. 3(a–d). Each spectra shown in the figure is an average of 10 different cells and all the experiments were finished within an hour of sample collection. As it can be seen from the Fig. 3, most of the Raman bands were present in both the cases. Even though, spectral intensity changes were observed for some Raman peaks in case of HES as compared to cell in blood plasma. The 1200–1300 cm−1 region is of high importance due to the presence of in-plane bending vibrations of the methine C–H. These vibrational bands will highly influenced by the coordination between porphyrin ring and the central iron atom. The close proximity of these vibrations to protein subunits makes these bands a primary choice for evaluating the oxygenation response in a single cell. The peak at 1222 cm−1 is treated as a oxyhemoglobin indicator whereas the other band at 1209 cm−1 is used for pointing the deoxyhemoglobin status. Similarly the spin marker region consisting 1500 cm−1 to 1650 cm−1 is also of high interest, since the three bands present at 1544 cm−1, 1561 cm−1 and 1636 cm−1 are often used as oxygenation/deoxygenation markers. These bands originating due to C–C stretching are influenced by the spin state of the iron atom in the heme and are sensitive to any distortions happening in the heme.36 The deoxygenated hemoglobin contains iron in a high spin state, whereas the oxygen bound iron in oxyhemoglobin is in low spin state. The band at 1544 cm−1 is treated as a marker for high spin state whereas 1561 cm−1 is a characteristic band for low spin state. The band at 1636 cm−1 is also regarded as the oxygen concentration marker in Raman spectra of an RBC.
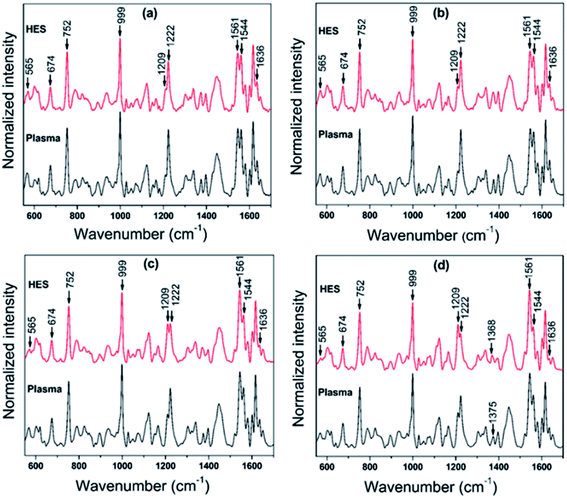 | ||
| Fig. 3 Raman spectra for RBCs in control and HES at four different laser powers (a) ∼3 mW (b) ∼5 mW, (c) ∼7 mW and (d) ∼11 mW. | ||
In order to display the variations in oxy–deoxy bands for RBCs at different laser powers, a bar diagram is given in Fig. 4. This bar diagram is obtained by estimating the ratio of intensities of the bands present at 1222 cm−1/1209 cm−1 in methine deformation region and 1561 cm−1/1544 cm−1 in spin marker region. A decrease in hemoglobin oxygenation was observed for red blood cells suspended in both blood plasma and HES with respective to the laser power. It is also evident that from Fig. 4(a) that the RBCs suspended in HES displayed significant intensity decline as compared to control cells. In other words, cells in plasma were not able to hold the oxyhemoglobin status as in the case of plasma at stress induced by laser powers. This decrease in ratio in HES can be attributed towards the decrease in strength of the coordination between iron and the porphyrin ring as the atom is pushed out from the center during the oxy- to deoxy transition. The intensity obtained for 1636 cm−1 band in spin marker region which is a characteristic marker for oxygenation, is also estimated and displayed as bar diagram in Fig. 4.36 This figure also supported the decrease in oxygenation in HES as compared to cells in blood plasma.
 | ||
| Fig. 4 Bar diagram indicating the oxy-deoxy hemoglobin ratios obtained for RBCs in control and HES at different laser powers for (a) methine deformation region and (b) and (c) spin marker region. | ||
The deoxygenation tendency in HES is again verified by estimating the band intensities attributed to pyrrole deformation mode at 674 cm−1. This band is known to be higher in case of planar configuration of porphyrin as compared to the domed or pyramidal conformation. Once the oxygen dissociation from heme occurs, the planar configuration will be perturbed and ultimately this vibration will be mixed with the out of plane modes.37 This perturbation from breathing motion can result in the intensity decrease for 674 cm−1 band in case of deoxygenated heme. Similarly the decrease in oxygen ligation with iron was also evident from the intensity reduction in Fe–O2 stretch at 565 cm−1 in HES (Fig. 5).
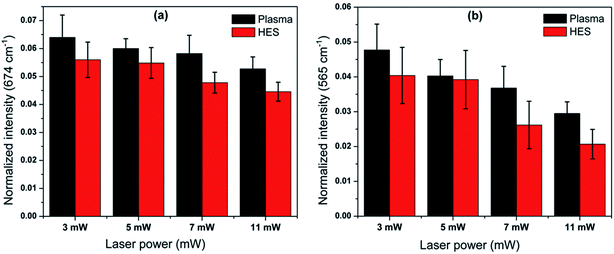 | ||
| Fig. 5 Bar diagram indicating the intensity variation of the Raman frequency at (a) 674 cm−1 and (b) 565 cm−1. | ||
The band assigned to C–N–C breathing stretch at 752 cm−1 is considered as an important marker for evaluating the hemoglobin intact nature.38 An intensity decrease was also observed for this band in HES for all different laser powers compared to that of corresponding plasma values. The band at 999 cm−1 assigned to phenylalanine also displayed similar trend of decrease in case of HES. The decrease in trend in HES with respect to plasma is also validated from the decrease in another phenylalanine band at 897 cm−1. Some literatures have attributed the decrease in intensities in these bands due to any alteration in the oxidation environment of heme in red blood cells. At the same time, reports have also pointed out about the probability of hemoglobin depletion in RBC by external factors which can result in a decrease of intensity in these bands.38,39 The bands at phenylalanine are not solely contributed by hemoglobin, since the past works performed on RBC ghost cells have also mentioned about the presence of phenylalanine bands.40,41 In this case, we may presume some contributions from membrane proteins in addition to hemoglobin degradation which overall resulted in a decrease in phenylalanine band intensities (Fig. 6).
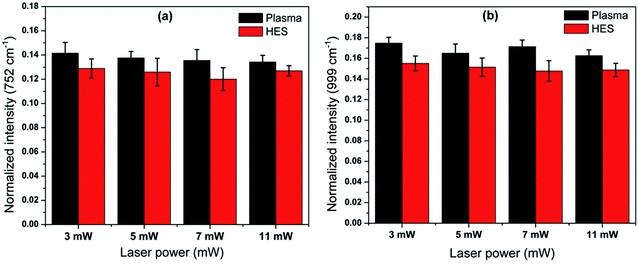 | ||
| Fig. 6 Bar diagram indicating the intensity variation of the Raman frequency (a) 752 cm−1 and (b) 999 cm−1. | ||
In brief, a complete switching of oxy-deoxy markers were observed in methine deformation region in HES as compared to plasma at a laser stress induced at ∼11 mW as shown in Fig. 3(d). The peak at 1209 cm−1 became prominent than 1222 cm−1 and vice versa is maintained in case of red blood cells in plasma. Similar is the case with the all oxygenation markers in RBC. The 565 cm−1 band in the low frequency region due to Fe–O2 stretch was also found to be less intense in case of RBCs diluted in HES. The peak at 674 cm−1 belongs to pyrrole deformation also suffered a decrease in RBCs suspended in HES as compared to blood plasma. Another perspective to be noted is the probable heme aggregate formation in RBCs. The shift in pyrrole deformation band from 1375 cm−1 to 1368 cm−1 is an indication of heme aggregation resulted from protein denaturation in RBC. This can be also validated by a shoulder originated at 1244 cm−1 in case of cells suspended in HES. As per the literature, these changes are resulting from the possibility of forming heme aggregates due to protein denaturation inside RBC, in case of HES.42,43 Similarly the chance of membrane damage for RBC in HES under external stress can be again speculated from the intensity decrease in CH2/CH3 deformation modes at 1447 cm−1 originated from amino acid side chains.44 It is crucial to found out that HES was not able to maintain the hemoglobin oxygenation ability in red blood cells as much as that of blood plasma at even lowest power of optical trap. As the stress induced by the laser increases, adverse events such as heme aggregation and degradation may probably occur for RBCs in HES. Blood plasma was able to maintain a better oxyhemoglobin status in RBCs than HES under all the conditions.
Principle component analysis were performed on the Raman spectra obtained for cells at four different laser powers in HES and plasma. The PCA plots obtained for spectra at ∼3 mW, ∼7 mW, ∼9 mW and ∼11 mW are given in Fig. 7a, b, c and d respectively. PCA is a widely used statistical analytical tool in Raman spectroscopy in order to acquire discrimination amongst spectral data belongs to various classifications. In previous literatures, multivariate analysis tool have been successfully employed for the various medical applications which includes cancer cell lines discrimination, differentiating apoptosis and necrosis in K562 leukemia cells, classification of live and apoptotic human gastric cancer cells etc.45–47 In the present work, PCA was performed on a total of 20 spectra each in four different laser powers, in which 10 spectra each from RBCs suspended in HES and plasma. This tool have been able to provide very good discrimination amongst the RBCs suspended in HES and plasma. The discrimination amongst two classes of RBCs was clear at all four different laser powers. This again validates the fact that RBCs in HES behaves in a different manner compared to that of plasma.
 | ||
| Fig. 7 PCA plot for Raman spectra for RBCs in control and HES at (a) ∼3 mW (b) ∼5 mW (c) ∼7 mW and (d) ∼11 mW. | ||
The factor loading of PC 1 (F1) plots obtained for four different laser powers are plotted in Fig. 8 in order to provide an insight into the spectral changes that characterize the effective discrimination displayed in Fig. 7. The main components contributed for the discrimination obtained in PCA analysis have arised from the Raman signals at 1209 cm−1, 1222 cm−1, 1544 cm−1, 1565 cm−1, and 1636 cm−1 as evident from the factor loading plots. All these bands corresponds to the hemoglobin oxygenation-deoxygenation marker peaks of red blood cells. As mentioned earlier, the peaks at 999 cm−1, 752 cm−1, 565 cm−1 and 674 cm−1 also undergoes variations, which is evident in the loading plots. Moreover, Raman spectra of HES solution has been already reported elsewhere, where the characteristics bands were observed at 865 cm−1, 940 cm−1, 1065 cm−1, 1085 cm−1, 1335 cm−1, 1380 cm−1 and 1460 cm−1 which are not observed in the recorded Raman spectra in the present study.48 Thus it can be confirmed that loading components in the present analysis are not originating from the HES solvent. Rather, the variations in the hemoglobin oxygenation status of RBC is due to the impact of HES on the cells which in turn is responsible for the discrimination obtained in scores plot shown in Fig. 7. In brief, PCA plots has been dominated by the contribution from the inherent peaks of RBC itself, not from the bands of HES.
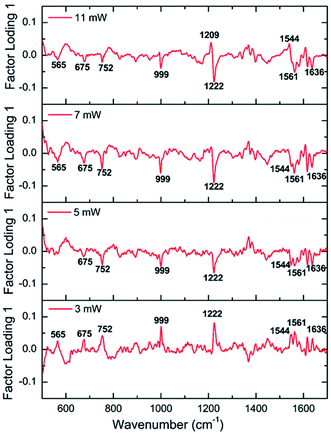 | ||
| Fig. 8 Loading plots for scores of factor 1 (PC1) obtained at different laser powers (3 mW, 5 mW, 7 mW and 11 mW). | ||
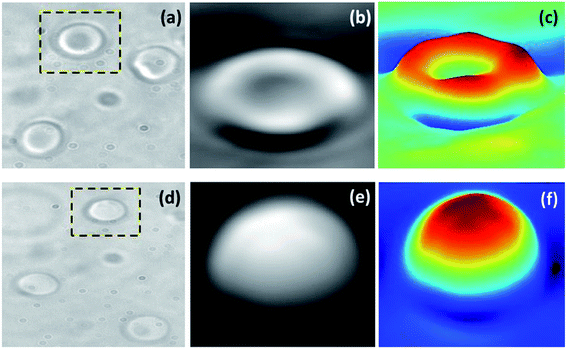
The morphological variations in red blood cells in both HES and blood plasma were imaged using quantitative phase imaging technique with the help of d'Bioimager (d'Optron). The microscopic images were obtained as shown in Fig. 9(a) and the corresponding 3D view of the cell are as shown in Fig. 9(c). Morphological variations in RBC structure is clear from the surface profiles as the usual discoid shape of cells in plasma were changed to sphereocyte formation in case of HES. This indicates the alterations in the RBC cytoskeleton structure, which can adversely affect RBC deformation ability. Because the high surface to volume ratio of discocyte shape is the crucial factor which enables elastic deformation of RBC, which makes its microcirculation through small capillaries easily possible.49 The sphereocytes shaped RBCs are also more vulnerable to damage and the deviation from the inherent cell morphology are linked with hematological disorders.50
Hypovolemic shock results in tissue hypoxia and organ damage because of inadequate blood flow through micro circulation. 6% HES is used to resuscitate patients who are in hypovolemic shock. HES is a colloidal solution which causes expansion of plasma volume thereby improving the end organ microcirculation. Current study highlight the effect of HES on red cells compared to blood plasma. Tissue oxygenation is the main purpose of red blood cells and normally red cells deliver the oxygen to the tissues. However, HES tend to decrease the oxy/deoxy ratio in red cells there by limiting both the capability of red cells to transport and deliver oxygen to the end organs. The red cell deformability is another crucial factor which permit the red cells to pass through capillaries in the end organs and carry out exchange of gases. The morphological changes of red cells associated with HES may also hamper the flow through micro capillaries leading to improper tissue perfusion. These in vitro experimental observation suggests that using HES in critically ill patient may lead to bad outcome in terms of tissue perfusion when we compared with plasma transfusion.
Conclusions
Interrogation of red blood cell responses to external stimuli are of prime significance in hematology, transfusion medicine, oncology etc. Single cell spectroscopy using Raman Tweezers instrument has been an indispensable spectroscopic tool, which can provide valuable insights in to the red blood cell dynamics and cells under the influence of exogenous agents. The influence of hydroxyethyl starch (HES) an important intravenous fluid on live human red blood cell at individual cell level is investigated with the aid of Raman Tweezers technique. The response of cells in HES were also evaluated under the influence of different Raman probe laser powers. Spectral features extracted from Raman spectroscopy studies have revealed transition from oxyhemoglobin towards deoxygenated state in case of cells suspended in HES. Moreover, adverse effects on hemoglobin and RBC membrane were also observed. Heme aggregation also tend to occur in case of cells in HES exposed to ∼11 mW laser power. Morphological transitions of discocyte shaped RBC to sphereocyte shape was evident from phase imaging measurements. Detailed biochemical and hematological investigations are required to completely elucidate the mechanisms of red blood cell in HES.Conflicts of interest
The authors declare that they have no known competing financial interests or personal relationships that could have appeared to influence the work reported in this paper.Acknowledgements
Authors are thankful to Department of Biotechnology (DBT), Govt. of. India for developing the Raman Tweezers facility under the grant (BT/PR6413/MED/14/802/2005) and DST-FIST (Ref. SR/FST/PSI-174/2012) for other facilities. Mithun. N. acknowledges Manipal Academy of Higher Education for Dr TMA Pai Doctoral fellowship. Authors also like to acknowledge the staffs of Blood Bank, Kasturba Medical College, Manipal, for their support.References
- C. G. Atkins, K. Buckley, M. W. Blades and R. F. Turner, Raman spectroscopy of blood and blood components, Appl. Spectrosc., 2017, 71(5), 767–793 CrossRef CAS PubMed.
- A. Huefner, W.-L. Kuan, S. L. Mason, S. Mahajan and R. A. Barker, Serum Raman spectroscopy as a diagnostic tool in patients with Huntington's disease, Chem. Sci., 2020 Search PubMed.
- C. A. Jenkins; S. Chandler; R. Jenkins; K. Thorne; A. Cunningham; K. Nelson; R. Still; J. Walters; N. Gwynn; W. Chea, A New Method to Triage Colorectal Cancer Referrals in the UK Using Serum Raman Spectroscopy: A Prospective Cohort Study. 2020 Search PubMed.
- U. Parlatan, M. T. Inanc, B. Y. Ozgor, E. Oral, E. Bastu, M. B. Unlu and G. Basar, Raman spectroscopy as a non-invasive diagnostic technique for endometriosis, Sci. Rep., 2019, 9 CAS.
- N. A. Correia, L. T. Batista, R. J. Nascimento, M. C. Cangussú, P. J. Crugeira, L. G. Soares, L. Silveira Jr and A. L. Pinheiro, Detection of prostate cancer by Raman spectroscopy: A multivariate study on patients with normal and altered PSA values, J. Photochem. Photobiol., B, 2020, 204, 111801 CrossRef CAS PubMed.
- W. R. da Silva, L. Silveira and A. B. Fernandes, Diagnosing sickle cell disease and iron deficiency anemia in human blood by Raman spectroscopy, Laser Med. Sci., 2019, 1–10 Search PubMed.
- R. Ullah, S. Khan, F. Farman, M. Bilal, C. Krafft and S. Shahzad, Demonstrating the application of Raman spectroscopy together with chemometric technique for screening of asthma disease, Biomed. Optic Express, 2019, 10(2), 600–609 CrossRef CAS.
- C. Krishnamoorthy, A. Prakasarao, V. Srinivasan, S. P. GN and G. Singaravelu, Monitoring of breast cancer patients under pre and post treated conditions using Raman spectroscopic analysis of blood plasma, Vib. Spectrosc., 2019, 105, 102982 CrossRef CAS.
- H. Wang, S. Zhang, L. Wan, H. Sun, J. Tan and Q. Su, Screening and staging for non-small cell lung cancer by serum laser Raman spectroscopy, Spectrochim. Acta, Part A, 2018, 201, 34–38 CrossRef CAS.
- J. Fujihara, Y. Fujita, T. Yamamoto, N. Nishimoto, K. Kimura-Kataoka, S. Kurata, Y. Takinami, T. Yasuda and H. Takeshita, Blood identification and discrimination between human and nonhuman blood using portable Raman spectroscopy, Int. J. Leg. Med., 2017, 131(2), 319–322 CrossRef CAS.
- K. C. Doty and I. K. Lednev, Differentiating donor age groups based on Raman spectroscopy of bloodstains for forensic purposes, ACS Cent. Sci., 2018, 4(7), 862–867 CrossRef CAS PubMed.
- A. Sikirzhytskaya, V. Sikirzhytski and I. K. Lednev, Determining gender by Raman spectroscopy of a bloodstain, Anal. Chem., 2017, 89(3), 1486–1492 CrossRef CAS PubMed.
- C. Xie, C. Goodman, M. A. Dinno and Y.-Q. Li, Real-time Raman spectroscopy of optically trapped living cells and organelles, Opt. Express, 2004, 12(25), 6208–6214 CrossRef PubMed.
- M. Asghari-Khiavi, A. Mechler, K. R. Bambery, D. McNaughton and B. R. Wood, A resonance Raman spectroscopic investigation into the effects of fixation and dehydration on heme environment of hemoglobin, J. Raman Spectrosc., 2009, 40(11), 1668–1674 CrossRef CAS.
- R. Agrawal, T. Smart, J. Nobre-Cardoso, C. Richards, R. Bhatnagar, A. Tufail, D. Shima, P. H. Jones and C. Pavesio, Assessment of red blood cell deformability in type 2 diabetes mellitus and diabetic retinopathy by dual optical tweezers stretching technique, Sci. Rep., 2016, 6, 15873 CrossRef CAS PubMed.
- M. Brandao, A. Fontes, M. Barjas-Castro, L. Barbosa, F. Costa, C. Cesar and S. Saad, Optical tweezers for measuring red blood cell elasticity: application to the study of drug response in sickle cell disease, Eur. J. Haematol., 2003, 70(4), 207–211 CrossRef CAS.
- S. Suresh, J. Spatz, J. P. Mills, A. Micoulet, M. Dao, C. Lim, M. Beil and T. Seufferlein, Connections between single-cell biomechanics and human disease states: gastrointestinal cancer and malaria, Acta Biomater., 2005, 1(1), 15–30 CrossRef CAS.
- M. M. Brandao, M. d. L. R. Castro, A. Fontes, C. L. Cesar, F. F. Costa and S. T. Saad, Impaired red cell deformability in iron deficient subjects, Clin. Hemorheol. Microcirc., 2009, 43(3), 217–221 CAS.
- S. Barkur, J. Lukose and S. Chidangil, Probing Nanoparticle–Cell Interaction Using Micro-Raman Spectroscopy: Silver and Gold Nanoparticle-Induced Stress Effects on Optically Trapped Live Red Blood Cells, ACS Omega, 2020 Search PubMed.
- R. Dasgupta, R. S. Verma, S. Ahlawat, A. Uppal and P. K. Gupta, Studies on erythrocytes in malaria infected blood sample with Raman optical tweezers, J. Biomed. Optic., 2011, 16(7) CAS.
- D. Lin, Z. Zheng, Q. Wang, H. Huang, Z. Huang, Y. Yu, S. Qiu, C. Wen, M. Cheng and S. Feng, Label-free optical sensor based on red blood cells laser tweezers Raman spectroscopy analysis for ABO blood typing, Optic Express, 2016, 24(21), 24750–24759 CrossRef CAS.
- M. Mandal, Ideal resuscitation fluid in hypovolemia: the quest is on and miles to go!, Int. J. Crit. Illn. Inj. Sci., 2016, 6(2), 54 CrossRef PubMed.
- G. Liamis, T. D. Filippatos and M. S. Elisaf, Correction of hypovolemia with crystalloid fluids: individualizing infusion therapy, Postgrad. Med., 2015, 127(4), 405–412 CrossRef PubMed.
- S. Padhi, I. Bullock, L. Li and M. Stroud, Intravenous fluid therapy for adults in hospital: summary of NICE guidance, Bmj, 2013, 347, f7073 CrossRef PubMed.
- N. Haase, A. Perner, L. I. Hennings, M. Siegemund, B. Lauridsen, M. Wetterslev and J. Wetterslev, Hydroxyethyl starch 130/0.38-0.45 versus crystalloid or albumin in patients with sepsis: systematic review with meta-analysis and trial sequential analysis, Bmj, 2013, 346, f839 CrossRef PubMed.
- S. Finfer, B. Liu, C. Taylor, R. Bellomo, L. Billot, D. Cook, B. Du, C. McArthur, J. Myburgh and S. T. Investigators, Resuscitation fluid use in critically ill adults: an international cross-sectional study in 391 intensive care units, Crit. Care, 2010, 14(5), R185 CrossRef.
- C. S. Hartog, C. Natanson, J. Sun, H. G. Klein and K. Reinhart, Concerns over use of hydroxyethyl starch solutions, Bmj, 2014, 349, g5981 CrossRef PubMed.
- F. M. Brunkhorst, C. Engel, F. Bloos, A. Meier-Hellmann, M. Ragaller, N. Weiler, O. Moerer, M. Gruendling, M. Oppert and S. Grond, Intensive insulin therapy and pentastarch resuscitation in severe sepsis, N. Engl. J. Med., 2008, 358(2), 125–139 CrossRef CAS PubMed.
- A. Perner, N. Haase, A. B. Guttormsen, J. Tenhunen, G. Klemenzson, A. Åneman, K. R. Madsen, M. H. Møller, J. M. Elkjær and L. M. Poulsen, Hydroxyethyl starch 130/0.42 versus Ringer's acetate in severe sepsis, N. Engl. J. Med., 2012, 367(2), 124–134 CrossRef CAS.
- J. A. Myburgh, S. Finfer, R. Bellomo, L. Billot, A. Cass, D. Gattas, P. Glass, J. Lipman, B. Liu and C. McArthur, Hydroxyethyl starch or saline for fluid resuscitation in intensive care, N. Engl. J. Med., 2012, 367(20), 1901–1911 CrossRef CAS PubMed.
- X.-J. Du, W.-M. Hu, Q. Xia, Z.-W. Huang, G.-Y. Chen, X.-D. Jin, P. Xue, H.-M. Lu, N.-w. Ke and Z.-D. Zhang, Hydroxyethyl starch resuscitation reduces the risk of intra-abdominal hypertension in severe acute pancreatitis, Pancreas, 2011, 40(8), 1220–1225 CrossRef CAS PubMed.
- A. Dubin, M. O. Pozo, C. A. Casabella, G. Murias, F. Pálizas Jr, M. C. Moseinco, V. S. K. Edul, F. Pálizas, E. Estenssoro and C. Ince, Comparison of 6% hydroxyethyl starch 130/0.4 and saline solution for resuscitation of the microcirculation during the early goal-directed therapy of septic patients, J. Crit. Care, 2010, 25(4), 659. e1–659. e8 CrossRef PubMed.
- M. James, W. Michell, I. Joubert, A. Nicol, P. Navsaria and R. Gillespie, Resuscitation with hydroxyethyl starch improves renal function and lactate clearance in penetrating trauma in a randomized controlled study: the FIRST trial (Fluids in Resuscitation of Severe Trauma), Br. J. Anaesth., 2011, 107(5), 693–702 CrossRef CAS PubMed.
- J. Hoard, Stereochemistry of hemes and other metalloporphyrins, Science, 1971, 174(4016), 1295–1302 CrossRef CAS PubMed.
- S. Franzen, J. Lambry, B. Bohn, C. Poyart and J. Martin, Direct evidence for the role of haem doming as the primary event in the cooperative transition of haemoglobin, Nat. Struct. Biol., 1994, 1(4), 230–233 CrossRef CAS PubMed.
- B. R. Wood, B. Tait and D. McNaughton, Micro-Raman characterisation of the R to T state transition of haemoglobin within a single living erythrocyte, Biochim. Biophys. Acta, Mol. Cell Res., 2001, 1539(1–2), 58–70 CrossRef CAS.
- M. Abe, T. Kitagawa and Y. Kyogoku, Resonance Raman spectra of octaethylporphyrinato-Ni (II) and meso-deuterated and 15N substituted derivatives. II. A normal coordinate analysis, J. Chem. Phys., 1978, 69(10), 4526–4534 CrossRef CAS.
- J. Deng, Q. Wei, M. Zhang, Y. Wang and Y. Li, Study of the effect of alcohol on single human red blood cells using near-infrared laser tweezers Raman spectroscopy, J. Raman Spectrosc., 2005, 36(3), 257–261 CrossRef CAS.
- J. Lukose, N. Mithun, M. Priyanka, G. Mohan, S. Shastry and S. Chidangil, Laser Raman tweezer spectroscopy to explore the bisphenol A-induced changes in human erythrocytes, RSC Adv., 2019, 9(28), 15933–15940 RSC.
- J. Lippert, L. Gorczyca and G. Meiklejohn, A laser Raman spectroscopic investigation of phospholipid and protein configurations in hemoglobin-free erythrocyte ghosts, Biochim. Biophys. Acta, Biomembr., 1975, 382(1), 51–57 CrossRef CAS.
- S. Goheen, L. Lis, O. Kucuk, M. Westerman and J. Kauffman, Compositional dependence of spectral features in the Raman spectra of erythrocyte membranes, J. Raman Spectrosc., 1993, 24(5), 275–279 CrossRef CAS.
- B. R. Wood, L. Hammer, L. Davis and D. McNaughton, Raman microspectroscopy and imaging provides insights into heme aggregation and denaturation within human erythrocytes, J. Biomed. Optic., 2005, 10(1), 014005 CrossRef PubMed.
- B. R. Wood, P. Caspers, G. J. Puppels, S. Pandiancherri and D. McNaughton, Resonance Raman spectroscopy of red blood cells using near-infrared laser excitation, Anal. Bioanal. Chem., 2007, 387(5), 1691–1703 Search PubMed.
- H. Wu, J. V. Volponi, A. E. Oliver, A. N. Parikh, B. A. Simmons and S. Singh, In vivo lipidomics using single-cell Raman spectroscopy, Proc. Natl. Acad. Sci. U.S.A., 2011, 108(9), 3809–3814 CrossRef CAS PubMed.
- S. Barkur, A. Bankapur, M. Pradhan, S. Chidangil, D. Mathur and U. Ladiwala, Probing differentiation in cancer cell lines by single-cell micro-Raman spectroscopy, J. Biomed. Optic., 2015, 20(8), 085001 CrossRef PubMed.
- Y. H. Ong, M. Lim and Q. Liu, Comparison of principal component analysis and biochemical component analysis in Raman spectroscopy for the discrimination of apoptosis and necrosis in K562 leukemia cells, Optic Express, 2012, 20(20), 22158–22171 CrossRef CAS.
- H. Yao, Z. Tao, M. Ai, L. Peng, G. Wang, B. He and Y.-q. Li, Raman spectroscopic analysis of apoptosis of single human gastric cancer cells, Vib. Spectrosc., 2009, 50(2), 193–197 CrossRef CAS.
- V. Vuiblet, T. T. Nguyen, A. Wynckel, M. Fere, L. Van-Gulick, V. Untereiner, P. Birembaut, P. Rieua and O. Piot, Contribution of Raman spectroscopy in nephrology: a candidate technique to detect hydroxyethyl starch of third generation in osmotic renal lesions, Analyst, 2015, 140, 7382–7390 RSC.
- C. Uzoigwe, The human erythrocyte has developed the biconcave disc shape to optimise the flow properties of the blood in the large vessels, Med. Hypotheses, 2006, 67(5), 1159–1163 CrossRef.
- N. Takeishi, H. Ito, M. Kaneko and S. Wada, Deformation of a red blood cell in a narrow rectangular microchannel, Micromachines, 2019, 10(3), 199 CrossRef PubMed.
Footnote |
| † Electronic supplementary information (ESI) available. See DOI: 10.1039/d0ra05842d |
| This journal is © The Royal Society of Chemistry 2020 |

