 Open Access Article
Highly stable folic acid functionalized copper-nanocluster/silica nanoparticles for selective targeting of cancer cells†
Xiaoming Fang‡
,
Yanhua Huang‡,
Dan Yu,
Caiwen Shi and
Ming Liu *
*
Department of Respiratory, Affiliated Hospital of Nanjing Medical University, Changzhou Second People's Hospital, Changzhou 213003, China. E-mail: 2306051553@qq.com
First published on 26th August 2020
Abstract
In this paper, we present a novel strategy to construct folic acid functionalized conjugated Cu nanoclusters (CuNCs) and silica (SiO2) nanocomposites for targeted detection of cancer cells. First of all, BSA capped CuNCs were encapsulated into a SiO2 matrix. The resulting CuNCs@SiO2 nanoparticles showed bright red fluorescence with an enhanced photoluminescence quantum yield compared with free CuNCs, as well as improved stability in a complex biological environment owning to the protection of the SiO2 matrix. Upon attachment of folic acid via the poly-L-lysine conjugates (PLL-FA) on the surface of CuNCs@SiO2 driven by electrostatic interaction, the as-prepared CuNCs@SiO2/PLL-FA nanocomposites are capable of selectively recognizing folate receptor (FR) over-expressed cancer cells rather than FR-negative cells. The cell viability assay proved the low biotoxicity of CuNCs@SiO2/PLL-FA nanocomposites toward living cells and the in vitro cellular imaging assay results demonstrated their selective endocytosis of FR-positive cells (KB cells), bringing about red fluorescence labeling within the cells. Intriguingly, our strategy provides a novel route to synthesize functional CuNCs@SiO2/PLL-FA nanocomposites equipped with superior fluorescence properties, high stability against external stimuli and good biocompatibility, and have great application potential in bioimaging imaging and targeted cell detection.
1 Introduction
Cancer is a global disease with high morbidity and mortality, bringing about ∼13% of total deaths all over the world.1–3 The specific recognition and accurate diagnosis of cancer cells at an early stage are of particular significance for the survival of patients with cancer and for a better prognosis.4 Cell surface glycoproteins have vital functions in cellular communication, in particular, cell and molecular biometrics.5 The abnormal expression of specific glycoproteins is the acknowledged marker for recognition of certain cancer cells.6 Folate receptor (FR) is a kind of over-expressed cell membrane glycoprotein in malignant cancer cells, like breast, lung, kidney, brain and so on.7 FR has a high binding affinity with folic acid (FA) to mediate cellular uptake of FA for rapid cell proliferation.8,9 Fluorescence imaging detection is one of the most extensive and powerful visualization techniques in biological research and clinical diagnostics, with selectivity, visibility and adjustability, which has been widely developed for detection of specific organs or tumors.10–12 Thus, conjugation of FA on fluorescent nanomaterials is a capable strategy to fabricate biomarker for selective targeting of cancer cells.13–15Recently, metal nanoclusters (NCs), consisting of several to tens of metal atoms (Au, Ag, Cu, etc.), have attracted extensive attention in bioimaging owing to their superior features including, facile synthesis, tunable emission wavelength, water dispersibility, excellent biocompatibility and low toxicity.16–18 In particular, Cu-based NCs have gained immense research interests for the merits of available raw materials and relatively low cost of copper.19,20 However, the CuNCs are typically coating with thiol-containing proteins or small molecules, which are usually susceptive to the external stimulus or the complex and varying biological environments, resulting in the aggregation/oxidation of the CuNCs corresponding to the fluorescence quenching. Besides, the easy surface oxidation of copper upon exposure to air is another issue for the chemically stable fluorescence CuNCs. Moreover, the limited functional groups of CuNCs could restrict their feasibility to construct the versatile biomarker for the specific targets in the bioimaging field. The above drawbacks may hinder the application of the CuNCs in the biolabeling and imaging, which are in urgent demand to address. Silica has been supposed as an ideal matrix to encapsulate fluorophores thanks to its chemical inertness and optical transmittance, which could protect the fluorophores from fluorescence quenching effects or degradation in the biological environment, meanwhile, maintain their intrinsic fluorescence property.21–23 Furthermore, silica is activated with various coupling agents for the silicon hydroxyl abundant surface, endowing them the ability of conjugation with targeting agents for flexible applications.24–26
In this work, we proposed a novel strategy to construct FA conjugated Cu nanoclusters (CuNCs) and silica (SiO2) nanocomposites for targeted fluorescence imaging of FR over-expressed cancer cells. The synthesized procedure is shown in Scheme 1, with the assistant of cationic polyelectrolyte, polydiallyldimethylammoniumchloride (PDDA), the CuNCs could be efficiently incorporated into the silica matrix. The resulting CuNCs@SiO2 nanoparticles maintain the red fluorescence of the initial CuNCs with the enhanced photoluminescence quantum yield. Thereafter, the conjugates of poly-L-lysine and folic acid (PLL-FA) were assembled on the surface of CuNCs@SiO2 through the electrostatic interaction to compose CuNCs@SiO2/PLL-FA nanocomposites. Given the fact that FA has high binding affinity for FA, the CuNCs@SiO2/PLL-FA have a potential prospect on the targeted detection of FR-positive cancer cell. The cell viability assay proved the low biotoxicity of CuNCs@SiO2/PLL-FA toward the living cells and the in vitro cellular imaging results further demonstrated the feasibility of CuNCs@SiO2/PLL-FA for the specific recognition of FR over-expressed cancer cells. As far as we have known, it's the first report of the CuNCs fluorophore based composed strategy for the specific detection of FR-positive cancer cells. Intriguingly, the designed CuNCs@SiO2/PLL-FA nanocomposites possess superior fluorescence property, good biocompatibility and high stability against the external stimuli, such as photo-excitation, acid/base, high temperature and high concentration of salt, endowing them the promising application in cellular imaging and detection of cancer cells.
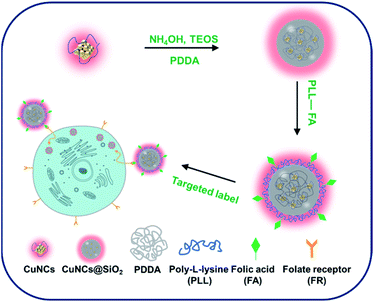 | ||
| Scheme 1 Schematic illustration for the fabrication of FA conjugated CuNCs@SiO2 nanocomposites for the specific cell recognition. | ||
2 Experimental
2.1 Material
Bovine serum albumin (BSA), polydiallyldimethylammoniumchloride (PDDA, Mw: 100![[thin space (1/6-em)]](https://www.rsc.org/images/entities/char_2009.gif) 000–200
000–200![[thin space (1/6-em)]](https://www.rsc.org/images/entities/char_2009.gif) 000 g mol−1, 20 wt% aqueous solution), N-hydroxysuccinimide (NHS), folic acid (FA), poly-L-lysine (PLL), 1-[3-(dimethylamino) propyl]-3-ethylcarbodiimide hydrochloride (EDC) were purchased from Sigma-Aldrich. Copper sulfate (CuSO4), hydrazine hydrate (N2H4·2H2O, 85 wt%) ethanol, ammonium hydroxide (∼25 wt%), and tetraethoxysilane (TEOS) were purchased from Beijing Chemical Reagent Company. All the reagents were used without further purification. High purity water with a conductivity of 18 MΩ cm−1 was used in all the experiments.
000 g mol−1, 20 wt% aqueous solution), N-hydroxysuccinimide (NHS), folic acid (FA), poly-L-lysine (PLL), 1-[3-(dimethylamino) propyl]-3-ethylcarbodiimide hydrochloride (EDC) were purchased from Sigma-Aldrich. Copper sulfate (CuSO4), hydrazine hydrate (N2H4·2H2O, 85 wt%) ethanol, ammonium hydroxide (∼25 wt%), and tetraethoxysilane (TEOS) were purchased from Beijing Chemical Reagent Company. All the reagents were used without further purification. High purity water with a conductivity of 18 MΩ cm−1 was used in all the experiments.
2.2 Characterization
Fluorescence spectra were recorded on a Shimadzu RF-5301PC fluorometer. Fluorescence decays were collected on a HORIBA DeltaFlex modular fluorescence lifetime system with an excitation pulse at 520 nm. The absolute photoluminescence quantum yield (PLQY) was obtained by a time-correlated single photon counting spectrometer in combination with a FLS980 Edinburgh fluorescence spectrometer. UV-vis spectra measurement was performed on a Shimadzu UV-1800 spectrophotometer. Transmission electron microscopy (TEM) images were obtained by a FEI-TECNAI G2 microscope operating at 200 kV. Dynamic light scattering and zeta-potential results were accessed on a Brookhaven ZetaPlus apparatus. The energy electron spectroscopy (EDS) pattern was recorded on the AMETEK SEM-associated EDAX GENSIS energy dispersive spectroscopy. Fourier transform infrared (FTIR) spectra were collected with a Nicolet is 50 FTIR spectrometer scanning over the frequency range of 4000 to 400 cm−1 The fluorescence images were obtained with a reflected fluorescence microscope system with a digital camera DP80 from Olympus. The absorbance for MTT assay was recorded by a Molecular Devices SpectraMax Reader.2.3 Preparation of CuNCs@SiO2 nanoparticles
BSA capped Cu nanoclusters (CuNCs) were synthesized in aqueous solution following a previous publication with modification.27 In brief, a fixed amount of CuSO4 solution (5 mL, 10 mM) and a certain amount of BSA solution (100 mg) was incubated at 40 °C under vigorous stirring for 10 minutes. Subsequently, a freshly prepared NaOH solution (1.0 M) was added to the mixture adjusting the pH to 12. Then, N2H4·2H2O (1 mL) was injected into the reaction mixture and stirring at room temperature for 4 h. The mixture turned to light brown indicating the formation of CuNCs. The resulting CuNCs were purified by dialysis against high water for 24 h with water change every 4 h to remove the redundant agents. To incorporate the CuNCs into the silica matrix, a type of cationic polyelectrolyte, PDDA, was introduced. In a typical procedure, PDDA aqueous solution (80 μL, 10 mg mL−1) and dispersion of the CuNCs (3 mL) were added into ethanol–water mixture with a volume ratio of 1![[thin space (1/6-em)]](https://www.rsc.org/images/entities/char_2009.gif) :
:![[thin space (1/6-em)]](https://www.rsc.org/images/entities/char_2009.gif) 40 under stirring and incubated for at least 30 min. The total volume of the stock solutions was 10 mL with the ethanol–water ratio of 1
40 under stirring and incubated for at least 30 min. The total volume of the stock solutions was 10 mL with the ethanol–water ratio of 1![[thin space (1/6-em)]](https://www.rsc.org/images/entities/char_2009.gif) :
:![[thin space (1/6-em)]](https://www.rsc.org/images/entities/char_2009.gif) 8. The Stöber system was formed by using 8.4 mL ethanol, 0.1 mL ammonium hydroxide, 815 mL water, and 3 mL TEOS, and then kept in a 30 °C water bath under stirring for 30 min of pre-hydrolyzation. Following, 0.45 mL stock solution of the PDDA and CuNCs mixture was added into the reaction solution and kept at 30 °C for 24 h to obtain the CuNCs doped silica nanoparticles.
8. The Stöber system was formed by using 8.4 mL ethanol, 0.1 mL ammonium hydroxide, 815 mL water, and 3 mL TEOS, and then kept in a 30 °C water bath under stirring for 30 min of pre-hydrolyzation. Following, 0.45 mL stock solution of the PDDA and CuNCs mixture was added into the reaction solution and kept at 30 °C for 24 h to obtain the CuNCs doped silica nanoparticles.
2.4 Preparation of CuNCs@SiO2/PLL-FA nanocomposites
First of all, FA and PLL were conjugated through the EDC/NHS reaction. EDC solution (100 μL, 20 mM) and NHS solution (100 μL, 20 mM) were added into 2.2 mL of FA solution (0.5 mM) under stirring for further incubation of 30 min. Then, PLL solution (2 mg mL−1, 400 μL) was injected into the mixture and stirred for 10 h at room temperature in the dark. The resulting product was dialyzed for 2 days to remove the redundant reagents and obtain the pure PLL-FA solution. After that, 1 mL PLL-FA solution was quickly added into 20 mL of the CuNCs@SiO2 nanoparticle dispersion and stirred for 30 min to achieve the assembly of CuNCs@SiO2/PLL-FA. The resulting particles were separated through centrifugation (8000 rpm, 20 min), decanting of supernatant, and re-dispersion in water.2.5 Cytotoxicity assay
The cytotoxicity effect of the CuNCs@SiO2/PLL-FA nanocomposites on the breast carcinoma (MCF-7) and human nasopharyngeal epidermal carcinoma (KB) cells was evaluated with the standard MTT assay. In detail, 1 × 10⁴ cells per well were seeded in 96-well culture plates and incubated at 37 °C for 12 h in 5% CO2. After that, 100 μL culture medium containing various concentrations (0–0.5 mg mL−1) of CuNCs@SiO2/PLL-FA were added to the wells. After the incubation for 24 h either kept in the dark or exposed to irradiation with a 430 nm light for 30 min, the nutrient solution was poured out and 100 μL fresh medium was added with 10 μL (5 mg mL−1) of MTT to each well and all the cells were continuously incubated for 24 h. After that, the supernatant was removed and 150 μL of dimethyl sulfoxide was added to release the formazan from lysed cells. Finally, the absorbance of the formed formazan at 570 nm in the treated cells and control cells were recorded on a SpectraMax Absorbance Reader.2.6 In vitro cellular imaging
The MCF-7 cells and KB cells were incubated in a 10% fetal bovine serum (FBS) containing DMEM (Dulbecco's modified eagle medium). For the cell imaging observation, 1 × 10⁴ cells per well of the two types of cells were seeded in a 12-well plate incubated in the medium at 37 °C for 12 h under 5% CO2. Then, the cells were washed with PBS three times, and further incubated in 1 mL DMEM containing 50 μg mL−1 of CuNCs@SiO2/PLL-FA nanocomposites. After incubated at 37 °C for 2 h, the medium was discarded and the cells were rinsed with PBS three times to remove the extra fluorescence probe. Then, the cell samples were ready for imaging requirements. The dish was observed for fluorescence images of the cells excited by the 1000 W mercury lamp with a filter BP485-525 and the emission was collected through a filter of BP595-640.3 Results and discussion
3.1 Synthesis and characterization of CuNCs@SiO2
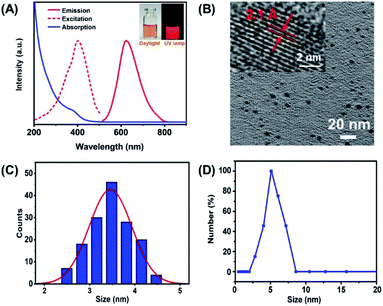
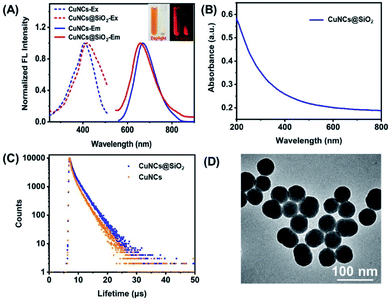
BSA capped Cu nanoclusters (CuNCs) were synthesized according to the previously reported method. The resulting CuNCs are light brown in color under daylight and emit bright red fluorescence under the 365 nm UV lamp shown by the images in Fig. 1A insert. UV-vis spectra in Fig. 1A displays the absorption shoulder band around 350–450 nm, in accord with the character position assigned to CuNCs moietied.28 The resulting CuNCs exhibit bright red fluorescence with the emission peak located at 670 nm (Fig. 1A). In particular, red fluorescence is more beneficial for eliminating the biological auto-fluorescence disturbance than the probes emitting fluorescence in the blue-green region. Moreover, the corresponding excitation spectrum has the peak located at 410 nm which is consistent with the UV-vis spectra. Fig. 1B presents the TEM image of the as-prepared CuNCs, appearing as spherical particles with good mono-dispersity. Moreover, the well-resolved lattice plane of approximately 0.21 nm spacing in the high-resolution TEM (HRTEM) image (inset in Fig. 1B) is assigned to the Cu (111) plane. The size distribution shows that the average diameter of the CuNCs is 3.6 ± 0.7 nm, calculated by measuring more than 100 particles (Fig. 1C). The dynamic light scattering (DLS) measurement reveals that the CuNCs have hydrodynamic diameter ca. 5.5 nm, confirming the small size of the CuNCs. The above results demonstrate the successful synthesis of fluorescence CuNCs (Fig. 1D).According to the zeta potential measurement, the CuNCs have a negatively charged surface with the value of −32 mV (Fig. S1†), which is adverse to the encapsulation for the electrostatic repulsion between the CuNCs and SiO2 matrix. Thanks to the assistance of cationic polyelectrolyte, PDDA, CuNCs could be efficiently incorporated into the SiO2 matrix due to the charge inversion induced by PDDA.29 Fig. 2A insert display the images of the CuNCs dispersion and CuNCs@SiO2 nanoparticles precipitate upon centrifugation. It is obvious that CuNCs is homo-dispersed in aqueous solution emitting red fluorescence under a 365 nm UV lamp. After the Stöber reaction, the white precipitate with red fluorescence could be observed on the bottom of tubes by configuration and the supernatant is colorless, indicating the complete encapsulation of CuNCs into SiO2 and the formation of CuNCs@SiO2. Fig. 2A demonstrated that the CuNCs@SiO2 nanoparticles maintain the profiles of fluorescence excitation/emission spectra with a slight shift and broadening comparing to the initial CuNCs, which is attributed to the light scattering effect of the SiO2 matrix. Correspondingly, the UV-vis spectrum of CuNCs@SiO2 shows no obvious absorption band originated from CuNCs except the strong scattering of SiO2 (Fig. 2B). To further explore the fluorescence property of CuNCs@SiO2, the fluorescence lifetime was measured. The fluorescence decay curve of CuNCs@SiO2 is fitted with a double exponential function with two components of 0.69 μs (26.62%) and 1.98 μs (73.38%), corresponding to an average lifetime of 1.83 μs. The average lifetime of CuNCs@SiO2 prolonged to 2.19 μs, fitted by two lifetimes of 0.56 μs (18.79%) and 2.29 μs (81.21%) (Fig. 2C). The prolonged lifetime is resulted from the change of the surrounding media derived from the encapsulation of SiO2 matrix.30,31 Under the observation of TEM, the CuNCs@SiO2 nanoparticles appeared as spherical with a good monodispersed average size of 52 ± 4 nm, corresponding to the hydrodynamic diameter of ca. 63 nm obtained from DLS measurement. Such a small size is profitable for the cellular bioimaging, which is generally required for <200 nm (Fig. 2D).32
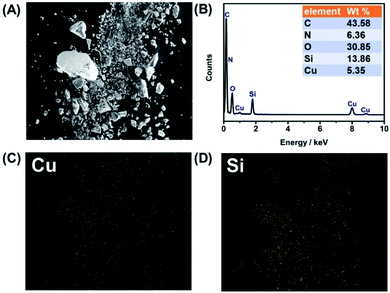
The energy dispersive X-ray spectroscopy (EDX) pattern and the primary elements mapping are performed in Fig. 3. The EDX pattern attests that the CuNCs@SiO2 nanoparticles contain the elements of Si, O, C, N, and Cu, with the semi-quantitatively determined weight ratio of 43.58%, 6.36%, 30.85%, 13.68% and 5.35%, respectively (Fig. 3B). Note that the C weight concentration listed in the table is not reliable since carbon-coated conducting resin is used for the EDX test. The elemental mappings of Cu and Si further clarify the presence of CuNCs doped into SiO2 (Fig. 3C and D).
3.2 Conjugation of folic acid to CuNCs@SiO2 nanoparticles
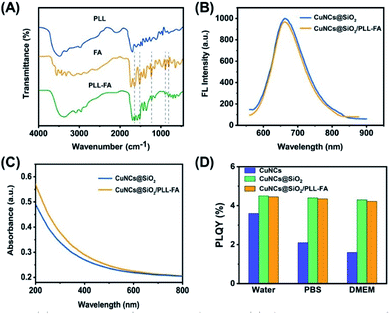
The specific cell recognition is the advanced purpose for the versatile application of CuNCs@SiO2 nanoparticles. For this aim, FA was modified on the surface of CuNCs@SiO2 nanoparticles via electrostatic interaction with a type of FA conjugate. First of all, FA was pre-bind with poly-L-lysine (PLL) through the typical EDC/NHS reaction to form the FA-PLL assembly.33 FTIR spectra of PLL-FA in Fig. 4A showed the characteristic peaks of FA at 1603 cm−1 and 1498 cm−1, assigned to the aromatic ring stretching of the pyridine and p-aminobenzoic acid moieties, respectively. Moreover, the indicative peaks of aromatic C–H bonds at 1342 cm−1, 855 cm−1 and 746 cm−1 are also observed in the FTIR spectrum of PLL-FA.34 These results sustain the successful conjugation of FA and PLL. During the preparation process, PLL, as a well-known biocompatible polymer, provided not only the reactive primary amines but also the positive charge for the attachment of negative charged SiO2. Exactly, the CuNCs@SiO2 have a negatively charged surface with the zeta potential of −42 mV due to the hydrolyzed silicon hydroxyl (Fig. S1†). Thus, PLL-FA assembly trends to absorb on the surface of CuNCs@SiO2 by virtue of the attractive interaction. The zeta potential became +18 mV after the incubation with PLL-FA, indicating the successful preparation of CuNCs@SiO2/PLL-FA nanocomposites (Fig. S1†). Moreover, the hydrodynamic diameter of CuNCs@SiO2 increased to ca.68 nm after incubated with PLL-FA comparing with the original CuNCs@SiO2 of 63 nm, suggesting that the PLL-FA was assembled on the surface of CuNCs@SiO2. The number of FA conjugated on each CuNCs@SiO2/PLL-FA is calculated ca. 4095 (Fig. S3†). The optical property of the CuNCs@SiO2/PLL-FA nanocomposites was further explored. It is gratifying that the modification of PLL-FA has no obvious influence on the emission/absorption of CuNCs@SiO2 shown in Fig. 4B and C. Furthermore, the stability of nanoparticles in the biological environment is essential for their applications in biological systems, which was explored in the following experiments. PBS and DMEM are widely used cell culture media containing a variety of ions and biomolecules. However, the free CuNCs are sensitive to the complex component of PBS/DMEM leading to the fluorescence quenching effect, as a result, the absolute PLQY decreased from 3.6% to 2.1% in PBS and 1.6% in DMEM as presented by the histogram in Fig. 4D. After incorporated into SiO2, PLQY of CuNCs@SiO2 elevated to 4.5% ascribed to the isolation of matrix, meanwhile, the emission revealed the promoted stability against the media interference, namely PLQY of 4.4% in PBS and 4.3% in DMEM (Fig. 4D). The high stability is also applied to CuNCs@SiO2/PLL-FA nanocomposites, indicating their beneficial feature for bioimaging applications.3.3 Stability investigation on CuNCs@SiO2/PLL-FA nanocomposites
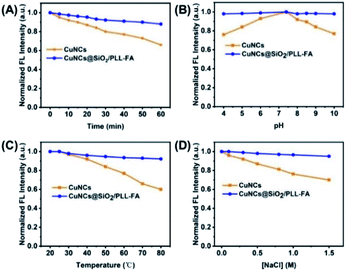
The physical/chemical stability of the fluorescence probes is the critical criterion for bioimaging applications. Upon the encapsulation of SiO2, the CuNCs presented the improved fluorescence stability against the external stimuli. The CuNCs@SiO2/PLL-FA nanocomposites performed enhanced anti-photobleaching capability for the fluorescence intensity decrease <10% after 60 min continuous photo-irradiation, in contrast, the emission intensity of CuNCs degraded more than 30% under the same condition (Fig. 5A). Furthermore, the biomolecule ligand capped CuNCs are always sensitive to the pH value, resulting in the fluorescence intensity decrease under the acid/base surrounding. Fig. 5B shows that the CuNCs@SiO2/PLL-FA nanocomposites exhibited a slight emission intensity decrease of <5% in high acid (pH = 4)/base (pH = 10) condition owning to the inertness of SiO2 matrix, comparing to the intensity reduction of >20% of the free CuNCs. In addition, the high temperature induced structure change of CuNCs is unfavorable for the fluorescence stability that the emission intensity of which definitely deduced >40% at 80 °C, in comparison to the slight intensity change of <10% for CuNCs@SiO2/PLL-FA nanocomposites (Fig. 5C). Taking into consideration of the physiological environment, the anti-salt ability of the prepared CuNCs@SiO2/PLL-FA nanocomposites was then explored in Fig. 5D. The emission intensity revealed an unobvious decrease of CuNCs@SiO2/PLL-FA nanocomposites, while that of the free CuNCs was significantly affected by the addition of high concentration of salt resulting in more than 20% fluorescence decrease in the surrounding of 1.5 M NaCl. Furthermore, the zeta potential measurement and the release study of conjugated FA in Fig. S2† testify the high stability of CuNCs@SiO2/PLL-FA nanocomposites.3.4 In vitro cellular uptake study and cytotoxicity assay
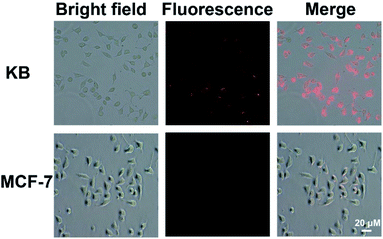
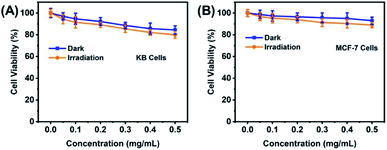
Note that the CuNCs@SiO2/PLL-FA nanocomposites possess bight fluorescence and superior stability, extremely facilitating their cellular imaging, the prepared CuNCs@SiO2/PLL-FA nanocomposites were investigated for specific targeting of cells through the vitro cell uptake experiment. KB cells, exposing an FR-positive surface due to the over-expression of FR, were chosen as the model cells.35,36 The FR-negative MCF-7 cells were chosen as the control.37 From the images in Fig. 6, bright red fluorescence could be observed from KB cells after incubated with CuNCs@SiO2/PLL-FA nanocomposites for 2 h, confirming the efficient cell uptake of CuNCs@SiO2/PLL-FA. Conversely, there is a weak red fluorescence signal from the image of MCF-7 cells after the same incubation time indicating the low internalization of CuNCs@SiO2/PLL-FA nanocomposites. Referring to the above results, the CuNCs@SiO2/PLL-FA nanocomposites are inclined to accumulate in the FR-positive KB cells attributed to the FR-mediated endocytosis via the high affinity between FA and FR, which is available for the specific detection of cancer cells. In contrast, the KB cells and MCF-7 cells expressed weak fluorescence signal after incubated with the CuNCs@SiO2/PLL over the long incubation time for 12 hours (Fig. S4†), which indicating that the non-specific endocytosis process has no obvious effect on the selectivity of CuNCs@SiO2/PLL-FA nanocomposites on FA-positive cells.Additionally, the biocompatibility of the CuNCs@SiO2/PLL-FA nanocomposites was evaluated by the standard MTT assay. In these experiments, KB and MCF-7 cells were incubated with different concentrations of CuNCs@SiO2/PLL-FA for 24 h, followed by either keeping in the dark or exposing to irradiation with a 430 nm light for 30 min. The viability of KB cells kept more than 80% either in the dark or under light irradiation with the concentration of CuNCs@SiO2/PLL-FA nanocomposites as high as 500 μg mL−1, which is 10-fold by the injected concentration in imaging assay, testifying the low cytotoxicity feature of CuNCs@SiO2/PLL-FA (Fig. 7A). Moreover, the CuNCs@SiO2/PLL-FA nanocomposites exhibited almost non-toxic towards MCF-7 cells over the concentration range of 50–500 μg mL−1 in the dark or under irradiation (Fig. 7B), presuming the less cytotoxicity to the non-targeted cells. Such good biocompatibility as well as the prominent stability endowed the CuNCs@SiO2/PLL-FA nanocomposites to be the ideal fluorescence probe for bioimaging and cell detection.
4 Conclusions
In summary, we presented a novel strategy to fabricate the folic acid conjugated nanocomposite based on Cu nanoclusters and silica for selective detection of cancer cells. With the assistant of cationic polyelectrolyte, the CuNCs could be efficiently incorporated into the silica matrix. Thereafter, the PLL-FA conjugates were assembled on the surface of CuNCs@SiO2 through the electrostatic interaction to construct CuNCs@SiO2/PLL-FA nanocomposites for selective recognition of cancer cells. The cell viability assay proved the excellent biocompatibility of CuNCs@SiO2/PLL-FA and the in vitro cellular imaging results further demonstrated its feasibility for the specific recognition of FR over-expressed cancer cells (KB cells). The designed CuNCs@SiO2/PLL-FA nanocomposites possess superior fluorescence property, good biocompatibility and high stability against the external stimuli, such as photo-excitation, acid/base, high temperature and high concentration of salt, ensuring their potential application for cellular imaging and specific detection of cancer cells.Conflicts of interest
All authors declare that there is no conflict of interest.Acknowledgements
This research is financially supported by Six Talent Peaks Project in Jiangsu Province (Grant No. WSN092) and 333 High Level Talents Project in Jiangsu Province (Grant No. BRA2016119).References
- M. R. Improgo, L. G. Soll, A. R. Tapper and P. D. Gardner, Front. Physiol., 2013, 4, 251 CrossRef PubMed
.
- A. Jemal, R. Siegel, E. Ward, T. Murray, J. Xu and M. J. Thun, Ca-Cancer J. Clin., 2007, 57, 43–66 CrossRef PubMed
.
- J. Mulshine and D. Sullivan, N. Engl. J. Med., 2005, 352, 2714–2720 CrossRef CAS PubMed
.
- S. B. Mondal, S. Gao, N. Zhu, L. Habimana Griffin, W. J. Akers, R. Liang, V. Gruev, J. Margenthaler and S. Achilefu, Ann. Surg Oncol., 2017, 24, 1897–1903 CrossRef PubMed
.
- R. Raman, S. Raguram, G. Venkataraman, J. C. Paulson and R. Sasisekharan, Nat. Methods, 2005, 2, 817–824 CrossRef CAS PubMed
.
- S. Iwakiri, M. Sonobe, S. Nagai, T. Hirata, H. Wada and R. Miyahara, Ann. Surg Oncol., 2008, 15, 889–899 CrossRef PubMed
.
- C. Chen, J. Ke, X. E. Zhou, W. Yi, J. S. Brunzelle, J. Li, E. L. Yong, H. E. Xu and K. Melcher, Nature, 2013, 500, 486–489 CrossRef CAS PubMed
.
- H. Shen, L. Wang, W. Chen, K. Menard, Y. Hong, Y. Tian, S. J. Bonacorsi, W. G. Humphreys, F. Y. Lee and J. Gan, Acta Pharm. Sin. B, 2016, 6, 460–467 CrossRef PubMed
.
- J. Shen, A. R. Hilgenbrink, W. Xia, Y. Feng, D. S. Dimitrov, M. B. Lockwood, R. J. Amato and P. S. Low, J. Leukocyte Biol., 2014, 96, 563–570 CrossRef PubMed
.
- L. Wang, M. S. Frei, A. Salim and K. Johnsson, J. Am. Chem. Soc., 2019, 141, 2770–2781 CrossRef CAS PubMed
.
- N. Nishio, N. S. van den Berg, S. van Keulen, B. A. Martin, S. Fakurnejad, Q. Zhou, G. Lu, S. U. Chirita, M. J. Kaplan, V. Divi, A. D. Colevas and E. L. Rosenthal, Mol. Imag. Biol., 2020, 22, 156–164 CrossRef CAS PubMed
.
- J. Du, N. Xu, J. Fan, W. Sun and X. Peng, Small, 2019, 15, 1805087 CrossRef PubMed
.
- P. Sun, J. Hai, S. Sun, S. Lu, S. Liu, H. Liu, F. Chen and B. Wang, Nanoscale, 2020, 12, 825–831 RSC
.
- F. Du, X. Zhao, W. Lu, Z. Guo, S. Shuang and C. Dong, Analyst, 2019, 144, 6729–6735 RSC
.
- T. Li, N. Li, Y. Ma, Y. J. Bai, C. M. Xing and Y. K. Gong, J. Mater. Chem. B, 2019, 7, 6087–6098 RSC
.
- X. Kang and M. Zhu, Chem. Soc. Rev., 2019, 48, 2422–2457 RSC
.
- M. J. Alhilaly, R. W. Huang, R. Naphade, B. Alamer, M. N. Hedhili, A. H. Emwas, P. Maity, J. Yin, A. Shkurenko, O. F. Mohammed, M. Eddaoudi and O. M. Bakr, J. Am. Chem. Soc., 2019, 141, 9585–9592 CrossRef CAS PubMed
.
- X. Kang and M. Zhu, Chem. Soc. Rev., 2019, 48, 2422–2457 RSC
.
- Q. Cao, J. Li and E. Wang, Biosens. Bioelectron., 2019, 132, 333–342 CrossRef CAS PubMed
.
- X. Liu, D. Vonk, H. Jiang, K. Kisslinger, X. Tong, M. Ge, E. Nazaretski, B. Ravel, K. Foster, S. Petrash and Y. C. K. Chen Wiegart, ACS Appl. Mater. Interfaces, 2019, 2, 1920–1929 CrossRef CAS
.
- H. Chen, G. D. Wang, X. Sun, T. Todd, F. Zhang, J. Xie and B. Shen, Adv. Funct. Mater., 2016, 26, 3973–3982 CrossRef CAS
.
- M. Li, Y. H. Lao, R. L. Mintz, Z. Chen, D. Shao, H. Hu, H.-X. Wang, Y. Tao and K. W. Leong, Nanoscale, 2019, 11, 2631–2636 RSC
.
- P. Li, L. Liu, Q. Lu, S. Yang, L. Yang, Y. Cheng, Y. Wang, S. Wang, Y. Song, F. Tan and N. Li, ACS Appl. Mater. Interfaces, 2019, 11, 5771–5781 CrossRef CAS PubMed
.
- H. Tan, G. Gong, S. Xie, Y. Song, C. Zhang, N. Li, D. Zhang, L. Xu, J. Xu and J. Zheng, Langmuir, 2019, 35, 11503–11511 CrossRef CAS PubMed
.
- M. Manzano and M. Vallet Regí, Chem. Commun., 2019, 55, 2731–2740 RSC
.
- R. V. Manurung, C. T. Wu, P. K. Roy and S. Chattopadhyay, RSC Adv., 2016, 6, 87088–87095 RSC
.
- C. Wang, C. Wang, L. Xu, H. Cheng, Q. Lin and C. Zhang, Nanoscale, 2014, 6, 1775–1781 RSC
.
- Y. J. Lin, P. C. Chen, Z. Yuan, J. Y. Ma and H. T. Chang, Chem. Commun., 2015, 51, 11983–11986 RSC
.
- L. Su, T. Shu, Z. W. Wang, J. Y. Cheng, F. Xue, C. Z. Li and X. J. Zhang, Biosens. Bioelectron., 2013, 44, 16–20 CrossRef CAS PubMed
.
- M. Montalti, L. Prodi, E. Rampazzo and N. Zaccheroni, Chem. Soc. Rev., 2014, 43, 4243–4268 RSC
.
- S. Valetti, J. Wankar, M. B. Ericson, A. Feiler and I. Manet, J. Mater. Chem. B, 2017, 5, 3201–3211 RSC
.
- I. Canton and G. Battaglia, Chem. Soc. Rev., 2012, 41, 2718–2739 RSC
.
- F. Tang, C. Wang, X. Wang and L. Li, ACS Appl. Mater. Interfaces, 2015, 7, 25077–25083 CrossRef CAS PubMed
.
- X. Wang, J. Xia, C. Wang, L. Liu, S. Zhu, W. Feng and L. Li, ACS Appl. Mater. Interfaces, 2017, 9, 44856–44863 CrossRef CAS PubMed
.
- V. Dixit, J. van den Bossche, D. M. Sherman, D. H. Thompson and R. P. Andres, Bioconjugate Chem., 2006, 17, 603–609 CrossRef CAS PubMed
.
- L. Xu, G. Jiang, H. Chen, Y. Zan, S. Hong, T. Zhang, Y. Zhang and R. Pei, Talanta, 2019, 194, 643–648 CrossRef CAS PubMed
.
- S. Trabulo, A. M. Cardoso, T. Santos-Ferreira, A. L. Cardoso, S. Simoes and M. C. Pedroso de Lima, Mol. Pharm., 2011, 8, 1120–1131 CrossRef CAS PubMed
.
Footnotes |
| † Electronic supplementary information (ESI) available. See DOI: 10.1039/d0ra06523d |
| ‡ These authors contributed equally to this work. |
| This journal is © The Royal Society of Chemistry 2020 |

