 Open Access Article
Selective hydrogenation of nitroaromatics to N-arylhydroxylamines in a micropacked bed reactor with passivated catalyst†
Feng Xua,
Jian-Li Chena,
Zhi-Jiang Jiang c,
Peng-Fei Chenga,
Zhi-Qun Yu
 *a and
Wei-Ke Su
 *ab
*ab
aNational Engineering Research Center for Process Development of Active Pharmaceutical Ingredients, Collaborative Innovation Center of Yangtze River Delta Region Green Pharmaceuticals, Zhejiang University of Technology, Hangzhou 310014, People's Republic of China. E-mail: yzq@zjut.edu.cn; pharmlab@zjut.edu.cn
bKey Laboratory for Green Pharmaceutical Technologies and Related Equipment of Ministry of Education, College of Pharmaceutical Sciences, Zhejiang University of Technology, Hangzhou 310014, People's Republic of China
cSchool of Biological and Chemical Engineering, Ningbo Tech University, Ningbo, 315100, People's Republic of China
First published on 3rd August 2020
Abstract
In this contribution, a protocol was established for the selective catalytic hydrogenation of nitroarenes to the corresponding N-arylhydroxylamines. The reduction of 1-(4-chlorophenyl)-3-((2-nitrobenzyl)oxy)-1H-pyrazole, an intermediate in the synthesis of the antifungal reagent pyraclostrobin that includes carbon–chlorine bonds, benzyl groups, carbon–carbon double bonds and other structures that are easily reduced, was chosen as the model reaction for catalyst evaluation and condition optimization. Extensive passivant evaluation showed that RANEY®-nickel treated with ammonia/DMSO (1![[thin space (1/6-em)]](https://www.rsc.org/images/entities/char_2009.gif) :
:![[thin space (1/6-em)]](https://www.rsc.org/images/entities/char_2009.gif) 10, v/v) afforded the optimal result, especially with a particle size of 400–500 mesh. To combine the modified catalyst with continuous-flow reaction technology, the reaction was conducted at room temperature, rendering the desired product with a conversion rate of 99.4% and a selectivity of 99.8%. The regeneration of catalytic activity was also studied, and an in-column strategy was developed by pumping the passivate liquid overnight. Finally, the generality of the method was explored, and 7 substrates were developed, most of which showed a good conversion rate and selectivity, indicating that the method has a certain degree of generality.
10, v/v) afforded the optimal result, especially with a particle size of 400–500 mesh. To combine the modified catalyst with continuous-flow reaction technology, the reaction was conducted at room temperature, rendering the desired product with a conversion rate of 99.4% and a selectivity of 99.8%. The regeneration of catalytic activity was also studied, and an in-column strategy was developed by pumping the passivate liquid overnight. Finally, the generality of the method was explored, and 7 substrates were developed, most of which showed a good conversion rate and selectivity, indicating that the method has a certain degree of generality.
Introduction
Selective catalytic hydrogenation of nitroarenes is one of the most promising methods for producing N-arylhydroxylamines, and it is frequently used in pharmaceuticals, agrochemicals, and materials.1 Excellent results have been achieved during the past few decades by utilizing finely optimized conditions,2 including catalytic hydrogenation3 (with Pt/C/DMSO/H2,3a RANEY®-Ni/NH4VO3/H2,3b Pt/SiO2/DMSO/nBuNH2/H2,3c Pd/SIO-2H2,3d RuCNT/N2H4·H2O3e) and electro-reduction.4 However, these processes are not necessarily environmentally benign, cost-efficient, and complex post-processing (due to the use of additives) and severe side reactions still bother the field due to the lability of the hydroxylamine group.Mechanistically, the reduction of nitroarenes can be divided into three steps: (a) nitro-reduction, (b) nitrone-reduction, and (c) hydroxylamine-reduction (Scheme 1). Unfortunately, condensation can occur between the nitrone and hydroxylamine intermediates, affording unexpected azoxy and azo side products (Scheme 1).3b Furthermore, the reduction of hydroxylamine can be achieved via similar conditions, which leads to over-reduction becoming a prevailing side reaction. Thus, removing in situ generated N-arylhydroxylamines promptly from the complex environment may further enhance the performance.
During the past few decades, continuous-flow reactors have attracted considerable attention from both academic and industrial communities.5 The advantages of continuous-flow reactors in terms of mass and heat transfer accompanied with low back-mixing have shown a unique advantage in process enhancement, where excellent examples can be found in the form of nitration and diazotization.6 The technique has also unveiled promising application in the field of catalytic hydrogenation,7 especially combined with heterogeneous catalysis.8 Recently, Jensen and co-workers reported a catalytic hydrogenation of nitroarenes employing a micropacked bed reactor (mPBR).9 Although the formation of N-arylhydroxylamines was not discussed in this case, this excellent result aroused our interest to cut down sequential hydrogenation at the middle point of the reaction, affording hydroxylamine selectively.
Fortunately, a similar strategy has been successfully proved by pumping the substrate through a packed-bed of zinc powder.10 Encouraged by this result, we commenced our exploration of selective hydrogenation under continuous-flow conditions using RANEY®-nickel as a catalyst. Our initial strategy speeded up feeding-rate imaging, indicating that the desired N-arylhydroxylamine could be flushed out before the over-reduction. However, no selectivity was observed even when the conversion rate dropped to 20%. Thus, our focus turned to manipulate the activity of N-arylhydroxylamine and inhibit the excessive reduction of hydroxylamine by combining the modified catalyst with continuous-flow. For concern of additive residue accumulation, a stable catalyst may be more suitable for a continuous-flow reaction rather than adding passivants into a feeding solution. Herein, we unveil a convenient protocol for selectively catalytic hydrogenation to N-arylhydroxylamines using the continuous-flow technique with a recyclable mPBR. The strategy described in this paper is low cost, environmentally friendly, and the reaction proceeds directly to the next step without post-treatment.
Result and discussion
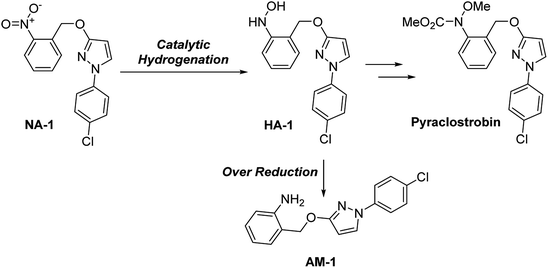
Our group has made continuous efforts into the industrial application of the continuous-flow technique6c,6d,11 Among others, the selective reduction of 1-(4-chlorophenyl)-3-((2-nitrobenzyl)oxy)-1H-pyrazole (NA-1), a key intermediate of the antifungal reagent pyraclostrobin, is a great challenge due to the sensitive substituents of the benzyl and chloride groups (Scheme 2).Catalysts evaluation
The initial evaluation of the catalyst performance was conducted in an autoclave. The data obtained for the normal RANEY®-Ni showed no selectivity toward the desire product N-(2-((1-(4-chlorophenyl)-1H-pyrazol-3-yl)oxy)phenyl)hydroxylamine (HA-1) for 6 h of HPLC tracking, and only 2-(((1-(4-chlorophenyl)-1H-pyrazol-3-yl)oxy)methyl)aniline (AM-1) was obtained (Table 1, entry 1). Then, the catalyst was treated with various passivants, and their performance is summarized in Table 1. Firstly, DMSO-treated catalyst was tested, which showed a promising selectivity toward hydroxylamine (Table 1, entry 3). However, the low conversion can hardly satisfy the kinetic requirement for the continuous-flow reactor. A similar result was observed by using diphenyl sulfide as passivant (Table 1, entry 5). When amine was employed as passivant, the reaction proceeded with a high conversion and extremely poor selectivity (Table 1, entries 6–7). It is noteworthy that a rapid accumulation of N-arylhydroxylamine was observed in the first 2 min of the reaction using an ammonia-treated catalyst. However, the immediate quenching failed to afford any satisfying result due to the rapid hydroxylamine-reduction. To balance the selectivity and conversion, a mixture of DMSO and aqueous ammonia was employed as passivant. Fortunately, this strategy showed a promising result (Table 1, entry 9). Subsequent optimization showed that ammonia/DMSO (1![[thin space (1/6-em)]](https://www.rsc.org/images/entities/char_2009.gif) :
:![[thin space (1/6-em)]](https://www.rsc.org/images/entities/char_2009.gif) 10, v/v) can afford the optimal condition, affording the product with a conversion of over 95.6% and a selectivity near 93.7% (Table 1, entry 11). The data showed that short reaction time results in low reaction conversion rate and better reaction selectivity. As the reaction time increased, the reaction conversion rate increased, but the reaction selectivity gradually decreased.
10, v/v) can afford the optimal condition, affording the product with a conversion of over 95.6% and a selectivity near 93.7% (Table 1, entry 11). The data showed that short reaction time results in low reaction conversion rate and better reaction selectivity. As the reaction time increased, the reaction conversion rate increased, but the reaction selectivity gradually decreased.
| No. | Passivantb | Time/h | HA-1 (%) | AM-1 (%) | Conv. (%) | Select. (%) |
|---|---|---|---|---|---|---|
| a Reaction conditions unless noted otherwise: NA-1 (7.55 mmol, 2.50 g) and passivated catalyst (0.125 g) (400–500 mesh) were dispersed in THF (20 mL) within an autoclave, which was then reacted at −7 °C under H2 atmosphere (0.6 MPa). The conversion and selectivity were determined by HPLC analysis.b The ratio of binary passivant was based on volume. | ||||||
| 1 | None | 6 | 0.0 | 100.0 | ≥99.9 | 0.0 |
| 2 | DMSO | 6 | 2.8 | 0.3 | 3.1 | 90.1 |
| 3 | DMSO | 16 | 5.8 | 1.6 | 7.4 | 78.2 |
| 4 | Ph2S | 6 | 1.9 | 0.1 | 2.0 | 94.3 |
| 5 | Ph2S | 16 | 4.4 | 0.6 | 5.0 | 87.9 |
| 6 | NH3 | 6 | 4.8 | 95.2 | ≥99.9 | 4.8 |
| 7 | NH2CH2CH2NH2 | 6 | 29.4 | 70.6 | ≥99.9 | 29.4 |
| 8 | NH3/DMSO = 1![[thin space (1/6-em)]](https://www.rsc.org/images/entities/char_2009.gif) : :![[thin space (1/6-em)]](https://www.rsc.org/images/entities/char_2009.gif) 5 5 |
6 | 31.6 | 3.0 | 34.6 | 91.4 |
| 9 | NH3/DMSO = 1![[thin space (1/6-em)]](https://www.rsc.org/images/entities/char_2009.gif) : :![[thin space (1/6-em)]](https://www.rsc.org/images/entities/char_2009.gif) 5 5 |
27 | 76.3 | 10.8 | 87.1 | 87.6 |
| 10 | NH3/DMSO = 1![[thin space (1/6-em)]](https://www.rsc.org/images/entities/char_2009.gif) : :![[thin space (1/6-em)]](https://www.rsc.org/images/entities/char_2009.gif) 10 10 |
6 | 28.4 | 0.2 | 28.6 | 99.2 |
| 11 | NH3/DMSO = 1![[thin space (1/6-em)]](https://www.rsc.org/images/entities/b_char_2009.gif) : :![[thin space (1/6-em)]](https://www.rsc.org/images/entities/b_char_2009.gif) 10 10 |
32 | 89.2 | 6.0 | 95.6 | 93.7 |
| 12 | NH3/DMSO = 1![[thin space (1/6-em)]](https://www.rsc.org/images/entities/char_2009.gif) : :![[thin space (1/6-em)]](https://www.rsc.org/images/entities/char_2009.gif) 15 15 |
6 | 25.6 | 0.2 | 25.8 | 99.4 |
| 13 | NH3/DMSO = 1![[thin space (1/6-em)]](https://www.rsc.org/images/entities/char_2009.gif) : :![[thin space (1/6-em)]](https://www.rsc.org/images/entities/char_2009.gif) 15 15 |
35 | 91.5 | 8.2 | 99.7 | 91.7 |
The particle size of RANEY®-Ni was also examined due to the potential influence of the surface area. In contrast to our initial hypothesis that a lower surface may afford better control, the comparison between different sized catalysts showed that a higher surface area afforded better results (Table 2, entries 1–3) due to better passivation effects. DA400 of 400–500 mesh rendered the best selectivity of 99.5% and a conversion of 65.9% after 20 h of reaction (Table 2, entry 3). It is noteworthy that the reused catalyst (DA400r) still gave a good selectivity of 97.6% (Table 2, entry 4), which indicated the possibility of catalyst recycling. This interesting deviation from expectations aroused our interest to elucidate the phenomenon, and the catalysts were then rendered for characterization.
| No. | Mesh | Name | HA-1 (%) | AM-1 (%) | Conv. (%) | Select. (%) |
|---|---|---|---|---|---|---|
| a Reaction conditions unless noted otherwise: NA-1 (7.55 mmol, 2.50 g) and passivated catalyst (0.125 g) were dispersed in THF (20 mL) within an autoclave, which was then reacted at −7 °C under H2 atmosphere (0.6 MPa). The conversion and selectivity were determined by HPLC analysis. | ||||||
| 1 | 80–120 | DA80 | 17.5 | 4.0 | 21.5 | 81.2 |
| 2 | 200–300 | DA200 | 33.0 | 0.3 | 33.3 | 99.0 |
| 3 | 400–500 | DA400 | 65.6 | 0.3 | 65.9 | 99.5 |
| 4 | 400–500 | DA400r | 41.4 | 1.0 | 42.6 | 97.6 |
Catalyst characterization
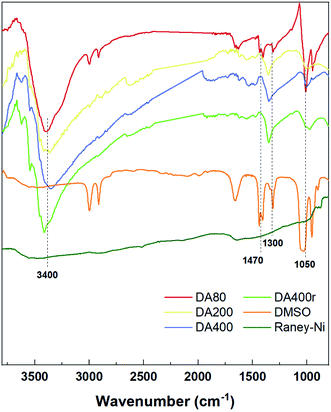
Previously, ammonia and DMSO have been used in manipulating catalyst activity by ligation.3a,3c,3d Thus, our work began with identifying the presence of such compounds. Therefore, FT-IR was first employed to find the signals (Fig. 1). Compared with the original RANEY®-Ni, three additional bands were observed in catalysts treated with DMSO and aqueous ammonia. The bands in the wavenumber range 3300–3500 cm−1 represent the N–H bond stretching vibration, suggesting the presence of NH3. Meanwhile, the vibration in the range 1300–1470 cm−1 was assigned to the methyl group of DMSO. Moreover, a slight shift in the bands of around 1000 cm−1 was found, which indicated a coordination of both S and O to the metal center. DA400r also showed a similar pattern, indicating attachment of the passivant to the metal center.Although the tests above prove the presence of DMSO and NH3 in the catalysts, the difference between the three catalysts was not yet drawn. Thus, an elementary analysis was conducted to determine the heteroatom density in the catalysts, and DA400 was found to possess the highest nitrogen and sulfur ratio (0.46% N and 2.77% S, see ESI† for details). Furthermore, energy-dispersive X-ray spectroscopy (EDS) suggested that these elements were distributed evenly through DA400 (Fig. S3†), while the corresponding signals acquired from the other two samples were much weaker. The recovered DA400r was also tested and showed an increased nitrogen density, which may be due to product absorption.
Finally, the catalyst morphology and surface property was compared (Fig. 2). Scanning electron microscopy (SEM) analysis showed that DA200 and DA400 possessed a fine needle-like surface, but DA80 only afforded a hollow surface. Transmission electron microscopy (TEM) also indicated that the surface of DA400 was much larger than the other catalysts, which was confirmed by subsequent Specific surface area (BET) analysis (see ESI† for details).
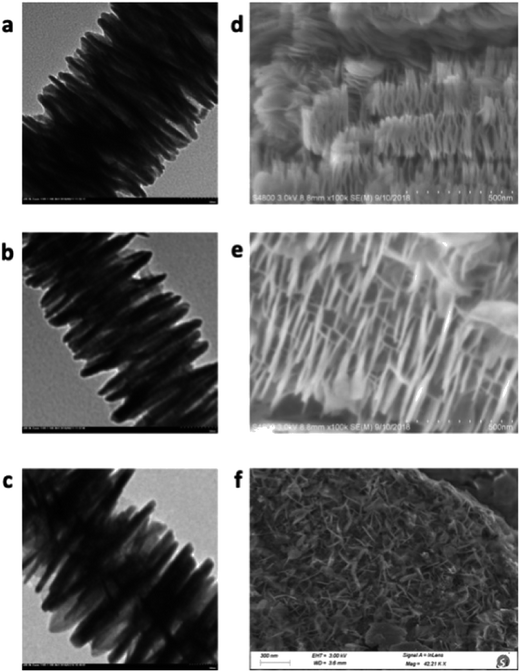 | ||
| Fig. 2 SEM and TEM spectra for different catalysts: TEM for DA80 (a), DA200 (b), DA400 (c); SEM for DA80 (d), DA200 (e), DA400 (f). | ||
Reaction process evaluation
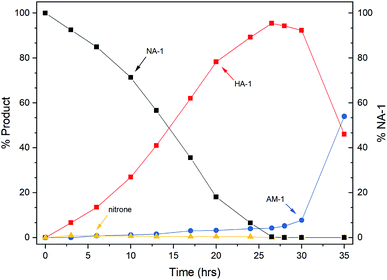
After catalyst characterization and preliminary optimization in the autoclave (see ESI† for more details), the reaction catalyzed by DA400 was tracked by HPLC to understand its progress.As shown in Fig. 3, the transformation underwent a clear two-stage process. The desired N-arylhydroxylamine was generated smoothly during the first 24 h, which was followed by a rapid accumulation of amine in the second stage after the complete consumption of the nitroarene. The intermediate nitrone was found to remain at a low level (<1%) during the reaction period, whereas its down-stream byproducts, azoxy and azo, were absent from the reaction. Mechanistically, these phenomena indicated that the three-step reduction was well controlled by the passivated catalyst, in which the first and the second steps were facilitated by ammonia.3c In addition, the undesired third reduction was inhibited by DMSO, which has been previously observed in batch reactors.3a,3c The selectivity loss at the end of the first-stage may be accounted for by the competitive ligation due to elevated hydroxylamine concentration. Thus, this interesting kinetic feature may be of further benefit in the continuous-flow reactor.
Continuous-flow reaction optimization
Since the process analysis revealed a promising profile for a continuous-flow reactor, the reaction was then repeated in a mPBR. Unfortunately, the first attempt at 0 °C only afforded a moderate selectivity of 75.0% (Table 3, entry 1), which made us doubt the strategy. Despite the concern for selectivity erosion, the situation was improved by elevating the temperature. Both selectivity and conversion were improved dramatically (Table 3, entries 2–4), and an acceptable result was found at 25 °C (Table 3, entry 4). The inflection-point occurred at approximately 30 °C, where the selectivity erosion was observed afterward (Table 3, entries 5–6).| No. | Solvent | Temp.(°C) | HA-1 (%) | AM-1 (%) | Select. (%) | Conv. (%) |
|---|---|---|---|---|---|---|
| a Reaction conditions: NA-1 (c = 80 g L−1) in solvent was added through the mPBR at a specific temperature and constant rate of 0.1 mL min−1. The H2 gas was pressurized with a back pressure of 30 psi. The conversion and selectivity were determined by HPLC analysis. | ||||||
| 1 | THF | 0 | 37.1 | 12.0 | 75.6 | 49.1 |
| 2 | THF | 15 | 58.8 | 3.4 | 94.5 | 62.2 |
| 3 | THF | 20 | 84.2 | 4.7 | 94.7 | 88.9 |
| 4 | THF | 25 | 92.5 | 2.1 | 97.8 | 94.6 |
| 5 | THF | 30 | 94.6 | 3.7 | 96.2 | 98.3 |
| 6 | THF | 35 | 85.1 | 14.1 | 85.8 | 99.2 |
| 7 | DCM | 25 | 45.3 | 54.7 | 45.3 | 100 |
| 8 | 1,4-Dioxane | 25 | 97.7 | 2.1 | 97.9 | 99.8 |
| 9 | EtOAc | 25 | 0 | 100 | 0.0 | 100 |
| 10 | EtOH![[thin space (1/6-em)]](https://www.rsc.org/images/entities/char_2009.gif) : :![[thin space (1/6-em)]](https://www.rsc.org/images/entities/char_2009.gif) THF (1 THF (1![[thin space (1/6-em)]](https://www.rsc.org/images/entities/char_2009.gif) : :![[thin space (1/6-em)]](https://www.rsc.org/images/entities/char_2009.gif) 9) 9) |
25 | 77.9 | 22.1 | 77.9 | 100 |
| 11 | EtOH![[thin space (1/6-em)]](https://www.rsc.org/images/entities/char_2009.gif) : :![[thin space (1/6-em)]](https://www.rsc.org/images/entities/char_2009.gif) 1,4-dioxane (1 1,4-dioxane (1![[thin space (1/6-em)]](https://www.rsc.org/images/entities/char_2009.gif) : :![[thin space (1/6-em)]](https://www.rsc.org/images/entities/char_2009.gif) 4) 4) |
25 | 77.6 | 19.7 | 79.8 | 97.3 |
The solvent-effect for the transformation was also examined. THF remained the optimal choice for the transformation. However, the poor performance of 1,4-dioxane in the batch reactor was reverted in the mPBR, with an enhanced selectivity observed when using the continuous-flow technique (see Table S2, entry 5 in ESI†). Noticeably, the ethylacetate afforded aniline product, conclusively, under various conditions. This phenomenon contrasts with the previous prediction of selectivity co-relationship with the dielectric constant of the solvent,3a where the performance of ethylacetate should range between that of THF and 1,4-dioxane. Ethanol was also examined (not listed), where its poor solubility made us turn to a mix-solvent (Table 3, entries 10–11). However, this combination did not afford acceptable results in these cases.
Then, our attention was moved to the parameters for the continuous-flow reactor. The hydrogen gas pressure was screened first, which showed a strong influence on the outcomes. By increasing the pressure in the tube, the reaction performance was gradually enhanced (Table 4, entries 1–3), where a pressure of 30 psi was found to be the optimal choice. Further pressurization led the conversion toward being complete (Table 4, entries 4–5). However, the selectivity dropped dramatically, which could hardly satisfy the requirement.
| No. | P/psi | τ/s | HA-1 (%) | AM-1 (%) | Select. (%) | Conv. (%) |
|---|---|---|---|---|---|---|
| a Reaction conditions: NA-1 (c = 80 g L−1) in dioxane was added through the mPBR at 25 °C with a constant feeding rate. The H2 gas was pressurized with a back pressure. The conversion and selectivity were determined by HPLC analysis. | ||||||
| 1 | 0 | 600 | 73.1 | 6.4 | 91.9 | 79.5 |
| 2 | 15 | 600 | 91.1 | 5.1 | 94.7 | 96.2 |
| 3 | 30 | 600 | 97.2 | 2.4 | 97.6 | 99.6 |
| 4 | 45 | 600 | 91.6 | 8.1 | 91.9 | 99.7 |
| 5 | 60 | 600 | 78.6 | 21.4 | 78.6 | 100 |
| 6 | 30 | 600 | 97.2 | 2.4 | 97.6 | 99.6 |
| 7 | 30 | 200 | 97.8 | 2.1 | 97.9 | 99.9 |
| 8 | 30 | 120 | 99.2 | 0.2 | 99.8 | 99.4 |
| 9 | 30 | 86 | 77.6 | 3.5 | 95.7 | 81.1 |
| 10 | 30 | 60 | 63.5 | 1.7 | 97.4 | 65.2 |
The final part of optimization was conducted for the resident time. Interestingly, it was found that the amine could be further suppressed by fastening the feeding speed (Table 4, entries 6–9), which supported our initial strategy. The optimal resident time was 120 s for this case, where one achieved a conversion and selectivity of over 99%. A further increase in the feeding speed did not offer any better result. In contrast, a significant decrease in conversion was found (Table 4, entry 10), which may be attributed to an insufficient time for substrate adsorption on the catalyst due to the flow rate being too fast.
Reaction performance evaluation and catalyst regeneration
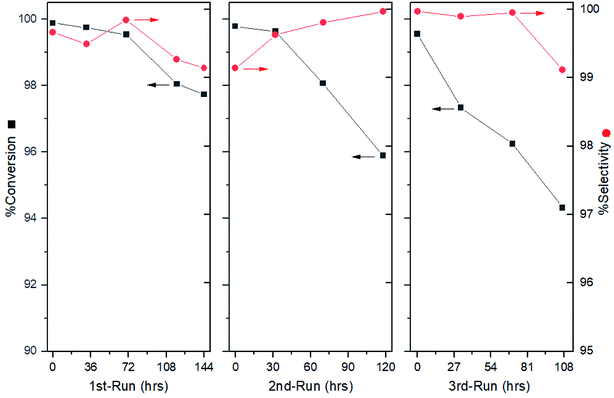
After the optimal condition was established, the durability of the catalytic system was also examined. After 144 h of operation, the selectivity was found to rain above 99.0%, where a slight drop in conversion was detected during the last 24 h (Fig. 4, left). The overall product was obtained with 99.0% conversion with an excellent selectivity of 99.5%. However, this result could hardly satisfy our expectation about the mPBR due to the tedious packing work involved. Thus, an additional exploration for catalyst treatment was conducted.The reason for the loss of conversion rate may be caused by the product covering the catalyst surface. Thus, replenishing the passivant and removing the cover may improve the performance. To avoid packing, the regeneration was expected to be conducted in a column. Instead of pumping the DMSO solely, a combined passivant, ammonia/DMSO ratio of 1![[thin space (1/6-em)]](https://www.rsc.org/images/entities/char_2009.gif) :
:![[thin space (1/6-em)]](https://www.rsc.org/images/entities/char_2009.gif) 10 (v/v) was used to flush the column overnight, avoiding potential activity blocking. The evaluation showed that the catalyst activity was recovered (Fig. 4, middle). Although the selectivity remained above 99.0%, a continuous drop in the conversion was observed after the initial 32 h. This phenomenon was further verified by a third run, in which the conversion dropped to 94.0% after 107 hours of operation (Fig. 4, right).
10 (v/v) was used to flush the column overnight, avoiding potential activity blocking. The evaluation showed that the catalyst activity was recovered (Fig. 4, middle). Although the selectivity remained above 99.0%, a continuous drop in the conversion was observed after the initial 32 h. This phenomenon was further verified by a third run, in which the conversion dropped to 94.0% after 107 hours of operation (Fig. 4, right).
Validation of mechanism
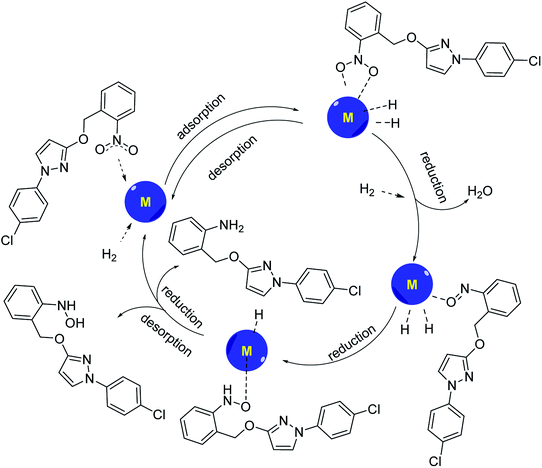
According to the Horiuti–Polanyi mechanism, the aromatic nitro compound is adsorbed on the surface of the metal catalyst, and the nitrogen–oxygen double bond of the nitro group is complexed with the metal, so that the nitrogen–oxygen double bond is pulled up, and the bond energy is weakened. At the same time, hydrogen molecules were also adsorbed on the surface of the catalyst, and bond cracks occurred on the surface of the catalyst, and active hydrogen atoms were obtained. The reactive hydrogen is inserted directly between the nitrogen–oxygen bonds, binding with the nitrogen to form the amino group, while losing a molecule of water to form a hydroxylamine-like compound with oxygen atoms complexing with the metal. The hydroxylamine compounds can be divided into two pathways to synthesize the corresponding aromatic hydroxylamine and aromatic amine compounds, and then the aromatic amine or aromatic hydroxylamine desorbs from the catalyst surface and leaves the catalyst surface to form the corresponding products (Scheme 3). If the aromatic hydroxylamine compound failed to desorb from the catalyst surface, it would be further reduced to the corresponding aromatic amines. If the aromatic amine compound could not be desorbed from the catalyst, the active site of the catalyst would be gradually covered and lost activity.Examination of substrate scope
Finally, a preliminary substrate scope examination was conducted to determine the functional group tolerance (Table 5). To our delight, substrates bearing halogen or benzyl groups afforded satisfactory results affording desired N-arylhydroxylamines with moderate to high yields.12 However, the methylester rendered an extremely poor selectivity toward hydroxylamine, where amine was found to be the main product. This result was similar to that found for EtOAc (Table 3, entry 9), indicating that the ester group may influence the catalytic activity. Further examination using 4-acetyl substrate suggested that the carbonyl part did not account for this phenomenon. Due to the instability of N-arylhydroxylamines, the nitrogen was amide derivatized.| Entry | R of NAs | Product no. | Select.b (%) | %Conv.b (%) |
|---|---|---|---|---|
| a Reaction conditions: NA (c = 80 g L−1) in THF was added through the mPBR at 25 °C with a resident time of 120 s. The H2 gas was pressurized with a back pressure of 30 psi.b The conversion and selectivity were determined by HPLC analysis after the reaction reached a steady state. | ||||
| 1 | 2-Cl | HA-2 | 99.1 | 83.8 |
| 2 | 3-Cl | HA-3 | 88.1 | 90.1 |
| 3 | 4-Cl | HA-4 | 99.2 | 88.0 |
| 4 | 4-Br | HA-5 | 93.9 | 94.2 |
| 5 | 2-OBn | HA-6 | 90.1 | 91.3 |
| 6 | 4-CO2Me | HA-7 | 39.4 | 89.1 |
| 7 | 4-Ac | HA-8 | 99.3 | 90.4 |
Conclusion
A protocol for the selective catalytic hydrogenation of nitroarenes to N-arylhydroxylamines was demonstrated to reveal the potential application of the continuous-flow technique in the preparation of labile compounds. In addition, the potency of the protocol was revealed by the preparation of pyraclostrobin's key intermediate HA-1, affording the product with excellent conversion and selectivity on average. The employment of a micropacked bed reactor enabled the high-efficiency heterogeneous catalysis using passivated RANEY®-nickel, which was treated by a combined liquid of aqueous ammonia and DMSO. Mechanistically, both components contribute to excellent kinetic control of the selective hydrogenation, where ammonia speeds up the initial nitro- and nitrone-reduction and the DMSO inhibits the undesired hydroxylamine-reduction. Moreover, a strategy is proposed for the regeneration of catalyst in the mPBR. By pumping the passivant liquid through the mPBR, the catalyst could be reused for another 200 h, affording the desired product with acceptable selectivity (>95%). A preliminary scope for substrates was examined, which showed good results. Further studies including mechanistic elucidation are still under investigation in our laboratory.Experimental section
General information
Catalyst preparation, nomenclature, characterization and activity evaluation
The passivated catalysts are prepared according to the following procedure: RANEY®-Ni (20.00 g) was thoroughly washed by deionized water until neutral. Then, the obtained solid was suspended and stirred in the passivant (DMSO![[thin space (1/6-em)]](https://www.rsc.org/images/entities/char_2009.gif) :
:![[thin space (1/6-em)]](https://www.rsc.org/images/entities/char_2009.gif) NH3·H2O = 10
NH3·H2O = 10![[thin space (1/6-em)]](https://www.rsc.org/images/entities/char_2009.gif) :
:![[thin space (1/6-em)]](https://www.rsc.org/images/entities/char_2009.gif) 1, 45 mL) at 48 °C for 24 h. After filtration, the catalysts were obtained and named after the following rules: D for DMSO, A for amine, 400 for mesh size, r for recovery.
1, 45 mL) at 48 °C for 24 h. After filtration, the catalysts were obtained and named after the following rules: D for DMSO, A for amine, 400 for mesh size, r for recovery.
Infrared (IR) spectroscopy was measured using Fourier-transform infrared spectroscopy, Bruker Vertex 70 V, using KBr powder for sample preparation. Powder X-ray diffraction (PXRD) was recorded by a Bruker D8 Advance diffractometer with a CuKα (λ = 0.154 nm) X-ray source operated at 40 kV. Energy dispersive X-ray spectroscopy (EDS) was conducted with an Element instrument made by EDAX. The elemental composition was analyzed using an Elementar Vario EL cube element analyzer. Scanning electron microscopy (SEM) was carried out using a Hitachi S-4800 field emission SEM, with a working voltage of 10 kV. Transmission electron microscopy (TEM) images were captured with a Hitachi HT-7700 working at 100 kV. Nitrogen adsorption–desorption isotherms for the samples were obtained using a TriStar II analyzer, with all samples degassed at 200 °C for 6 h to remove moisture and volatile impurities.
The evaluation of catalyst performance was carried out in a Teflon-lined stainless-steel autoclave (50 mL). Typically, the substrate 1-(4-chlorophenyl)-3-((2-nitrobenzyl)oxy)-1H-pyrazole (7.55 mmol, 2.50 g) and passivated catalyst (0.125 g) were mixed with THF (20 mL) in the autoclave. Then, the reactor was sealed and purged with N2 for three times. The autoclave was held at a temperature of 38 °C with magnetic stirring at 700–800 rpm. After 30 min of stirring, the reactor was cooled down to −7 °C, purged with H2 for three times and pressurized to 0.6 MPa. Then, the reaction was tracked with HPLC analysis until complete.
Micropacked bed continuous-flow reactor setup
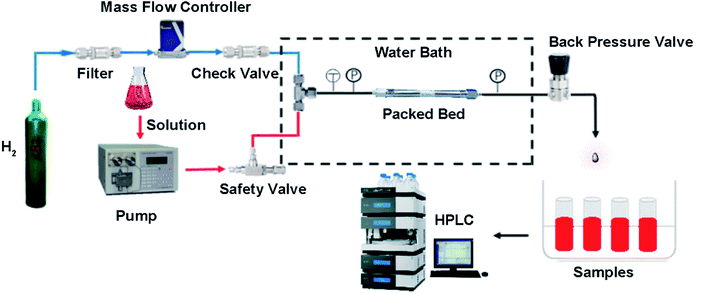
The setup for the micropacked bed continuous-flow reactor refers to the apparatus setup reported by Jensen.9 The packed bed was laid horizontally in a water bath for temperature control. The hydrogen gas was controlled by a hydrogen-specific mass flow controller (DO7-19BM, max pressure 10 MPa), which was protected by a check valve. The liquid flow was supplied with a dual-piston HPLC pump (LC-500P constant pressure infusion 0–15 MPa). The gas and liquid were mixed in a T-shape mixture before the entrance of the mPBR (SS-98 max pressure 3.5 MPa). All tubes were made of stainless-steel with an outer diameter of 1/16 inch. A manual back-pressure regulator was placed at the outlet of the reactor to control the system pressures (Fig. 5).The catalysts were loaded into a clean HPLC column with a diameter of 4.6 mm and a length of 150 mm, and compacted with a high-pressure vacuum tube. The column was further blown with nitrogen gas until the pressure of nitrogen gas reached 0.2–0.5 MPa. The procedure was repeated several times until the column was completely filled (approximately 4.1 g of catalyst), and both ends were sealed with a sealing nut for use.
Experiment process for continuous-flow reaction
The substrate 1-(4-chlorophenyl)-3-((2-nitrobenzyl)oxy)-1H-pyrazole was prepared as a 0.24 mol L−1 stock solution in dioxane. The packed-bed reactor was placed into a water bath of 25 °C, in which the passivated catalyst stored in EtOAc was drained by flowing H2 gas. After the back pressure reached 30 psi (less than 1 min), the solution was introduced to the reactor. After purging for 7–10 reactor volumes (approximately 20 min), the system reached a steady state. The sample was collected for 2–3 times, where the sampling interval was 20–30 minutes. Reactor variables were then adjusted and sampled after reaching the steady state (approximately 20 min). When the experiments were complete, the water bath was removed first, and the back pressure released to the atmosphere. Following the depressurization, the mPBR was drained by H2 before stopping the H2 gas. Then, the EtOAc was introduced into the mPBR, where 5–7 reactor volumes were flowed over before the reactor was sealed with this solvent for storage.Method for product analysis
Conflicts of interest
There are no conflicts to declare.Acknowledgements
The authors would like to acknowledge the financial support from Zhejiang Provincial Key R&D Project (No. 2018C03074 & 2020C03006) and the Natural Science Foundation of Zhejiang Province (No. LQ20B060006).References
- (a) A. D. McGill, W. Zhang, J. Wittbrodt, J. Wang, H. B. Schlegel and P. G. Wang, Bioorg. Med. Chem., 2000, 8, 405–412 CrossRef CAS PubMed; (b) J. S. Yadav, B. V. S. Reddy and P. Sreedhar, Adv. Synth. Catal., 2003, 345, 564–567 CrossRef CAS; (c) A. El-Faham and F. Albericio, Eur. J. Org. Chem., 2009, 2009, 1499–1501 CrossRef; (d) S. Sabir, G. Kumar and J. L. Jat, Org. Biomol. Chem., 2018, 16, 3314–3327 RSC.
- (a) M. Orlandi, D. Brenna, R. Harms, S. Jost and M. Benaglia, Org. Process Res. Dev., 2016, 22, 430–445 CrossRef; (b) H. Goksu, H. Sert, B. Kilbas and F. Sen, Curr. Org. Chem., 2017, 21, 794–820 CrossRef CAS.
- (a) S. L. Karwa and R. A. Rajadhyaksha, Ind. Eng. Chem. Res., 1987, 26, 1746–1750 CrossRef CAS; (b) M. Studer, S. Neto and H. U. Blaser, Top. Catal., 2000, 13, 205–212 CrossRef CAS; (c) Y. Takenaka, T. Kiyosu, J.-C. Choi, T. Sakakura and H. Yasuda, Green Chem., 2009, 11, 1385–1390 RSC; (d) Y. Takenaka, T. Kiyosu, J.-C. Choi, T. Sakakura and H. Yasuda, ChemSusChem, 2010, 3, 1166–1168 CrossRef CAS PubMed; (e) D. V. Jawale, E. Gravel, C. Boudet, N. Shah, V. Geertsen, H. Li, I. N. N. Namboothiri and E. Doris, Chem. Commun., 2015, 51, 1739–1742 RSC.
- (a) T. Gubica, J. Stroka and A. Temeriusz, J. Phys. Org. Chem., 2007, 20, 375–383 CrossRef CAS; (b) Y. Chen, L. Xiong, W. Wang, X. Zhang and H. Yu, Front. Environ. Sci. Eng., 2015, 9, 897–904 CrossRef CAS.
- (a) D. Cantillo, M. M. Moghaddam and C. O. Kappe, J. Org. Chem., 2013, 78, 4530–4542 CrossRef CAS PubMed; (b) M. B. Plutschack, B. Pieber, K. Gilmore and P. H. Seeberger, Chem. Rev., 2017, 117, 11796–11893 CrossRef CAS PubMed; (c) J. Britton, S. Majumdar and G. A. Weiss, Chem. Soc. Rev., 2018, 47, 5891–5918 RSC; (d) F. M. Akwi and P. Watts, Chem. Commun., 2018, 54, 13894–13928 RSC.
- (a) L. Ducry and D. M. Roberge, Angew. Chem., Int. Ed. Engl., 2005, 44, 7972–7975 CrossRef CAS PubMed; (b) Z. Wen, F. Jiao, M. Yang, S. Zhao, F. Zhou and G. Chen, Org. Process Res. Dev., 2017, 21, 1843–1850 CrossRef CAS; (c) Z. Yu, X. Ye, Q. Xu, X. Xie, H. Dong and W. Su, Org. Process Res. Dev., 2017, 21, 1644–1652 CrossRef CAS; (d) Z. Yu, J. Chen, J. Liu, Z. Wu and W. Su, Org. Process Res. Dev., 2018, 22, 1828–1834 CrossRef CAS.
- P. J. Cossar, L. Hizartzidis, M. I. Simone, A. McCluskey and C. P. Gordon, Org. Biomol. Chem., 2015, 13, 7119–7130 RSC.
- (a) M. Irfan, T. N. Glasnov and C. O. Kappe, ChemSusChem, 2011, 4, 300–316 CrossRef CAS PubMed; (b) R. Munirathinam, J. Huskens and W. Verboom, Adv. Synth. Catal., 2015, 357, 1093–1123 CrossRef CAS; (c) K. Masuda, T. Ichitsuka, N. Koumura, K. Sato and S. Kobayashi, Tetrahedron, 2018, 74, 1705–1730 CrossRef CAS; (d) M. B. Said, T. Baramov, T. Herrmann, M. Gottfried, J. Hassfeld and S. Roggan, Org. Process Res. Dev., 2017, 21, 705–714 CrossRef CAS.
- C. Yang, A. R. Teixeira, Y. Shi, S. C. Born, H. Lin, Y. Li Song, B. Martin, B. Schenkel, M. Peer Lachegurabi and K. F. Jensen, Green Chem., 2018, 20, 886–893 RSC.
- L. Li, T. V. Marolla, L. J. Nadeau and J. C. Spain, Ind. Eng. Chem. Res., 2007, 46, 6840–6846 CrossRef CAS.
- (a) Z. Yu, G. Tong, X. Xie, P. Zhou, Y. Lv and W. Su, Org. Process Res. Dev., 2015, 19, 892–896 CrossRef CAS; (b) Z. Yu, G. Lu, J. Chen, S. Xie and W. Su, J. Flow Chem., 2018, 8, 51–57 CrossRef CAS; (c) X. Xie, S. Xie, H. Yao, X. Ye, Z. Yu and W. Su, React. Chem. Eng., 2019, 4, 927–931 RSC.
- The reported conversion and selectivity was based on the HPLC analysis after the reaction reached the steady-state. However, due to the lability of the N-arylhydroxylamines, the further structure characterization was conducted after the protection of methoxy carbonyl group.
Footnote |
| † Electronic supplementary information (ESI) available. See DOI: 10.1039/d0ra05715k |
| This journal is © The Royal Society of Chemistry 2020 |


