 Open Access Article
Fabrication of salicylic acid nanosphere for long-term induced immunity performance
Chao Feng *a,
Xingling Tianb,
Xiaoqiang Wanga,
Mengmeng Cuia,
Chuantao Xuc,
Weimin Wangd and
Wei Wang
 e
e
aKey Laboratory of Tobacco Pest Monitoring & Integrated Management, Tobacco Research Institute, Chinese Academy of Agricultural Sciences, Qingdao 266101, China. E-mail: fengchao020511@163.com
bConservation and Restoration Institute, Chinese Academy of Cultural Heritage, Beijing 100029, China
cLuzhou Branch, Sichuan Provincial Tobacco Company, Luzhou 646000, Sichuan, China
dZhejiang Zhongyan Industry Co., Ltd., Hangzhou 31000, Zhejiang, China
eSchool of Materials Science and Engineering, Ocean University of China, Qingdao, 266100, China
First published on 4th August 2020
Abstract
We synthesised a silicon dioxide nanosphere with a novel nanostructure by loading salicylic acid (SA) as a plant disease resistance inductor to prolong plant life. The SA nanosphere was evaluated by scanning electron microscopy, transmission electron microscopy, Fourier transform infrared spectroscopy, N2 adsorption method, enzyme activity test and pot experiments. The results demonstrated that the SA nanosphere induced the activities of polyphenol oxidase, phenylalanine ammonia-lyase, peroxidase, and chitinase to enhance plant immunity to inhibit Phytophthora nicotianae. Its SA loading capacity reached approximately 80%. The SA nanospheres exhibited a sustained release and maintained its resistance effect at 84.79% after 15 days. Thus, the SA nanospheres could gradually release SA to enhance inhibitive enzyme activity in diseased plants. Furthermore, finite element method was used to establish different nanosphere models and analyse the SA releasing process. SA concentration sharply increased near the nanospheres, and SA was slowly released to the solution. This SA nanosphere will have a great potential in future environmental-friendly practical application.
Introduction
Controlled release and specificity are the essential conditions for an elicitor delivery system.1–3 Elicitors play an important role in the control of pests, weeds and diseases in agricultural, pharmaceutical and biological fields; however, environmental pollution, residual toxicity, and human diseases are also caused by elicitors. Chemical manufacturing requires much energy consumption and generates hazardous chemical wastes. Materials, such as halloysite clay nanotubes,4,5 layered double hydroxides,6 pH sensor materials,7 nanofibres8 and polymers,9 can be used as elicitor-loading nanocarriers but with a small loading capacity.Several elicitor delivery systems (liposomes, polymer capsules, hydrogels, nanogels, nanoparticles, etc.) have been developed in the last few decades to reduce the dosage of pesticides and prolong the efficacy of active ingredients in target crops.10,11 Mesostructured materials have recently attracted scientists because of their high surface area, tunable pore size, porous structure and thermal stability, which are beneficial for the loading and delivery of elicitors in a controlled manner under external stimuli.12,13 Therefore, reducing the dosage of pesticides whilst prolonging the effect of active ingredients in target crops are of remarkable interest.
Mesostructured materials can effectively reduce chemical exposure to maintain a prolonged release system and provide safety for operators. Silica materials can be synthesised in the form of mesoporous silica nanoparticles (MSNs) with a well-defined particle size (e.g. <200 nm) and tunable morphology (e.g. nanospheres or rods) to penetrate easily through the cellular membrane.14,15 Silica is considered as safe by the Food and Drug Administration and has been used in many daily-based products and as excipient in pharmaceutical formulations.13
Salicylic acid (SA) is a safe chemical material used in the induction of plant resistance, which is a reliable and eco-friendly way for the management of different plant diseases.16–18 SA as an anti-inflammatory substance had been previously incorporated into a pH-responsive hydrogel system.19 Porous nanofibre-microsphere mats of collagen/polyvinyl alcohol containing SA as model elicitor were prepared by electrospinning for the assessment of an elicitor delivery system.20 A ginger derived nanocarrier with a size of 50–100 nm was used for the controlled release of the anti-inflammatory elicitor 5-amino SA.21 Inspired by the use of a porous material as elicitor carrier, we loaded SA in mesoporous silica to induce the resistance of plants against a broad spectrum of pathogens (bacteria, viruses, fungi, etc.).
We report herein the synthesis of mesoporous silica loaded with SA for the induction of long-term disease resistance in plants. Mesoporous silica has been proven safe for agricultural use because of its harmlessness to the environment. SA nanospheres could induce the activities of polyphenol oxidase (PPO), phenylalanine ammonia-lyase (PAL), peroxidase (POD) and chitinase (CHI) to enhance plant immunity against Phytophthora nicotianae (P. nicotianae). Moreover, SA nanospheres have a sustained release ability to maintain a long-term fungistasis effect and protect plants.
Experimental
Materials
Tetraethyl orthosilicate (TEOS), hexadecyltrimethylammonium chloride (CTAC), triethanolamine (TEA), (3-glycidyloxypropyl)trimethoxysilane, ethyl acetoacetate, isopropyl alcohol, ethanol (EtOH), sodium chloride (analytical grade), SA, PPO, PAL, POD and CHI were purchased from Sinopharm Chemical Reagent Co., Ltd. Enzyme-linked immunosorbent assay (ELISA) kits for plant PPO, PAL, POD and CHI were purchased from Clontech Laboratories, Inc. (CA) and used for defence enzyme activity tests. Moreover, tetra-n-propoxy zirconium (70 wt% in n-propanol) were purchased from Aladdin Industrial Corporation. All the chemicals were used as received. The water used in all experiments was purified with Millipore Milli-Q Plus 185 purification system and had a resistivity level higher than 18.1 MΩ cm.The tobacco seeds used in the tests were Xiaojin 1025, which were provided by the national tobacco germplasm resources of the medium-term bank of the Tobacco Research Institute of Chinese Academy of Agricultural Sciences. The seeds were soaked, disinfected, germinated in the dark at 28 °C for 45 days and transplanted in sand culture. Pot experiments were carried out in the greenhouse of the Tobacco Research Institute of Chinese Academy of Agricultural Sciences. The daily average temperature was 25 ± 1 °C. The pots used were 20 cm in height and 25 cm in diameter. Each pot contained 8 kg soil, matrix (humic acid ≥ 5.0%, organic matter ≥ 25.0%) and brown soil with available nitrogen of 97.29 mg kg−1, phosphorus of 8.84 mg kg−1 and potassium of 216.98 mg kg−1. The matrix and brown soil were mixed at a ratio of 1![[thin space (1/6-em)]](https://www.rsc.org/images/entities/char_2009.gif) :
:![[thin space (1/6-em)]](https://www.rsc.org/images/entities/char_2009.gif) 1 (v/v) and then placed in a basin. Then, one tobacco was planted in each basin.
1 (v/v) and then placed in a basin. Then, one tobacco was planted in each basin.
MSNs synthesis
The Stöber method was modified to prepare the MSNs22 as shown in Fig. 1. CTAC (2 g) was dissolved in 50 mL of H2O by continuous stirring at room temperature. Then, 10 mL of EtOH and 6 mL of TEA were added to the solution and the mixture was vigorously stirred for 10 min. The prepared solution was heated to 80 °C in an oil bath, and 4 mL of TEOS was added drop wise under fast stirring. The mixture was refluxed at 80 °C for 2 h and then cooled to room temperature. The nanoparticles were collected by centrifugation (8000 rpm, 10 min). Finally, the nanoparticles were cauterised at 600 °C in a muffle furnace for 8 h to resolve the template agent and obtain the MSNs. The SA saturated EtOH solution was absorbed into the nano-channels of the MSNs by vacuum method.SA nanosphere preparation
MSNs (200 mg) were re-dispersed into the SA-saturated EtOH solution. EtOH was chosen as the solvent, because EtOH is a clean and efficient solvent that can be dissolved in large quantities in alcohol, which is easily volatilised after the capsule is prepared.23,24 Then, the turbid liquid was transferred to a vacuum chamber (50 mbar) for 30 min, and the nanoparticles were recovered by centrifugation (8000 rpm, 5 min). Finally, the nanoparticles were washed using EtOH to remove the residual SA on its surface and then dried at 333 K. The steps were repeated three times to maximise the loaded amount of SA.Characterization
The field-emission scanning electron microscopy (FE-SEM) images of the samples were acquired with a Sigma 500 FE-SEM microscope with a scanning and transmission electron microscope probe (Carl Zeiss Co., Ltd.). The transmission electron microscopy (TEM) images of the nanostructures were recorded using a HT7700 TEM microscope (Hitachi Co., Ltd.). The leaves and roots of the tobacco plants were treated with SA nanosphere (sample 1), Phytophthora tabacum (sample 2) and water (sample 3) and prepared for TEM analysis. Each sample was washed three times with 0.1 mol L−1 sodium phosphate buffer, then fixed 1% osmium tetroxide at room temperature for 1.5 h, washed three times with buffer and dehydrated with gradient ethanol. The samples were penetrated, embedded and polymerised using Epon 812 as embedding agent. The samples were sliced into ultrathin sheet by an ultrathin slicer for TEM. N2 adsorption method was adopted to characterise the mesoporous structure, pore volume and specific surface area of the MSNs, and a fully automatic specific surface area and pore size distribution analyser (Autosorb-iQ, Quantachrome Instruments, US) was employed. The test temperature was 77 K, and the sample was desorbed at 373 K for 6 h before the test. The specific surface area of the sample was calculated by Brunauer–Emmett–Teller (BET) method based on the adsorption data when the relative pressure (P/P0) was within 0.02–0.5. The pore size distribution was calculated by Barrett–Joyner–Halenda (BJH) model based on the adsorption isotherm. Pore volume was calculated by the adsorption capacity at P/P0 = 0.97. The particle size and zeta potential of the MSNs were measured with a nanoparticle size and zeta potential analyser (Malvern Zetasizer Nano ZS). Thermogravimetric analysis was performed on a Q5000 thermogravimetric analyser from TA Instrument. Certain amounts of samples were placed into a crucible, and the temperature was increased from 30 °C to 700 °C with a rate of 10 °C min−1 under air atmosphere. Finite element method (FEM) was used to calculate the releasing performance of the SA nanospheres. The 2-D geometries of one nanosphere, two nanospheres and four nanosphere models were established by Comsol software.Defence enzyme activity test
The tobacco plants infected with P. nicotianae were treated with SA nanospheres, SA solution, water and inoculation with P. nicotianae, separately. Each tobacco pot except the water and inoculation with P. nicotianae sample was added with 0.001 μg SA. The concentration of P. nicotianae was 1 × 10⁶ spores per milliliter. Leaves were collected after inducer treatments to measure the activities of enzymes PPO, PAL, POD and CHI at 1, 2, 3, 4, 5, 6, 7, 8, 9 and 10 days using plant ELISA kits (Clontech Laboratories, Inc., CA) according to the manufacturer's instructions. One gram of tobacco leaves was added with 5.0 mL (50 mmol L−1) of phosphate buffer solution. Then, the mixture was ground under ice bath at 0–4 °C and extracted for 20 min at 18![[thin space (1/6-em)]](https://www.rsc.org/images/entities/char_2009.gif) 000 rpm, and the supernatant was stored at 4 °C in refrigerator.
000 rpm, and the supernatant was stored at 4 °C in refrigerator.
Induced immunity effect test
The tobacco plants were subjected to three treatments, namely, SA nanospheres, SA solution and water. Each treatment comprised 20 tobacco samples. The inducers were added to the roots. Each test was repeated four times. Wounded plant method was performed after one day to measure the inoculation concentrations of conidial suspension with 10–20 per field of vision under a low-power microscope. Then, the samples were incubated in a light incubator under constant temperature (28 °C) and humidity (relative humidity above 60%).Results and discussion
MSNs characterisation
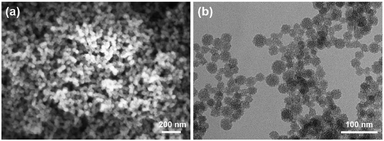
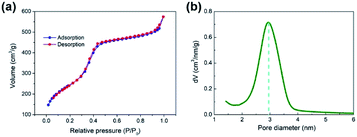
Fig. 2a shows the FE-SEM overview image of the synthetic MSNs via modified Stöber method (polymeric unimolecular templates). The diameter of the MSNs was approximately 50 nm. The MSNs present a form of homogeneous sphere with plenty of pores on the surface (Fig. 2b). These pores are random, open and extended from the nanoparticles' surface to the inside and form a complex pore network. The TEM morphology is typical in MSNs.The zeta potential distribution of the prepared nanoparticle emulsion is shown in Fig. 3a. The average zeta potential was +50 mV, which indicates that the stability of the emulsion is good. The particle diameter distribution of MSNs in water was measured by dynamic light scattering as shown in Fig. 3b. An intensity-weighted hydrodynamic diameter of approximately 50 nm was obtained with a narrow distribution range, which suggested that the MSNs can be well dispersed in solution almost without aggregation. The particle size polydispersity index was 0.220, which indicates that the MSNs have a uniform dispersion in water. N2 adsorption–desorption test was performed to further characterise the pore structure of the MSNs.25,26 The N2 adsorption–desorption isotherm in Fig. 4a is a type IV isotherm because of the presence of a hysteresis loop, which is typical in mesoporous materials.27,28 Monolayer adsorption occurred at a lower relative pressure. Then, multilayer adsorption took place with the increase in relative pressure. The steep step in the isotherm at P/P0 = 0.3–0.5 indicated that N2 had filled the mesopores because of capillary condensation. The absorption equilibrium of N2 was achieved when a long adsorption platform appeared. The hysteresis loop was formed as the desorption pressure is always smaller than the absorption pressure because of the capillary condensation effect of mesopores. The surface area of the MSNs calculated through the BET method was 951.60 m2 g−1, and their total pore volume was 1.05 mL g−1. The BJH pore size distribution curve in Fig. 4b shows that the pore size was distributed within a narrow range between 2 and 8 nm, and most pores were approximately 3 nm.
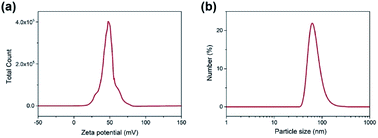 | ||
| Fig. 3 (a) Zeta potential distribution of silica nanoparticle emulsion and (b) particle size distribution of MSNs in water. | ||
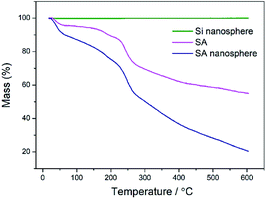
The SA loading capacity and thermal stability of the SA nanospheres were evaluated through thermogravimetric analysis. Fig. 5 shows the mass loss curves of MSNs, SA and SA nanospheres under air atmosphere. The fungistasis agent SA started to decompose at 210 °C, finished the first decomposition stage at 272 °C, and almost completely discomposed at 600 °C. The mass losses of MSNs and SA nanospheres were 0% and 80%, respectively; therefore, the SA loading capacity was approximately 80%.
Induction effect of SA nanosphere
The PPO activity of the sample inoculated with P. tabacum and treated with SA solution gradually increased and reached the maximum value on the 4th day and then rapidly decreased and reached the minimum value on the 10th day (Fig. 6a). SA nanosphere treatment gradually increased enzyme activity until the 9th day, when the maximum value, which was 14 times higher than that of water treatment, was achieved. In addition, the enzyme activity of the sample treated with SA nanosphere was higher than that of the sample treated with SA solution on the 7th day. The results showed that SA could induce the increase of PPO activity in tobacco leaves, and SA nanosphere could continuously induce the increase of PPO activity.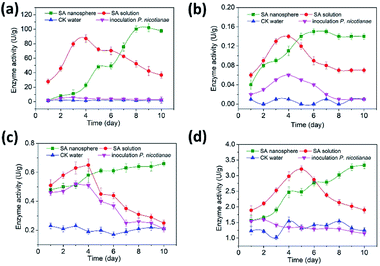 | ||
| Fig. 6 Efficiency of different treatments on PPO (a), PAL (b), POD (c) and CHI (d) at different days. | ||
Fig. 6b shows that the PAL activity of the sample treated with SA nanosphere increased within 5 days, slowly increased in 5–7 days and attained a peak value of 0.15 U g−1, which was nearly 15 times that of the water-treated sample, on the 7th day. Afterwards, PAL activity slightly decreased to 0.14 U g−1 on the 8th day. The PAL activity of the sample treated with SA solution had a peak trend with a maximum value of 0.14 U g−1, which was 14 times that of the water-treated sample, on the 4th day. Then, PAL activity sharply decreased to 0.07 U g−1 after the 4th day and was stable after the 8th day. Importantly, the PAL activity of the SA nanosphere-treated sample was twice that of the SA solution-treated sample after the 6th day. PAL is a key enzyme in the metabolism of phenylpropane derivatives. Phenylpropane metabolism is one of the three major secondary metabolism pathways in plants. Its metabolites, including phenols, isoflavones, phytoalexin and lignin, play a role as chemical barriers in plant disease resistance.29,30
Fig. 6c shows that the POD activity of the sample treated with SA solution increased and reached the maximum value of 0.65 U g−1 on the 3rd day and then continuously decreased to 0.25 U g−1, which was the minimum value on the 10th day. By contrast, the POD activity of the sample treated with SA nanosphere continuously increased to 0.66 U g−1 on the 10th day. The POD activity of the SA-treated sample was clearly higher than that of the water-treated sample.
Fig. 6d shows the CHI activities of the plants subjected to different treatments. The CHI activity of the sample treated with SA solution increased and reached the maximum value of 3.21 U g−1 on the 5th day and then continuously decreased until the minimum value of 3.33 U g−1 on the 10th day. By contrast, the CHI activity of the sample treated with SA nanosphere continuously increased up to 0.66 U g−1 on the 10th day, which is 2.66 times that of the water-treated sample. Thus, SA induced the enhancement of phenylpropane metabolism and CHI expression in tobacco, which improved the disease resistance of tobacco.
The PPO, PAL, POD and CHI activities of tobacco plants were low when inoculated with P. nicotianae alone. PPO, PAL, POD and CHI activities were increased by SA solution treatment until their maximum values were reached in 4, 4, 4 and 5 days, respectively; however, their values rapidly decreased afterwards. The reason was that the metabolic system of tobacco plants was destroyed by Phytophthora inoculation, and the PPO, PAL, POD and CHI activities of tobacco plants treated with SA were remarkably reduced. The results showed that SA could induce the increase in the activity of defence enzymes in tobacco leaves to enhance the resistance of tobacco plants. No substantial difference in the enzyme activities between MSN and water control treatment was observed; thus, MSN had no effect on defence enzymes. The enzyme activity of the samples treated with SA nanosphere was longer than that of the samples treated with SA solution. This result indicated that SA nanosphere could continuously and strongly stimulate defence reaction in plants.
Soil infestation by P. nicotianae
P. nicotianae was inoculated in a culture medium with 8% oat and shaken on a rotary shaker for 24 h at 30 °C and 150 rpm. Fungal spores were suspended in sterilised water and mixed thoroughly with P. nicotianae into plants. The soil properties are as follows: pH 6.50, 14.11 g kg−1 of total C, 2.02 g kg−1 of total N, 1.24 g kg−1 of total P, 12.35 mg kg−1 of available P, 10% sand, 50% silt and 40% clay. The concentration of P. nicotianae was adjusted to 10 CFU g−1 dry soil.The pot experiments were conducted in a greenhouse in Qingdao, Shandong Province. Surface sterilisation was used to treat the tobacco seeds with household bleach (2% NaOCl) for 6 min. Then, the seeds were rinsed six times in Milli-Q water and sown in a 3![[thin space (1/6-em)]](https://www.rsc.org/images/entities/char_2009.gif) :
:![[thin space (1/6-em)]](https://www.rsc.org/images/entities/char_2009.gif) 3
3![[thin space (1/6-em)]](https://www.rsc.org/images/entities/char_2009.gif) :
:![[thin space (1/6-em)]](https://www.rsc.org/images/entities/char_2009.gif) 4 mixture of vermiculite, perlite and turf. The resulting medium was sterilised at 121 °C for 2 h and placed into a sterilised plastic tray. The plastic tray was placed over distilled water and kept at 28–30 °C and 60% relative humidity for approximately 60 days. Appropriate fertilisers were applied during the entire seedling stage.
4 mixture of vermiculite, perlite and turf. The resulting medium was sterilised at 121 °C for 2 h and placed into a sterilised plastic tray. The plastic tray was placed over distilled water and kept at 28–30 °C and 60% relative humidity for approximately 60 days. Appropriate fertilisers were applied during the entire seedling stage.
The stem base of the tobacco plant was treated with SA nanosphere, SA solution, and water, separately. Each treatment was repeated four times. The spore suspension of Phytophthora pestis was inoculated by trauma inoculation, and then the plants were cultured in a light incubator at constant temperature (28 °C) and moisture (relative humidity above 60%).
Disease index (DI) and induced immunity effect (IIE) were calculated according to the following formulas:
 | (1) |
 | (2) |
As shown in Table 1, SA nanosphere and SA solution (100 μg mL−1) had induced effects. The disease resistance effects of the SA nanosphere were 100%, 93.92% and 84.79% whereas those of the SA solution were 88.77%, 74.99% and 52.52% at 7, 10 and 15 days, respectively. Obviously, the SA nanosphere had a higher induced effect than the SA solution, and its induced effects were all higher than 80%. The results showed that SA can stimulate defence reaction enzymes, which can remarkably improve the disease resistance of tobacco leaves.
| Fungicides | C (μg mL−1) | DI (3 day) | IIE (%) | DI (7 day) | IIE (%) | DI (10 day) | IIE (%) | DI (15 day) | IIE (%) |
|---|---|---|---|---|---|---|---|---|---|
| SA nanosphere | 100 | (0.00 ± 0.00) bB | 100 ± aA | (0.00 ± 0.57) bB | (100 ± 1.12) aA | (2.41 ± 0.25) bB | (93.92 ± 2.31) aA | (10.38 ± 0.56) bB | (84.79 ± 1.23) aA |
| SA solution | 100 | (0.00 ± 0.00) bB | 100 ± aA | (2.34 ± 0.19) bB | (88.77 ± 2.28) aA | (10.25 ± 0.86) bB | (74.99 ± 1.35) bB | (34.31 ± 1.98) bB | (52.51 ± 0.78) bB |
| Water | — | (10.21 ± 0.18) aA | — | (20.83 ± 0.15) aA | — | (40.98 ± 1.32) aA | — | (72.50 ± 2.31) aA | — |
The death rate of tobacco plants was 100% under water treatment 15 days after Phytophthora inoculation and decreased under SA nanosphere and SA solution treatments. Treatment with SA solution delayed the disease onset time by 7 days and increased the control effect to 88.77% compared with water treatment. However, the control effect began to decline and the lower leaves showed spots after 10 days. The SA nanosphere treatment delayed the disease onset time by 10 days and increased the control effect to 93.92%, which was remarkably higher than those of the other treatments. The results showed that the SA nanosphere could delay the occurrence and inhibit the effect of P. nicotianae and is therefore beneficial to control P. nicotianae.
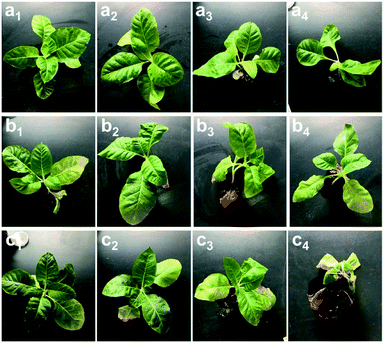
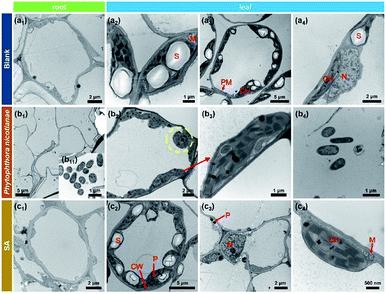
SA has two active groups that caused fungicidal effect as shown in Fig. 7. One is the SA nanosphere group, which could not inhibit fungicidal growth outside of plants but was highly effective inside the plant (Fig. 7a1–a4). The active ingredient of the SA nanosphere taken up by the plant causes the increased resistance. The other is the SA solution group, which inhibited fungicidal growth until the 15th day (Fig. 7b1–b4). The plants gradually had pathopoiesia within 15 days (Fig. 7c1–c4).
The control effect of SA on P. nicotianae through SA nanosphere and SA aqueous solution was studied. The SA nanosphere and SA solution treatments had certain control effect on P. nicotianae. Their induced resistance effect rates were higher than that of water treatment. The control effects of the SA nanosphere and SA solution were 84.79% and 52.51%, respectively, on the 15th day. The highest induced resistance effect rate was achieved by the SA nanosphere. Its control effect was 100% on the 7th day, which coincided with the results of the induction test. The control effect of the SA nanosphere 15 days after P. nicotianae inoculation was 84.79%, which was substantially higher than that of the SA solution against P. nicotianae. The possible reasons were as follows. Tobacco P. nicotianae infects from the roots to cause disease. SA was applied to the soil because the spray could not penetrate the tobacco plants and resulted in a low 7 day control effect. The SA nanosphere had a continuous release process. The activities of defence enzymes were enhanced with the increase of soil release, and the control effect on P. nicotianae increased and persisted for 15 days. The SA solution spray only stayed on the surface of the plant; thus, SA partly infiltrated the plant body and was partly reduced by volatilisation in air.
The tobacco plants were infected with P. nicotianae and treated with SA nanospheres, SA solution and water, respectively. Fig. 8a1 shows the complete cell morphology of the tobacco root without any treatment. The starch grains in the mitochondrion in Fig. 8a2, the plasma membrane and chloroplast in Fig. 8a3 and the nucleus in Fig. 8a4 exist in a normally growing leaf. Fig. 8b1 and b11 show that P. nicotianae crossed the cell wall and was located in the cytoplasm of roots with fungal infection. Starch granules in chloroplasts disappeared and many organelles collapsed and degraded after P. nicotianae infection. The yellow circle in Fig. 8b2 shows that the leaf plasma membrane and cell wall separated. Fig. 8b3 illustrates the existence of P. nicotianae in the chloroplast. Starch grains disappeared whereas P. nicotianae was present in the fungus-infected leaf (Fig. 8b4). The fungus infected the nucleus, and the nucleus lost its normal structure. The nuclear membrane was disintegrated, and nuclear fluid overflowed from the cell.
P. nicotianae was not found in the fungus-infected root after SA treatment as shown in Fig. 8c1. Some starch grains remained embedded into the chloroplast and cell wall in Fig. 8c2, and some black balls (protein balls) also remained as shown in Fig. 8c2 and c3. This result indicated that the plant's self-protection function was triggered by SA. The leaf of the SA-treated tobacco also had a nucleus and mitochondria as shown in Fig. 8c3 and c4.
FEM calculations
The Nernst–Planck equation (eqn (3)) was used to account for the fluxes of mobile SA from MSNs in the water and in the surrounding medium. The equation is an extension of Fick's law of diffusion and represents the flux of ions caused by concentration gradient and electric field.
 | (3) |
 | (4) |
In the present model, water diffusion was not separately accounted for. Furthermore, the water molecules were assumed to diffuse and occupy the void volume as the SA diffuses.
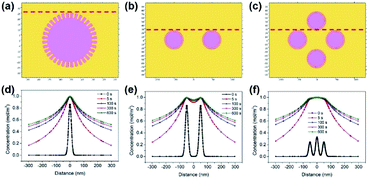
Three 2-D geometrical models were established to solve the Fick's law of diffusion of SA transportation from MSNs. The 2-D geometries of the model domains for one, two and four nanospheres are schematically shown in Fig. 9a–c. The geometry of the SA nanosphere was set as a circle (diameter: 50 nm) with 36 nanochannels (diameter: 3 nm) on the surface of the circle, which was a mesoporous sphere. The solution boundary layer was set as the infinity boundary. The initial concentration of the SA nanosphere was set as 1 mol m−1,3 and the diffusion coefficient was 1.2 × 10⁻¹⁴ m2 s−1. The SA concentration on the surface of the SA nanosphere was high at 0 s for the three models in Fig. 9d–f. SA was rapidly released to the solution at the early stage because of the high concentration gradient within 100 s. SA was slowly released near the area of the SA nanosphere because of the lower concentration gradient after 100 s. Furthermore, SA concentration slightly increased at the same location from 300 s to 600 s.
Fig. 10 shows the changes in SA concentration distributions at 0, 100, 300 and 600 s for comparison. The SA concentration range became wider in the four nanosphere model after 5 s as shown in Fig. 10b. The SA concentrations 300 nm away from the model centre after 300 s were 0.4875, 0.5793 and 0.6013 mol m−3 for the one nanosphere, two nanosphere and four nanosphere models, respectively (Fig. 10c). Moreover, SA concentrations respectively increased to 0.5206, 0.6104 and 0.6314 mol m−3 at 600 s in the corresponding models in Fig. 10d.
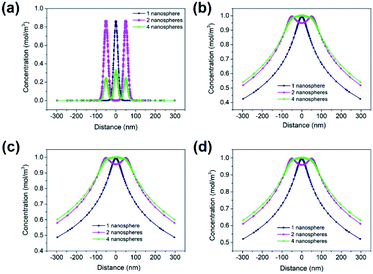 | ||
| Fig. 10 FEM calculated SA concentration distributions of one, two and four nanospheres for 0 (a), 100 (b), 300 (c) and 600 s (d), respectively. | ||
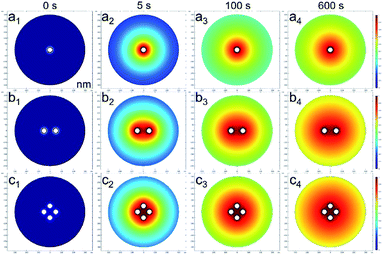
Fig. 11 shows the 2-D SA concentration distributions of the three models at 0, 5, 100 and 600 s. The results showed that a higher number of nanospheres had a higher SA concentration at the same location and releasing time. The SA distribution in the one nanosphere model at 0, 5, 100 and 600 s releasing time were remarkably different and indicated a fast SA releasing process. The differences in the SA concentration distributions of the two and four nanosphere models at the same releasing time were not great. The four nanosphere model had more SA contents than the other models and thus could offer a longer releasing effect to induce immunity effect.
Conclusions
A novel SA-loaded silicon dioxide nanosphere was synthesised in this work. The SA nanosphere exhibited a long release time and could gradually release SA to trigger enhanced inhibitive enzyme activity in diseased plants. SA can induce the expression of disease resistance- and defence-related enzymes in tobacco. Furthermore, the enzyme activities in tobacco leaves were also remarkably increased to improve its ability of tobacco plants to resist the expansion of Phytophthora and prevent infection. FEM showed that SA concentration sharply increased near the area of the nanospheres, and SA was slowly released to the solution. This SA nanosphere will have a great potential in future environmental-friendly practical application.Conflicts of interest
There are no conflicts to declare.Acknowledgements
This work was supported by Science Foundation for Young Scholars of the Tobacco Research Institute of the Chinese Academy of Agricultural Sciences (2018B04), Research and demonstration of key technologies for prevention and control of root and stem diseases in Yimeng tobacco area (201906) and Identification and Functional Analysis of Antibacterial Related Genes of Burkholderia pyrrocinia Lyc2 (ZR2018BC037).Notes and references
- T. Rongthong, S. Sungthongjeen, F. Siepmann, J. Siepmann and T. Pongjanyakul, Eudragit RL-based film coatings: How to minimize sticking and adjust drug release using MAS, Eur. J. Pharm. Biopharm., 2020, 148, 126–133 CrossRef CAS PubMed.
- M. Yu, W. Yuan, D. Li, A. Schwendeman and S. P. Schwendeman, Predicting drug release kinetics from nanocarriers inside dialysis bags, J. Controlled Release, 2019, 315, 23–30 CrossRef CAS PubMed.
- N. Kahya, A. Gölcü and F. B. Erim, Barium ion cross-linked alginate-carboxymethyl cellulose composites for controlled release of anticancer drug methotrexate, J. Drug Delivery Sci. Technol., 2019, 54, 101324 CrossRef CAS.
- E. Abdullayev, R. Price, D. Shchukin and Y. Lvov, Halloysite tubes as nanocontainers for anticorrosion coating with benzotriazole, ACS Appl. Mater. Interfaces, 2009, 1(7), 1437–1443 CrossRef CAS PubMed.
- E. Abdullayev, V. Abbasov, A. Tursunbayeva, V. Portnov, H. Ibrahimov, G. Mukhtarova and Y. Lvov, Self-healing coatings based on halloysite clay polymer composites for protection of copper alloys, ACS Appl. Mater. Interfaces, 2013, 5(10), 4464–4471 CrossRef CAS PubMed.
- J. Tedim, S. K. Poznyak, A. Kuznetsova, D. Raps, T. Hack, M. L. Zheludkevich and M. G. Ferreira, Enhancement of active corrosion protection via combination of inhibitor-loaded nanocontainers, ACS Appl. Mater. Interfaces, 2010, 2(5), 1528–1535 CrossRef CAS PubMed.
- Z. Cao, W. Li, R. Liu, X. Li, H. Li, L. Liu, Y. Chen, C. Lv and Y. Liu, pH- and enzyme-triggered drug release as an important process in the design of anti-tumor drug delivery systems, Biomed. Pharmacother., 2019, 118, 109340 CrossRef CAS PubMed.
- H. Luo, Y. Zhang, Z. Yang, G. Zuo, Q. Zhang, F. Yao and Y. Wan, Encapsulating doxorubicin-intercalated lamellar nanohydroxyapatite into PLGA nanofibers for sustained drug release, Curr. Appl. Phys., 2019, 19(11), 1204–1210 CrossRef.
- Q. Bao, Y. Zou, Y. Wang, D. Kozak, S. Choi and D. J. Burgess, Drug release testing of long-acting intrauterine systems, J. Controlled Release, 2019, 316, 349–358 CrossRef CAS PubMed.
- Y. Wang, Y. Yan, J. Cui, L. Hosta-Rigau, J. K. Heath, E. C. Nice and F. Caruso, Encapsulation of Water-Insoluble Drugs in Polymer Capsules Prepared Using Mesoporous Silica Templates for Intracellular Drug Delivery, Adv. Mater., 2010, 22(38), 4293–4297 CrossRef CAS PubMed.
- Y. Chen, Y. Gao, H. Chen, D. Zeng, Y. Li, Y. Zheng, F. Li, X. Ji, X. Wang, F. Chen, Q. He, L. Zhang and J. Shi, Engineering Inorganic Nanoemulsions/Nanoliposomes by Fluoride-Silica Chemistry for Efficient Delivery/Co-Delivery of Hydrophobic Agents, Adv. Funct. Mater., 2012, 22(8), 1586–1597 CrossRef CAS.
- C. Adhikari, A. Mishra, D. Nayak and A. Chakraborty, Drug delivery system composed of mesoporous silica and hollow mesoporous silica nanospheres for chemotherapeutic drug delivery, J. Drug Delivery Sci. Technol., 2018, 45, 303–314 CrossRef CAS.
- E. Juère and F. Kleitz, On the nanopore confinement of therapeutic drugs into mesoporous silica materials and its implications, Microporous Mesoporous Mater., 2018, 270, 109–119 CrossRef.
- V. Mamaeva, C. Sahlgren and M. Lindén, Mesoporous silica nanoparticles in medicine—Recent advances, Adv. Drug Delivery Rev., 2013, 65(5), 689–702 CrossRef CAS PubMed.
- W. Wang, H. Wang, J. Zhao, X. Wang, C. Xiong, L. Song, R. Ding, P. Han and W. Li, Self-healing performance and corrosion resistance of graphene oxide–mesoporous silicon layer–nanosphere structure coating under marine alternating hydrostatic pressure, Chem. Eng. J., 2019, 361, 792–804 CrossRef CAS.
- X. Song, H. Guo, Y. Liu, F. Wan, J. Zhang and X. Chang, Effects of salicylic acid and sucrose on pigment content in Pistacia chinensis leaves, Sci. Hortic., 2020, 259, 108783 CrossRef CAS.
- Shasmita, D. Mohapatra, P. K. Mohapatra, S. K. Naik and A. K. Mukherjee, Priming with salicylic acid induces defense against bacterial blight disease by modulating rice plant photosystem II and antioxidant enzymes activity, Physiol. Mol. Plant Pathol., 2019, 108, 101427 CrossRef CAS.
- K. Narasimhamurthy, K. Soumya, A. C. Udayashankar, C. Srinivas and S. R. Niranjana, Elicitation of innate immunity in tomato by salicylic acid and Amomum nilgiricum against Ralstonia solanacearum, Biocatal. Agric. Biotechnol., 2019, 22, 101414 CrossRef.
- B. Demirdirek and K. E. Uhrich, Novel salicylic acid-based chemically crosslinked pH-sensitive hydrogels as potential drug delivery systems, Int. J. Pharm., 2017, 528(1), 406–415 CrossRef CAS PubMed.
- X. Zhang, K. Tang and X. Zheng, Electrospinning and Crosslinking of COL/PVA Nanofiber-microsphere Containing Salicylic Acid for Drug Delivery, J. Bionic. Eng., 2016, 13(1), 143–149 CrossRef.
- R. Markam, J. Bajpai and A. K. Bajpai, Synthesis of ginger derived nanocarriers (GDNC) and study of in vitro release of 5-amino salicylic acid (5-ASA) as an anti inflammatory drug, J. Drug Delivery Sci. Technol., 2019, 50, 355–364 CrossRef CAS.
- X. Ma, L. Xu, W. Wang, Z. Lin and X. Li, Synthesis and characterisation of composite nanoparticles of mesoporous silica loaded with inhibitor for corrosion protection of Cu-Zn alloy, Corros. Sci., 2017, 120, 139–147 CrossRef CAS.
- I. M. Khan, K. Alam, M. Afshan, S. Shakya and M. Islam, Thermodynamic and structural studies of newly prepared CT complex between pyrazole as a donor and salicylic acid as acceptor at various temperatures in ethanol, J. Mol. Struct., 2020, 1206, 127758 CrossRef.
- A. Jouyban, V. Panahi-Azar and F. Khonsari, Solubility of salicylic acid in ethanol, propylene glycol, and N-methyl-2-pyrrolidone at various temperatures and their binary mixtures at 298.2K, J. Mol. Liq., 2011, 160(1), 14–16 CrossRef CAS.
- R. Schmidt, E. W. Hansen, M. Stoecker, D. Akporiaye and O. H. Ellestad, Pore Size Determination of MCM-51 Mesoporous Materials by means of 1H NMR Spectroscopy, N2 adsorption, and HREM. A Preliminary Study, J. Am. Chem. Soc., 1995, 117(14), 4049–4056 CrossRef CAS.
- J. R. Karra and K. S. Walton, Molecular Simulations and Experimental Studies of CO2, CO, and N2 Adsorption in Metal−Organic Frameworks, J. Phys. Chem. C, 2010, 114(37), 15735–15740 CrossRef CAS.
- K. Möller, J. Kobler and T. Bein, Colloidal Suspensions of Nanometer-Sized Mesoporous Silica, Adv. Funct. Mater., 2007, 17(4), 605–612 CrossRef.
- D. Zhao, J. Feng, Q. Huo, N. Melosh, G. H. Fredrickson, B. F. Chmelka and G. D. Stucky, Triblock Copolymer Syntheses of Mesoporous Silica with Periodic 50 to 300 Angstrom Pores, Science, 1998, 279(5350), 548–552 CrossRef CAS PubMed.
- M. Mohammadi, R. Roohparvar and M. Torabi, Induced chitinase activity in resistant wheat leaves inoculated with an incompatible race of Puccinia striiformis f. sp. tritici, the causal agent of yellow rust disease, Mycopathologia, 2002, 154(3), 119–126 CrossRef CAS PubMed.
- N. H. Bhuiyan, G. Selvaraj, Y. Wei and J. King, Gene expression profiling and silencing reveal that monolignol biosynthesis plays a critical role in penetration defence in wheat against powdery mildew invasion, J. Exp. Bot., 2009, 60(2), 509–521 CrossRef CAS PubMed.
| This journal is © The Royal Society of Chemistry 2020 |


