 Open Access Article
SnO–Sn3O4 heterostructural gas sensor with high response and selectivity to parts-per-billion-level NO2 at low operating temperature†
Wenwen Zeng a,
Yingzhi Liua,
Guoliang Chena,
Haoran Zhan*a,
Jun Mei*a,
Nan Luoa,
Zhoukun He
 b and
Changyu Tang
 a
a
aChengdu Green Energy and Green Manufacturing Technology R&D Center, Chengdu Development Center of Science and Technology, China Academy of Engineering Physics, Chengdu, 610200, China. E-mail: zhanhenry20@gmail.com; meijun12@126.com
bInstitute for Advanced Study, Chengdu University, Chengdu, 610106, China
First published on 12th August 2020
Abstract
Considering the harmfulness of nitrogen dioxide (NO2), it is important to develop NO2 sensors with high responses and low limits of detection. In this study, we synthesize a novel SnO–Sn3O4 heterostructure through a one-step solvothermal method, which is used for the first time as an NO2 sensor. The material exhibits three-dimensional flower-like microparticles assembled by two-dimensional nanosheets, in situ-formed SnO–Sn3O4 heterostructures, and large specific surface area. Gas sensing measurements show that the responses of the SnO–Sn3O4 heterostructure to 500 ppb NO2 are as high as 657.4 and 63.4 while its limits of detection are as low as 2.5 and 10 parts per billion at 75 °C and ambient temperature, respectively. In addition, the SnO–Sn3O4 heterostructure has an excellent selectivity to NO2, even if exposed to mixture gases containing interferential part with high concentration. The superior sensing properties can be attributed to the in situ formation of SnO–Sn3O4 p–n heterojunctions and large specific surface area. Therefore, the SnO–Sn3O4 heterostructure having excellent NO2 sensing performances is very promising for applications as an NO2 sensor or alarm operated at a low operating temperature.
1. Introduction
Nitrogen dioxide (NO2) is one of the most harmful air pollutants, which can cause the formation of acid rain, photochemical smog, and ozone in the atmosphere. It can also cause chronic bronchitis, emphysema, and respiratory irritation even at a small concentration.1–3 The annual, daily, and hourly safe concentrations of NO2 are approximately 21.2, 42.4, and 106.0 parts per billion (ppb), respectively, according to the Chinese ambient air quality standard (GB3095-2012). Therefore, it is important to develop NO2 sensors with high sensitivities and low limits of detection for environment and human health protection.Metal oxide sensors are widely used for gas sensing owing to their high sensitivities, low costs, simple fabrications, and long-term stabilities.4 Various NO2 sensors have been developed based on different metal oxides, such as WO3, ZnO, In2O3, NiO, and SnO2.5–8 Among these metal oxides, SnO2 is one of the most investigated materials owing to its excellent thermal and chemical stabilities,9 and thus has been used for the detection of different gases with various morphological or chemical modifications.10–17 SnO2 is a wide-band-gap (∼3.6 eV) n-type semiconductor with an oxidation state of +4. In addition to SnO2, tin oxides with other oxygen stoichiometries, such as SnO, Sn2O3,18 Sn3O4,19 and Sn5O6,20 exist. Among these tin oxides, SnO and Sn3O4 have also been used as gas sensing materials.21–24 Suman compared the NO2 sensing properties of SnO2, SnO, and Sn3O4 nanobelts synthesized by carbothermal reduction. The Sn3O4 and SnO nanobelts exhibited better responses to NO2 than that of SnO2, which could be attributed to lone pairs on the surfaces of Sn3O4 and SnO, providing more active sites for NO2.9
The formation of a p–n heterostructure is an effective method to improve the gas sensing capabilities of metal oxide gas sensors. The p–n heterostructures can adjust the electronic and chemical properties through chemical bonding and charge transfer at the interface and thus improve the gas sensing performance.25,26 Numerous studies have been reported on improvements in gas sensing properties by the formation of p–n heterostructures including CuO–SnO2,27 CuO–In2O3,28 CuO–ZnO,29 Cr2O3–SnO2,30 and NiO–SnO2.31 Owing to the differences in semiconductor type and bandwidth of tin oxides, they can form p–n heterojunctions and increase the gas sensing performances. Li fabricated a SnO2–SnO nanostructure with a p–n heterojunction through a simple hydrothermal process.32 The SnO2–SnO composite exhibited an increased sensing performance for NO2 detection with a low limit of detection, low operating temperature (50 °C), and high sensing selectivity. Yu fabricated a SnO–SnO2 p–n heterostructure by simple hydrothermal and annealing processes.33 The p–n heterostructural sensor exhibited excellent performances for NO2 sensing at room temperature including a fast response, high sensitivity, and low limit of detection with a stable and repeatable response pattern. Shanmugasundaram synthesized SnO–SnO2 composites with in situ p–n heterojunctions by a simple hydrothermal method.34 The sensor response, selectivity, and sensitivity to H2 were improved by the heterostructure and its optimal operating temperature was considerably lower than that of pure SnO2. In these studies, the p–n heterojunctions played important roles in the sensing performance improvements. The p–n heterojunction formed at the SnO–SnO2 interface narrowed the forbidden band, promoting the transition of electrons, which contributed to the enhancement in gas sensing performance. Although the SnO–SnO2 p–n heterostructure had good NO2 sensing performances at low temperatures, the response was not sufficiently high, which hinders its use for the detection of a low concentration of NO2.
Sn3O4 is an n-type semiconductor with a band gap of 2.2–2.9 eV,21 narrower than that of SnO2. If Sn3O4 is used to replace SnO2 to form a SnO–Sn3O4 heterostructure, the forbidden band will be further narrowed and the transition of electrons will be further enhanced, which will improve the NO2 sensing performance. Furthermore, the lone pair electrons on the surface of Sn3O4 help the adsorption of NO2 and enhance the response. Zeng used Sn3O4 modified hierarchical SnO2, the electron injection from Sn3O4 to SnO2 played an important role in the improvement of NO2 sensing performance.35 Therefore, the SnO–Sn3O4 heterostructure is likely to exhibit an outstanding NO2 sensing performance.
In this study, we synthesized a novel SnO–Sn3O4 heterostructure through a simple one-step solvothermal method and for the first time evaluated its use as an NO2 sensor. Its micromorphology, crystal structure, and chemical composition were characterized by scanning electron microscopy (SEM), transmission electron microscopy (TEM), atomic and electrostatic force microscopy (AFM and EFM), X-ray diffraction (XRD), and X-ray photoelectron spectroscopy (XPS). Furthermore, its gas sensing performances for NO2 and other contrast gases were investigated. The SnO–Sn3O4 heterostructure exhibited excellent responses to a ppb level of NO2 at its optimal operating temperature of 75 °C and ambient temperature. Moreover, the limits of detection of the SnO–Sn3O4 heterostructure were as low as 2.5 and 10 ppb at 75 °C and ambient temperature, respectively. In addition, the SnO–Sn3O4 heterostructure exhibited an excellent selectivity to NO2, even if in a mixture with interferential gases in high concentration. The possible sensing mechanism is discussed. The main factors for the enhancements were attributed to the formation of p–n heterojunctions and large specific surface area of the material.
2. Experiments
2.1 Material synthesis
All chemicals used in this study were of analytical grade and used as received without further purification. Stannous chloride dihydrate (SnCl2·2H2O) was purchased from Aladdin Regent Co., Ltd., while urea (CO(NH2)2), sodium hydroxide (NaOH), and absolute ethyl alcohol (C2H5OH) were purchased from Kelon Chemical.The SnO–Sn3O4 heterostructure was synthesized by a simple solvothermal process. In a typical synthesis procedure, 1.536 g of NaOH, 1.280 g of urea, and 0.723 g of SnCl2·2H2O were sequentially added to a mixture solvent consisting of 25 mL of absolute ethyl alcohol and 55 mL of deionized water under moderate stirring. After the stirring for 3 h, the solution was transferred into a 100 mL teflon-lined stainless-steel autoclave and the solvothermal process was performed at 180 °C for 18 h. The precipitates were collected and consecutively washed six times by deionized water and absolute ethyl alcohol by centrifugation (10![[thin space (1/6-em)]](https://www.rsc.org/images/entities/char_2009.gif) 000 rpm). The collected product was dried at 60 °C for 10 h in a drying oven to obtain the as-prepared sample. To evaluate the influence of the composition on the sensing performance, as-prepared samples were calcined at 550 and 700 °C under ambient atmosphere for 2 h, yielding two other samples.
000 rpm). The collected product was dried at 60 °C for 10 h in a drying oven to obtain the as-prepared sample. To evaluate the influence of the composition on the sensing performance, as-prepared samples were calcined at 550 and 700 °C under ambient atmosphere for 2 h, yielding two other samples.
2.2 Characterization
The composition and crystalline structure of the sample were characterized by powder XRD using a Bruker D2 Phaser in the 2θ range of 10–80° with Cu Kα irradiation at 30 kV. XPS was performed using an ESCALA B250Xi spectrometer with a monochromatic Al excitation source. Its morphology was observed using field-emission SEM (Hitachi S5200) at an accelerating voltage of 5 kV. High-resolution (HR) morphology images and selected-area electron diffraction (SAED) patterns were acquired by using TEM (FEI Tecnai G2 F20) at an accelerating voltage of 200 kV. More detailed information of phase distribution was obtained through atomic and electrostatic force microscopy (AFM and EFM) measurements by using a MFP-3D-SA microscopy. The Brunauer–Emmett–Teller (BET) specific surface areas and pore size distributions of the samples were measured using an Autosorb-IQ2 analyzer. Ultraviolet (UV)-visible spectra were acquired using an SP-756 analyzer.2.3 Fabrication and evaluation of the gas sensor
A spot of the prepared sample was mixed with a drop of deionized water using a mortar to form a homogeneous paste. The paste was uniformly coated on top of a gas sensor component, and then assembled into a gas sensor (Fig. S1†). The thickness of the sensing film was about 10–15 μm. Before the evaluation, the gas sensors were aged for 10 days at approximately 150 °C (heating current of 70 mA, heating resistance of 53 ± 5 Ω at ambient temperature). SnO was reported to be stable below 370 °C,36 so the aging process would not change the phase of sensing materials. After the aging, the gas sensing performances of the sensor were evaluated using a CGS-8 intelligent gas sensing analysis system (Beijing Elite Co., Ltd., China) under laboratory conditions (approximately 25 ± 3 °C, relative humidity in the range of 50% to 60%). Static sensing test was used to evaluate the sensing performance of the sensors by injecting a certain volume of 5000 ppm standard NO2 into a gas sensor chamber whose volume was 1 L. The operating temperature of the sensor was controlled by adjusting the heating current. The measurement circuit used in the experiments is shown in Fig. S2.† The response (R) of the gas sensor was defined as the ratio of the sensor resistance in the gas (Rg) to that in the air (Ra) for oxidizing gases (R = Rg/Ra), such as NO2, and inversely for reductive gases (R = Ra/Rg), such as volatile organic compounds (VOCs). The response and recovery times (tres and trec) were defined as the times to achieve 90% of the total resistance changes in the response and recovery, respectively.3. Results and discussion
3.1 X-ray diffraction (XRD) patterns
The compositions and crystalline structures of the samples were characterized by XRD, as shown in Fig. 1. The as-prepared sample was composed of SnO (Joint Committee on Powder Diffraction Standards (JCPDS) no. 06-0395, marked by ●) and Sn3O4 (JCPDS no. 16-0737, marked by ◆). The (002) and (001) peaks of SnO are the first and second highest in the pattern, respectively, showing the dominant SnO phase in the sample. Compared with the standard diffraction pattern (JCPDS no. 06-0395), the (002) and (001) peaks of SnO in the pattern of the as-prepared sample are the two highest peaks, rather than the (101) and (110) peaks. This suggests that the formed SnO phase in the as-prepared sample is predominated by exposed (002) and (001) facets. The peaks of Sn3O4 are observed in the range of 26–34° (bottom inset in Fig. 1), but their intensities are considerably lower than those of SnO. The XRD results show the SnO–Sn3O4 composition of the as-prepared sample. After the calcination at 550 °C, the peaks of SnO are vanished and replaced by those of SnO2 (JCPDS no. 41-1445, marked by ■). This transition in the XRD pattern demonstrates the decomposition and oxidization of SnO into SnO2.19,37 Although the Sn3O4 peaks are decreased, they can still be distinguished, as shown in the top inset in Fig. 1. This shows the SnO2–Sn3O4 composition of the sample calcined at 550 °C. After the calcination at 700 °C, only the SnO2 peaks can be distinguished in the XRD pattern, showing that SnO and Sn3O4 entirely decomposed and oxidized into SnO2.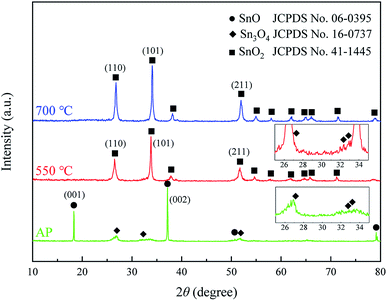 | ||
| Fig. 1 XRD patterns of the as-prepared sample (denoted as AP) and samples calcined at 550 and 700 °C. | ||
3.2 X-ray photoelectron spectroscopy (XPS)
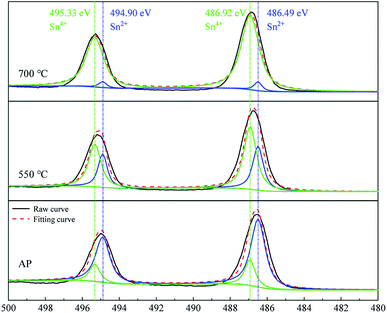
The chemical compositions and oxidation states of the samples were further characterized by XPS. Fig. S3† presents a full-scan X-ray photo electron spectrum of the as-prepared sample, showing the characteristic peaks of Sn, O, and C without other impurities. To understand the valence states of the tin element, the HR Sn 3d spectrum was analyzed, as shown in Fig. 2. The deconvolution of the spectrum yielded four Gaussian peaks. The fitted peaks at 495.33 and 486.92 eV correspond to the Sn4+ state, while those at 494.90 and 486.49 eV correspond to the Sn2+ state. For the as-prepared sample, the peak area of Sn2+ is larger than that of Sn4+, which demonstrates the domination of Sn2+ state. This is consistent with the XRD results, further confirming the phase composition of major SnO and minor Sn3O4. The ratio of the peak areas between Sn2+ and Sn4+ is 3.67, and the calculated mole ratio of SnO to Sn3O4 is 1.67 (a Sn3O4 unit cell contain two Sn2+ and one Sn4+ atoms38). After the calcination at 550 °C, the peaks are shifted to higher binding energies and those of Sn4+ are dominant. After the calcination at 700 °C, the peaks are further shifted to higher binding energies, which well match with the binding energies of Sn4+, while the peaks of Sn2+ are almost vanished. The XPS results of the Sn-related states obtained in this experiment demonstrate the transition of Sn2+ to Sn4+ during the calcination, consistent with the XRD results.3.3 Morphological evaluation
The morphologies of the samples were characterized by field-emission SEM, as shown in Fig. 3. Fig. 3(a) and (b) show field-emission SEM images of the as-prepared sample. The material is composed of microparticles with diameters of 2 to 4 μm. The microparticles consist of large numbers of two-dimensional nanosheets and have flower-like morphologies. The microparticles exhibit a two–three-dimensional (2–3D) hierarchical structure (i.e., the 2D nanosheets are assembled into 3D microparticles).39 After the calcinations at 550 and 700 °C, the morphologies maintain the 2–3D hierarchical structure and are similar with that of the sample obtained without calcination. This implies that the calcination has no considerable effect on the morphology.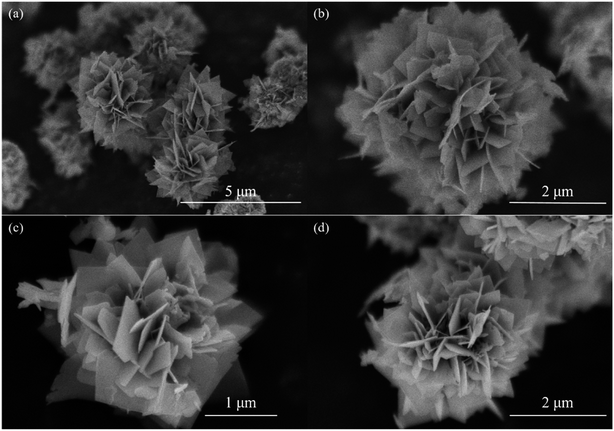 | ||
| Fig. 3 SEM images of (a) and (b) as-prepared sample; (c) sample calcined at 550 °C; (d) sample calcined at 700 °C. | ||
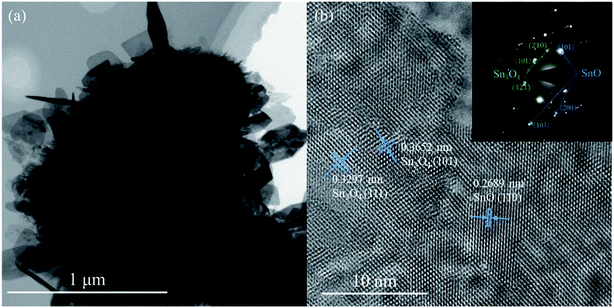
TEM and HRTEM images and SAED pattern were acquired to investigate the microstructure of the as-prepared sample, as shown in Fig. 4. In Fig. 4(a), the peripheral nanosheets can be distinguished; the thicknesses of the nanosheets are approximately 30 nm. The HRTEM image and SAED pattern in Fig. 4(b) show further structural information about the microparticles. In the HRTEM image, the lattice fringes with interplanar crystal spacings of 0.3652 and 0.3297 nm correspond to the (101) and (111) planes of the Sn3O4 structure (JCPDS no. 16-0737), respectively. Lattice fringes with an interplanar crystal spacing of 0.2689 nm corresponding to the (110) planes of the tetragonal SnO structure (JCPDS no. 06-0395) are also observed. These two different phases exist at one nanosheet together, and contact with each other, form heterojunctions on the nanosheets in situ. Therefore, the as-prepared sample exhibited a SnO–Sn3O4 heterostructure. The inset in Fig. 4(b) shows a SAED pattern of the as-prepared sample. SnO and Sn3O4 crystalline phases could be distinguished, confirming the SnO–Sn3O4 heterostructure of the material.
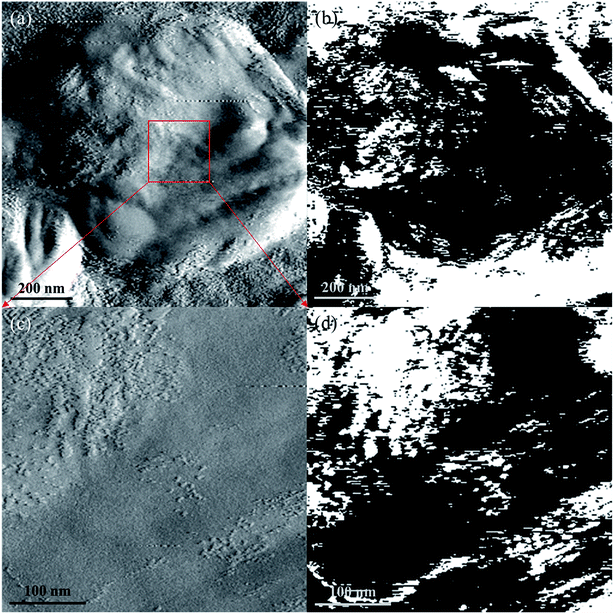
AFM measurement and EFM measurement with a bias voltage of 10 V were carried out to distinguish the different phases on the nanosheet more intuitively, the results are shown in Fig. 5. Before the measurement, the SnO–Sn3O4 composite was grinded and dispersed on ITO glass. It can be found that the ITO substrate is mostly white in EFM image (Fig. 5(b)) by comparing with corresponding AFM image (Fig. 5(a)), illustrating its electroconductibility. Whereas, the image of the nanosheet in Fig. 5(b) exhibits mostly black with a small part of white. This phenomenon is much more clear in the comparison of Fig. 5(c) and (d), and the white part in Fig. 5(d) correspond well to the projecting part in Fig. 5(c). This means the nanosheet contains major insulating phase and minor conductive phase. Considering the high resistance of SnO40,41 and the phase ratio indicated by XRD, the black and white part in EFM image may well be SnO and Sn3O4, respectively. This result further illustrates the distribution of SnO and Sn3O4 phase and the in situ formation of SnO–Sn3O4 heterojunctions.
3.4 Gas sensing performance
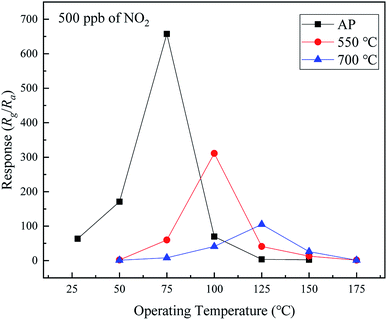
The operating temperature is an important parameter of metal oxide sensors. The responses of the samples to 500 ppb of NO2 as a function of the operating temperature in the range of ambient temperature to 175 °C were evaluated, as shown in Fig. 6. The response of each sample increases, reaching the maximum at a certain temperature, followed by decrease with the increase in the operating temperature. The samples exhibit different optimal operating temperatures corresponding to the highest responses (75, 100, and 125 °C for the as-prepared and 550 and 700 °C calcined samples, respectively). The highest responses of the samples are 657.4, 311.2, and 104.9, respectively. Therefore, the composition of the sample has a significant influence on its response to NO2. The response of the as-prepared sample (SnO–Sn3O4 heterostructure) is considerably higher than those of the two other samples. It is worth noting that the SnO–Sn3O4 heterostructure has a response of 63.4 at ambient temperature (28 °C), which is a relatively high value.To investigate the NO2 sensing performance of the SnO–Sn3O4 heterostructure, the responses as a function of the NO2 concentration at 75 °C and ambient temperature were evaluated, as shown in Fig. 7. As shown in Fig. 7(a), the response is high and increases with the NO2 concentration (416.6, 540.1, and 657.4 at 300, 400, and 500 ppb of NO2 at 75 °C, respectively). Owing to the very large resistance, the response to NO2 above 500 ppb was hard to gauge. The inset in Fig. 7(a) shows the response to NO2 in the range of 2.5 to 50 ppb. When the NO2 concentration is as low as 2.5 ppb, the response is still 1.23, which can be easily discerned (the resistance curve of this test is shown in Fig. S4†). This implies that the detection limit of the SnO–Sn3O4 heterostructure is as low as 2.5 ppb, which is a relatively low concentration. These results reveal the excellent NO2 sensing performance of the SnO–Sn3O4 heterostructure. Fig. 7(b) shows the responses at ambient temperature in the range of 50 to 500 ppb (31.1, 56.8, and 63.4 at 300, 400, and 500 ppb of NO2, respectively). The response to 10 ppb of NO2 at ambient temperature is 1.13, which implies that the limit of detection at ambient temperature is as low as 10 ppb. Comparison of the NO2 sensing performances of the SnO–Sn3O4 heterostructure analyzed in this study and those in previous studies is shown in Table 1. The SnO–Sn3O4 heterostructure exhibits a high response and low limit of detection of NO2. Therefore, the SnO–Sn3O4 heterostructure has an excellent NO2 sensing response and very low limit of detection, not only at its optimal operating temperature of 75 °C, but also at ambient temperature. The low operating temperature is advantageous for a low energy consumption and reduced tendency for ignition, which is favorable for an increase in the service lifetime.
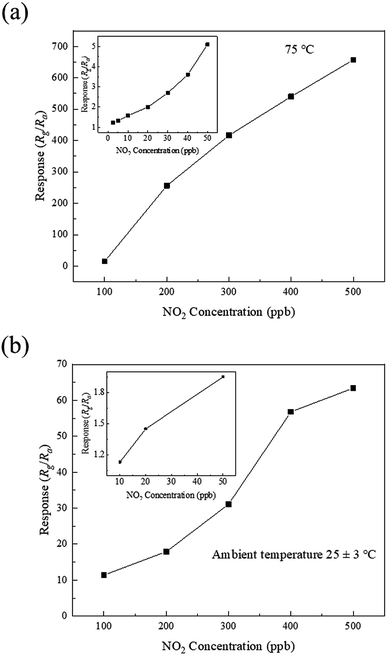 | ||
| Fig. 7 Responses of the SnO–Sn3O4 heterostructure as a function of the NO2 concentration at (a) 75 °C and (b) ambient temperature. | ||
| Material | Operating temperature | NO2 concentration | Response | Limit of detection | Reference |
|---|---|---|---|---|---|
| a RT: room temperature.b rGO: reduced graphene oxide. | |||||
| SnO–SnO2 | RTa | 1 ppm | 4.68 | 0.1 ppm | 33 |
| SnO2–SnO | 50 °C | 50 ppm | 8 | 0.1 ppm | 32 |
| SnO2–ZnO | RT UV-enhanced | 1 ppm | 2.4 | — | 42 |
| TeO2–SnO2 | RT | 3 ppm | 9.97 | — | 43 |
| WS2–carbon nanofibers | RT | 5 ppm | 20.5% | 10 ppb | 44 |
| α-Fe2O3/rGOb | RT | 5 ppm | 8.2 | 50 ppb | 45 |
| In2O3/rGO | RT | 30 ppm | 8.25 | — | 46 |
| Te nanotube | RT | 1 ppm | 30.5% | 0.5 ppb | 47 |
| LaFeO3 nanocube | RT | 1 ppm | 29.60 | — | 48 |
| rGO/SnO2 nanosheet | RT | 100 ppm | 2.87 | 1 ppm | 49 |
| SnO–Sn3O4 | RT | 500 ppb | 63.4 | 10 ppb | This study |
| 75 °C | 657.4 | 2.5 ppb | |||
The resistances of the SnO–Sn3O4 heterostructure upon exposure to NO2 in the range of 200 to 500 ppb at 75 °C and ambient temperature (28 °C) are shown in Fig. 8. The response (tres) and recovery (trec) times are also shown in Fig. 8. At its optimal operating temperature, the response and recovery times of the SnO–Sn3O4 heterostructure decrease with the increase in the NO2 concentration. At 500 ppb of NO2, the response and recovery times are 178 and 87 s, respectively. At ambient temperature, the response time decreases with the increase in the NO2 concentration and stabilizes around 2.5 min, which shows the quick response of the NO2 sensor operated at room temperature. Nevertheless, the recovery time is much more than 20 minutes, which is a common problem for the sensors running at ambient temperature.
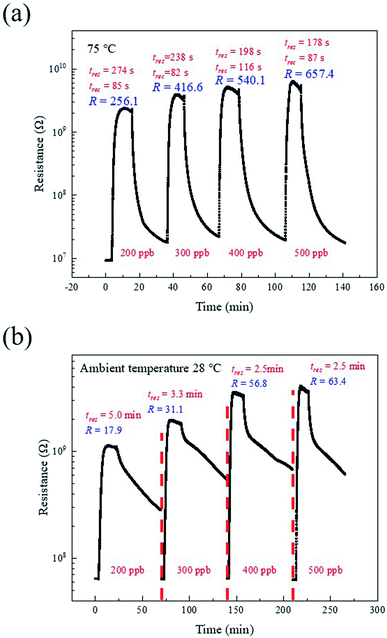 | ||
| Fig. 8 Actual resistance curves of the SnO–Sn3O4 heterostructure at (a) 75 °C and (b) ambient temperature (28 °C). | ||
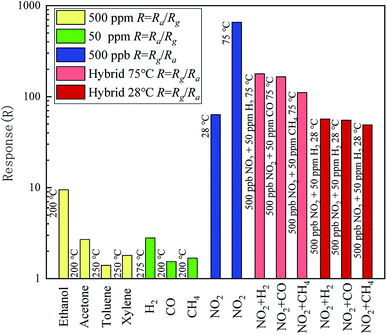
The selectivity is another important characteristic of metal oxide sensors. Comparison of the responses to NO2 and other contrast gases is shown in Fig. 9. The responses of the contrast gases were measured at corresponding optimal operating temperatures, which are shown at the left of relevant bar. All the optimal operating temperatures of contrastive gases are not less than 200 °C, much higher than that of NO2. The concentrations of the used VOCs were 500 ppm, while those of the other reductive gases (H2, CO, and CH4) were 50 ppm. The concentrations of all contrast gases were considerably higher than that of NO2. Nevertheless, the response of the SnO–Sn3O4 heterostructure to NO2 is hundreds or tens of times larger. What the most noteworthy is, when exposed to mixed gases consist of 500 ppb NO2 and 50 ppm H2, CO and CH4 at 75 °C, the responses are still as high as 178.1, 165.1 and 110.9, respectively. Furthermore, when exposed to mixed gases at 28 °C, the responses of the sensor decrease just slightly compared with pure NO2, illustrating that these reductive gases almost have no interference on NO2 sensing at ambient temperature. These results demonstrate the excellent selectivity of the SnO–Sn3O4 heterostructure to NO2, even if exposed to mixture gases containing interferential part in high concentration.
The short-term and long-term stability of the SnO–Sn3O4 heterostructure were also been tested, as shown in Fig. 10. Fig. 10(a) and (b) illustrate the resistance curve of the sensor by repetitive exposing to 100 ppb of NO2 five times at 75 and 25 °C, respectively. It is clearly that all of the five resistance tracks in both figures are similar and have almost the same peak value, revealing the good reversibility of the sensor. The continuous measurement of the response of the SnO–Sn3O4 heterostructure to 500 ppb of NO2 at 75 °C and ambient temperature for about 30 days were investigated and the results are shown in Fig. 10(c). Both of the deviations of the responses at two different work temperature are less than 5%, exhibiting good long-term stability. These experiments demonstrate the SnO–Sn3O4 heterostructure possesses good repeatability and stability.
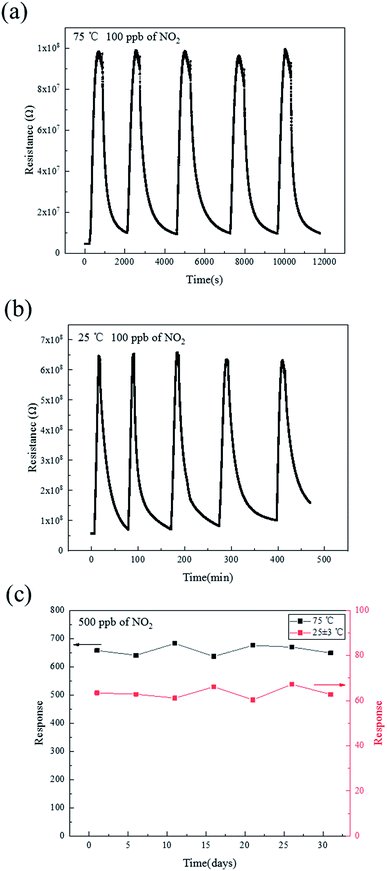 | ||
| Fig. 10 Repeatability curve of SnO–Sn3O4 heterostructure at (a) 75 °C and (b) 25 °C; (c) long-term stability of SnO–Sn3O4 heterostructure at 75 °C and ambient temperature. | ||
This systematic analysis demonstrates the excellent NO2 sensing performances of the SnO–Sn3O4 heterostructure including very high response, low limits of detection, and excellent selectivity to a ppb level of NO2 at 75 °C and ambient temperature. Therefore, the SnO–Sn3O4 heterostructure is very promising as an NO2 sensor or alarm operated at a low or ambient temperature.
3.5 Sensing mechanism
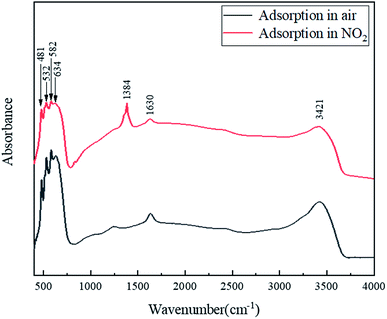
The gas sensing mechanism of SnO–Sn3O4 heterostructure can be explained by common adsorption–oxidation–desorption pathway. When the SnO–Sn3O4 heterostructure is exposed to clean air, O2 molecules adsorb on the surface by extracting electrons from the conduction band and form oxygen anions (mainly O2− at a low temperature50), yielding an electron depletion layer on the surface. The width of the depletion layer does not change after the adsorption of O2 is saturated.51 Once the sensor is exposed to NO2 gas, NO2 molecules adsorb on the surface by extracting electrons from the conduction bands or interacting with the chemisorbed oxygen on the surface.33,52 To figure out the truly reactions, FTIR was used to distinguish the adsorbate on SnO–Sn3O4 heterostructure after the reaction of adsorbing NO2, the results are shown in Fig. 11.This figure shows the FTIR spectra of SnO–Sn3O4 in air and atmosphere of 1% NO2 at room temperature. Both of these two curve have band at 1630 and 3421 cm−1, which can be assigned to H2O in the sample. Also both of them have four peaks at 481, 532, 582 and 634 cm−1, which can be ascribed to Sn–O vibration.53,54 After adsorption in 1% NO2, a peak around 1384 cm−1 appears, which can be assigned to adsorbed NO2.55 According to previous research,56 this peak is most likely to be NO3−. So the product of NO2 adsorption on SnO–Sn3O4 at room temperature should be NO3− here. The reaction equation should be45,57
| 2NO2 (gas) + O2− (ads) + e− → 2NO3− (ads) | (1) |
This result proves that the product of NO2 adsorbing, at least at room temperature, is NO3−. This reaction consumes large numbers of electrons and increase the thickness of the depletion layer, thus increasing the potential barrier together with the sensor resistance. When the sensor is exposed to clean air again, NO2 molecules desorb from the surface and release the captured electrons back to the material, leading to the recovery of the sensor resistance.
The SnO–Sn3O4 heterostructure exhibited a very high response at relatively low operating temperature, which might be attributed to the following factors. Firstly, the formation of p–n heterojunctions at the SnO and Sn3O4 interfaces could be the primary factor contributing to the high response and low operating temperature. A plot of (αhν)1/2 against the photon energy (hν) for the SnO–Sn3O4 heterostructure and its energy structure schematic diagram are shown in Fig. 12(a) and (b), respectively. The formation of the heterojunction leads to bending of the forbidden bands to equilibrate the Fermi level (EF) between the SnO and Sn3O4 band gaps, the electrons will transfer from n-type Sn3O4 to p-type SnO according to their work functions (5.1 eV for SnO58 and 3.9 eV for Sn3O4 (ref. 59)), as shown in Fig. 12(b). Generally, a narrower forbidden band implies a lower energy required for the transition of electrons.32 Compared with SnO2 (typically 3.6 eV) in SnO–SnO2 (ref. 32 and 33) composite, Sn3O4 in (2.12 eV in this study) SnO–Sn3O4 heterostructure exhibited a considerably smaller band width. Therefore, the electrons could easily transfer from the forbidden band to the conduction band at a low operating temperature and participate in the gas sensing reaction. The in situ formation of the SnO–Sn3O4 heterojunctions is conducive to increase the interfacial area and further enhance the effect of the heterojunctions. Furthermore, the formation of SnO–Sn3O4 heterojunctions lead to the transfer of electrons from n-type Sn3O4 to p-type SnO, and generate depletion layer at the interface of two phases. This depletion layer will coexist with the depletion layer formed by the adsorption of gases (O2 and NO2 here), and change simultaneously with the other one when the adsorbed state changes. This process facilitates the detection of NO2 through the change in the electrical conductivity of the material.45,60
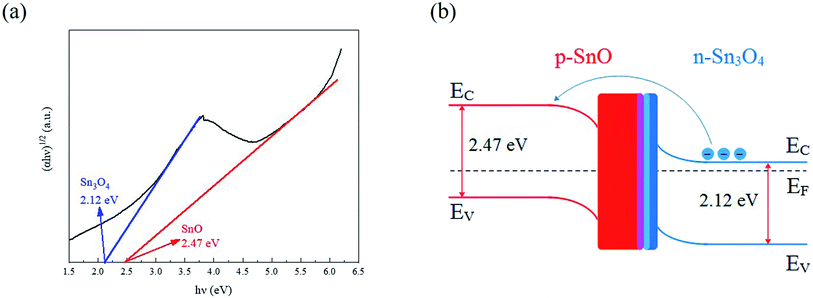 | ||
| Fig. 12 (a) Plots of (αhν)1/2 against the photon energy (hν) for the SnO–Sn3O4 heterostructure. (b) Schematic of the energy structure of the SnO–Sn3O4 heterostructure. | ||
Secondly, the morphology of the material contributes to the performance enhancement. The N2 adsorption–desorption isotherm of the SnO–Sn3O4 heterostructure and corresponding pore size distribution are shown in Fig. S5.† The calculated BET surface area of the sample is 43.86 m2 g−1, while the average pore diameter is 32.31 nm. The mesoporous structure and large specific surface area enhance the diffusion and absorption of NO2 molecules on the surface, thus improving the sensing performance.
The excellent selectivity of SnO–Sn3O4 heterostructure to NO2 can be attributed to the reasons as follows. As discussed above, the formation of p–n heterojunctions and the large specific surface area make SnO–Sn3O4 heterostructure exhibit high response to NO2 at low operating temperature. When the operating temperature increase beyond 75 °C, its response to NO2 decrease because of the desorption of NO2 molecules induced by high temperature. But for reductive gases (such as H2 and ethanol), their main sensing mechanism on metal oxide sensors are reacting with adsorbed oxygen ions, for example,
| H2 + O− → H2O + e− | (2) |
| C2H5OH + 6O− → 2CO2 + 3H2O + 6e− | (3) |
These reactions will return the electrons to the material and lead to the reduction of resistance, which is an opposite change compared with oxidizing gases. In these reactions, high temperature (higher than 200 °C in general, also this is the reason why “O−” instead of “O2−” appears in eqn (2) and (3)) is a requirement. Nevertheless, the number of adsorbed oxygen anions on SnO–Sn3O4 heterostructure are significant reduced because of the desorption induced by high temperature when the operating temperature exceeding 75 °C. So the sensing reactions between reductive gases and oxygen anions are inactive, leading to the low response to reductive gases. When SnO–Sn3O4 heterostructure is exposed to mixed gases of NO2 and reductive gases at 75 °C, although the concentrations of reductive gases are much higher, they can barely react with NO2 molecules at this temperature, only the high concentration influences the adsorption of NO2 molecules. Therefore, the resistances of the sensors still increase and the responses are still high when exposed to mixed gases, exhibiting excellent selectivity to NO2.
4. Conclusion
The SnO–Sn3O4-heterostructure-based material was fabricated and used as an NO2 sensor. The morphology, structure, and composition characterizations revealed its 3D flower-like microparticles structure assembled by 2D nanosheets, in situ-formed SnO–Sn3O4 heterostructure, and large specific surface area. The gas sensing measurements showed the excellent NO2 sensing performance of the SnO–Sn3O4 heterostructure. Its responses were as high as 657.4 and 63.4 to 500 ppb of NO2 while its limits of detection were as low as 2.5 and 10 ppb at 75 °C and ambient temperature, respectively. In addition, the SnO–Sn3O4 heterostructure exhibited an excellent selectively to NO2, even if exposed to mixture gases containing interferential part with high concentration. The high performances were attributed to the in situ formation of SnO–Sn3O4 p–n heterojunctions and large specific surface area. The SnO–Sn3O4 heterostructure having the excellent NO2 sensing performance is promising for applications as an NO2 sensor or alarm operated at a low operating temperature.Conflicts of interest
There are no conflicts to declare.Acknowledgements
The authors would like to acknowledge the financial support from the Sichuan Science and Technology Program (no. 2017SZ0171 and 2019YJ0658) and the National Natural Science Foundation of China (no. 21504106 and 51873240).References
- H. Long, A. Harley-Trochimczyk, T. Pham, Z. Tang, T. Shi and A. Zettl, et al., High Surface area MoS2/graphene hybrid aerogel for ultrasensitive NO2 detection, Adv. Funct. Mater., 2016, 26, 5158–5165 CrossRef CAS.
- WHO Regional Office for Europe, Health aspects of air pollution with particulate matter, ozone and nitrogen dioxide: report on a WHO working group, Bonn, January 2003 Search PubMed.
- M. W. G. Hoffmann, J. D. Prades, L. Mayrhofer, F. Hernandez-Ramirez, T. T. Järvi, M. Moseler, A. Waag and H. Shen, Highly selective SAM–nanowire hybrid NO2 sensor: insight into charge transfer dynamics and alignment of frontier molecular orbitals, Adv. Funct. Mater., 2014, 24, 595–602 CrossRef CAS.
- N. Barsan, D. Koziej and U. Weimar, Metal oxide-based gas sensor research: How to?, Sens. Actuators, B, 2007, 121, 18–35 CrossRef CAS.
- G. Li, X. Wang, L. Liu, R. Liu, F. Shen and Z. Cui, et al., Controllable Synthesis of 3D Ni(OH)2 and NiO Nanowalls on Various Substrates for High-Performance Nanosensors, Small, 2015, 11, 731–739 CrossRef CAS PubMed.
- R. D. Bhusari, N. S. Ramgir, K. M. Avhad, R. Jishita, R. Navneethan, A. K. Debnath, et al., Development of NO2 sensor based on Ti modified ZnO nanowires, International Conference on Sensing, 2017, pp. 229–233 Search PubMed.
- T. Kida, A. Nishiyama, M. Yuasa, K. Shimanoe and N. Yamazoe, Highly sensitive NO2 sensors using lamellar-structured WO3 particles prepared by an acidification method, Sens. Actuators, B, 2009, 135, 568–574 CrossRef CAS.
- D. Zhang, Z. Liu, C. Li, T. Tang, X. Liu and S. Han, et al., Detection of NO2 Down to ppb Levels Using Individual and Multiple In2O3 Nanowire Devices, Nano Lett., 2012, 4, 1919–1924 CrossRef.
- P. H. Suman, A. A. Felix, H. L. Tuller, J. A. Varela and M. O. Orlandi, Comparative gas sensor response of SnO2, SnO and Sn3O4 nanobelts to NO2 and potential interferents, Sens. Actuators, B, 2015, 208, 122–127 CrossRef CAS.
- J. Zhang, S. Wang, Y. Wang, Y. Wang, B. Zhu and H. Xia, et al., NO2 sensing performance of SnO2 hollow-sphere sensor, Sens. Actuators, B, 2009, 135, 610–617 CrossRef CAS.
- C. Gu, X. Xu, J. Huang, W. Wang, Y. Sun and J. Liu, Porous flower-like SnO2 nanostructures as sensitive gas sensors for volatile organic compounds detection, Sens. Actuators, B, 2012, 174, 31–38 CrossRef CAS.
- S. Maeng, S. W. Kim, D. H. Lee, S. E. Moon, K. C. Kim and A. Maiti, SnO2 nanoslab as NO2 sensor: identification of the NO2 sensing mechanism on a SnO2 surface, ACS Appl. Mater. Interfaces, 2014, 6, 357–363 CrossRef CAS PubMed.
- Q. Wang, X. Kou, C. Liu, L. Zhao, T. Lin and F. Liu, et al., Hydrothermal synthesis of hierarchical CoO/SnO2 nanostructures for ethanol gas sensor, J. Colloid Interface Sci., 2017, 513, 760–766 CrossRef PubMed.
- Z. Zhang, M. Xu, L. Liu, X. Ruan, J. Yan and W. Zhao, et al., Novel SnO2@ZnO hierarchical nanostructures for highly sensitive and selective NO2 gas sensing, Sens. Actuators, B, 2018, 257, 714–727 CrossRef CAS.
- L. Xiao, S. Xu, G. Yu and S. Liu, Efficient hierarchical mixed Pd/SnO2 porous architecture deposited microheater for low power ethanol gas sensor, Sens. Actuators, B, 2018, 255, 2002–2010 CrossRef CAS.
- R. Malik, V. K. Tomer, V. Chaudhary, M. S. Dahiya, S. P. Nehra and S. Duhan, et al., A low temperature, highly sensitive and fast response toluene gas sensor based on In(III)-SnO2 loaded cubic mesoporous graphitic carbon nitride, Sens. Actuators, B, 2018, 255, 3564–3575 CrossRef CAS.
- J. Hao, D. Zhang, Q. Sun, S. Zheng, J. Sun and Y. Wang, Hierarchical SnS2/SnO2 nanoheterojunctions with increased active-sites and charge transfer for ultrasensitive NO2 detection, Nanoscale, 2018, 10, 7210–7217 RSC.
- M. A. Maki-Jaskari and T. T. Rantala, Possible structures of nonstoichiometric tin oxide: the composition Sn2O3, Modell. Simul. Mater. Sci. Eng., 2004, 12, 33–41 CrossRef.
- F. Lawson, Tin Oxide—Sn3O4, Nature, 1967, 215, 955–956 CrossRef CAS.
- G. L. W. Hart, B. Volker, M. J. Walorski and Z. Alex, Evolutionary approach for determining first-principles hamiltonians, Nat. Mater., 2005, 4, 391–394 CrossRef CAS PubMed.
- P. H. Suman, E. Longo, J. A. Varela and M. O. Orlandi, Controlled synthesis of layered Sn3O4 nanobelts by carbothermal reduction method and their gas sensor properties, J. Nanosci. Nanotechnol., 2014, 14, 6662–6668 CrossRef CAS PubMed.
- X. Ma, J. Shen, D. Hu, L. Sun, Y. Chen and M. Liu, et al., Preparation of three-dimensional Ce-doped Sn3O4 hierarchical microsphere and its application on formaldehyde gas sensor, J. Alloys Compd., 2017, 726, 1092–1100 CrossRef CAS.
- P. H. Suman, A. A. Felix, H. L. Tuller, J. A. Varela and M. O. Orlandi, Giant chemo-resistance of SnO disk-like structures, Sens. Actuators, B, 2013, 186, 103–108 CrossRef CAS.
- J. Liu, C. Wang, Q. Yang, Y. Gao, X. Zhou and X. Liang, et al., Hydrothermal synthesis and gas-sensing properties of flower-like Sn3O4, Sens. Actuators, B, 2016, 224, 128–133 CrossRef CAS.
- D. R. Miller, S. A. Akbar and P. A. Morris, Nanoscale metal oxide-based heterojunctions for gas sensing: a review, Sens. Actuators, B, 2014, 204, 250–272 CrossRef CAS.
- H. J. Kim and J. H. Lee, Highly sensitive and selective gas sensors using p-type oxide semiconductors: overview, Sens. Actuators, B, 2014, 192, 607–627 CrossRef CAS.
- F. Ren, L. Gao, Y. Yuan, Y. Zhang, A. Alqrni and O. M. Al-Dossary, et al., Enhanced BTEX gas-sensing performance of CuO/SnO2 composite, Sens. Actuators, B, 2016, 223, 914–920 CrossRef CAS.
- G. Cui, G. Liang, B. Yao, S. Wang, P. Zhang and M. Zhang, Electrochemistry of CuO/In2O3 p–n heterojunction nano/microstructure array with sensitivity to H2 at and below room-temperature, Electrochem. Commun., 2013, 30, 42–45 CrossRef CAS.
- Q. Xu, D. Ju, Z. Zhang, S. Yuan, J. Zhang and H. Xu, et al., Near room-temperature triethylamine sensor constructed with CuO/ZnO P-N heterostructural nanorods directly on flat electrode, Sens. Actuators, B, 2016, 225, 16–23 CrossRef CAS.
- S. W. Choi, A. Katoch, J. H. Kim and S. S. Kim, Prominent reducing gas-sensing performances of n-SnO2 nanowires by local creation of p–n heterojunctions by functionalization with p-Cr2O3 nanoparticles, ACS Appl. Mater. Interfaces, 2014, 6, 17723–17729 CrossRef CAS PubMed.
- H. Gao, L. Zhao, L. Wang, P. Sun, H. Lu and F. Liu, et al., Ultrasensitive and low detection limit of toluene gas sensor based on SnO2-decorated NiO nanostructure, Sens. Actuators, B, 2018, 255, 3505–3515 CrossRef CAS.
- L. Li, C. Zhang and W. Chen, Fabrication of SnO2-SnO nanocomposites with p–n heterojunctions for the low-temperature sensing of NO2 gas, Nanoscale, 2015, 7, 12133–12142 RSC.
- H. Yu, T. Yang, Z. Wang, Z. Li, Q. Zhao and M. Zhang, p–n heterostructural sensor with SnO-SnO2 for fast NO2 sensing response properties at room temperature, Sens. Actuators, B, 2018, 258, 517–526 CrossRef CAS.
- A. Shanmugasundaram, P. Basak, L. Satyanarayana and S. V. Manorama, Hierarchical SnO/SnO2 nanocomposites: Formation of in situ p–n junctions and enhanced H2 sensing, Sens. Actuators, B, 2013, 185, 265–273 CrossRef CAS.
- W. Zeng, Y. Liu, J. Mei, C. Tang, K. Luo and S. Li, et al., Hierarchical SnO2–Sn3O4 heterostructural gas sensor with high sensitivity and selectivity to NO2, Sens. Actuators, B, 2019, 127010 CrossRef CAS.
- L. Brewer, Thermodynamic Properties of the Oxides and Their Vaporization Processes, Chem. Rev., 1953, 52, 1–75 CrossRef CAS.
- Z. Dai, Z. Pan and Z. Wang, Growth and structure evolution of novel tin oxide diskettes, J. Am. Chem. Soc., 2002, 124, 8673–8680 CrossRef CAS PubMed.
- A. Seko, A. Togo, F. Oba and I. Tanaka, Structure and stability of a homologous series of tin oxides, Phys. Rev. Lett., 2008, 100, 045702 CrossRef PubMed.
- J. H. Lee, Gas sensors using hierarchical and hollow oxide nanostructures: overview, Sens. Actuators, B, 2009, 140, 319–336 CrossRef CAS.
- T. Yang, J. Zhao, X. Li, X. Gao, C. Xue and Y. Wu, et al., Preparation and characterization of p-type transparent conducting SnO thin films, Mater. Lett., 2015, 139, 39–41 CrossRef CAS.
- W. Guo, L. Fu, Y. Zhang, K. Zhang, L. Liang and Z. Liu, et al., Microstructure, optical, and electrical properties of p-type SnO thin films, Appl. Phys. Lett., 2010, 96, 042113 CrossRef.
- S. Park, S. An, Y. Mun and C. Lee, UV-enhanced NO2 gas sensing properties of SnO2-core/ZnO-shell nanowires at room temperature, ACS Appl. Mater. Interfaces, 2013, 5, 4285–4292 CrossRef CAS PubMed.
- B. Y. Yeh, P. F. Huang and W. J. Tseng, Enhanced room-temperature NO2 gas sensing with TeO2/SnO2 brush- and bead-like nanowire hybrid structures, Nanotechnology, 2017, 28, 045501 CrossRef PubMed.
- J. H. Cha, S. J. Choi, S. Yu and I. D. Kim, 2D WS2-edge functionalized multi-channel carbon nanofibers: effect of WS2 edge-abundant structure on room-temperature NO2 sensing, J. Mater. Chem. A, 2017, 5, 8725–8732 RSC.
- B. Zhang, G. Liu, M. Cheng, Y. Gao, L. Zhao and S. Li, et al., The preparation of reduced graphene oxide-encapsulated α-Fe2O3 hybrid and its outstanding NO2 gas sensing properties at room temperature, Sens. Actuators, B, 2018, 261, 252–263 CrossRef CAS.
- F. Gu, R. Nie, D. Han and Z. Wang, In2O3–graphene nanocomposite based gas sensor for selective detection of NO2 at room temperature, Sens. Actuators, B, 2015, 219, 94–99 CrossRef CAS.
- L. Guan, S. Wang, W. Gu, J. Zhuang, H. Jin and W. Zhang, et al., Ultrasensitive room-temperature detection of NO2 with tellurium nanotube based chemiresistive sensor, Sens. Actuators, B, 2014, 196, 321–327 CrossRef CAS.
- S. Thirumalairajan, K. Girija, V. R. Mastelaro and N. Ponpandian, Surface morphology-dependent room-temperature LaFeO3 nanostructure thin films as selective NO2 gas sensor prepared by radio frequency magnetron sputtering, ACS Appl. Mater. Interfaces, 2014, 6, 13917–13927 CrossRef CAS PubMed.
- S. Mao, S. Cui, G. Lu, K. Yu, Z. Wen and J. Chen, Tuning gas-sensing properties of reduced graphene oxide using tin oxide nanocrystals, J. Mater. Chem., 2012, 22, 11009–11013 RSC.
- N. Yamazoe, J. Fuchigami, M. Kishikawa and T. Seiyama, Interactions of tin oxide surface with O2, H2O and H2, Surf. Sci., 1979, 86, 335–344 CrossRef CAS.
- L. I. Trakhtenberg, G. N. Gerasimov, V. F. Gromov, T. V. Belysheva and O. J. Ilegbusi, Effect of composition on sensing properties of SnO2+In2O3 mixed nanostructured films, Sens. Actuators, B, 2012, 169, 32–38 CrossRef CAS.
- X. Xu, P. Zhao, D. Wang, P. Sun, L. You and Y. Sun, et al., Preparation and gas sensing properties of hierarchical flower-like In2O3 microspheres, Sens. Actuators, B, 2013, 176, 405–412 CrossRef CAS.
- J. Zhang, R. Tan, Y. Yang, W. Xu, J. Li and W. Shen, et al., Synthesis mechanism of heterovalent Sn2O3 nanosheets in oxidation annealing process, Chin. Phys. B, 2015, 24, 178–182 Search PubMed.
- L. Wang, D. Wang, Z. Dong, F. Zhang and J. Jin, Interface chemistry engineering of protein-directed SnO2 nanocrystal-based anode for lithium-ion batteries with improved performance, Small, 2014, 10, 998–1007 CrossRef CAS PubMed.
- T. Yoshida, N. Ogawa and T. Takahashi, Influence of NO and NO2 composition on resistivity changes of SnO2, J. Electrochem. Soc., 1999, 146(3), 1106–1110 CrossRef CAS.
- S. Elzey, A. Mubayi, S. C. Larsen and V. H. Grassian, FTIR study of the selective catalytic reduction of NO2 with ammonia on nanocrystalline NaY and CuY, J. Mol. Catal. A: Chem., 2008, 285(1–2), 48–57 CrossRef CAS.
- H. Zhang, L. Yu, Q. Li, Y. Du and S. Ruan, Reduced graphene oxide/α-Fe2O3 hybrid nanocomposites for room temperature NO2 sensing, Sens. Actuators, B, 2017, 241, 109–115 CrossRef CAS.
- H. Hosono, Y. Ogo, H. Yanagi and T. Kamiya, Bipolar conduction in SnO thin films, Electrochem. Solid-State Lett., 2011, 14, H13–H16 CrossRef CAS.
- W. Xia, H. Qian, X. Zeng, J. Dong, J. Wang and Q. Xu, Visible-light self-powered photodetector and recoverable photocatalyst fabricated from vertically aligned Sn3O4 nanoflakes on carbon paper, J. Phys. Chem. C, 2017, 121, 19036–19043 CrossRef CAS.
- H. Zhang, J. Feng, T. Fei, S. Liu and T. Zhang, SnO2 nanoparticles-reduced graphene oxide nanocomposites for NO2 sensing at low operating temperature, Sens. Actuators, B, 2014, 190, 472–478 CrossRef CAS.
Footnote |
| † Electronic supplementary information (ESI) available. See DOI: 10.1039/d0ra05576j |
| This journal is © The Royal Society of Chemistry 2020 |

