
 Open Access Article
 This Open Access Article is licensed under a Creative Commons Attribution-Non Commercial 3.0 Unported Licence
Multi-omics based characterization of antibiotic response in clinical isogenic isolates of methicillin-susceptible/-resistant Staphylococcus aureus†
Sung-Hyun Jo a,
Won-Suk Songb,
Han-Gyu Parka,
Jae-Seung Leea,
Hyo-Jin Jeona,
Yeon-Hee Leec,
Wooseong Kimd,
Hwang-Soo Jooc,
Yung-Hun Yange,
Jae-Seok Kimf and
Yun-Gon Kim*a
a,
Won-Suk Songb,
Han-Gyu Parka,
Jae-Seung Leea,
Hyo-Jin Jeona,
Yeon-Hee Leec,
Wooseong Kimd,
Hwang-Soo Jooc,
Yung-Hun Yange,
Jae-Seok Kimf and
Yun-Gon Kim*a
aDepartment of Chemical Engineering, College of Engineering, Soongsil University, 369 Sangdo-Ro, Seoul 06978, Republic of Korea. E-mail: ygkim@ssu.ac.kr; Tel: +82-2-828-7099
bSchool of Chemical and Biological Engineering, Seoul National University, Seoul 08826, Republic of Korea
cDepartment of Biotechnology, Duksung Women's University, Seoul 01369, Republic of Korea
dCollege of Pharmacy, Graduate School of Pharmaceutical Sciences, Ewha Womans University, Seoul 03760, Republic of Korea
eDepartment of Microbial Engineering, College of Engineering, Konkuk University, Seoul 05029, Republic of Korea
fDepartment of Laboratory Medicine, Kangdong Sacred Heart Hospital, Hallym University College of Medicine, Seoul 05355, Republic of Korea
First published on 27th July 2020
Abstract
As demands for new antibiotics and strategies to control methicillin-resistant Staphylococcus aureus (MRSA) increase, there have been efforts to obtain more accurate and abundant information about the mechanism of the bacterial responses to antibiotics. However, most of the previous studies have investigated responses to antibiotics without considering the genetic differences between MRSA and methicillin-susceptible S. aureus (MSSA). Here, we initially applied a multi-omics approach into the clinical isolates (i.e., S. aureus WKZ-1 (MSSA) and S. aureus WKZ-2 (MRSA)) that are isogenic except for the mobile genetic element called staphylococcal cassette chromosome mec (SCCmec) type IV to explore the response to β-lactam antibiotics (oxacillin). First, the isogenic pair showed a similar metabolism without oxacillin treatment. The quantitative proteomics demonstrated that proteins involved in peptidoglycan biosynthesis (MurZ, PBP2, SgtB, PrsA), two-component systems (VrsSR, WalR, SaeSR, AgrA), oxidative stress (MsrA1, MsrB), and stringent response (RelQ) were differentially regulated after the oxacillin treatment of the isogenic isolates. In addition, targeted metabolic profiling showed that metabolites belonging to the building blocks (lysine, glutamine, acetyl-CoA, UTP) of peptidoglycan biosynthesis machinery were specifically decreased in the oxacillin-treated MRSA. These results indicate that the difference in metabolism of this isogenic pair with oxacillin treatment could be caused only by SCCmec type IV. Understanding and investigating the antibiotic response at the molecular level can, therefore, provide insight into drug resistance mechanisms and new opportunities for antibiotics development.
1. Introduction
Staphylococcus aureus, a Gram-positive bacterial species, is found asymptomatically colonizing approximately 20–30% of the healthy population in the nares, on the skin, and in the gastrointestinal tract.1 However, this species can cause very serious infection once these bacteria are able to penetrate internal tissues and/or blood vessels.2 Currently, especially, global spread of methicillin-resistant S. aureus (MRSA) is notorious for complicating the treatment of infection.1,3 Even, MRSA accounts for approximately 50% of S. aureus infection cases and becomes resistant to almost all antibiotics.1 Therefore, there is an urgent need to develop new antibiotic compounds and/or therapeutic strategies, and numerous studies are underway in an effort to control MRSA.3,4β-Lactam antibiotics are agents that contain β-lactam rings, including penicillin and its derivatives.5 β-lactam antibiotics inhibit S. aureus by interfering cell wall synthesis via their affinity to penicillin-binding proteins (PBPs), enzymes participating in the peptidoglycan cross-linking step through transpeptidation and transglycosylation.6 However, MRSA is known for having two mechanisms of resistance to these antibiotics: (1) β-lactamase, an enzyme produced by MRSA, hydrolyzes β-lactam antibiotics and prevents binding to PBPs.5 (2) PBP2a, a transpeptidase, confers antibiotic resistance because it is not inhibited by β-lactam antibiotics and can maintain peptidoglycan cross-linking.6
Several studies addressing antibiotic resistance mechanisms and bacterial responses to antibiotics have been conducted to develop new antibiotics and/or therapeutic strategies for treating MRSA infection.3,4,7,8 In particular, since the development of omics technologies such as next-generation sequencing and mass spectrometry, new studies have been reported that analyze entire biological systems to investigate antibiotic resistance mechanisms.4,8,9 Although these studies have observed changes in cell physiology by comparing antibiotic treatment and control groups, investigations of the influence of antibiotic resistance genes on cell metabolism are insufficient. Because an experimental design that controls for other genetic differences is required to observe only the influence of antibiotic resistance genes, the introduction of model strains that are genetically identical except for the sequence of interest is important.
In this study, we used a multi-omics approach to explore the response to oxacillin of S. aureus WKZ-1 (MSSA) and S. aureus WKZ-2 (MRSA),10 a isogenic clinical strain pair except for a mobile genetic element called staphylococcal cassette chromosome mec (SCCmec) type IV, containing the mecA gene conferring oxacillin resistance, integrating quantitative nontargeted proteomics and targeted metabolomics information. First, we confirmed that S. aureus WKZ-1 and WKZ-2 are isogenic except for SCCmec type IV, and a minimal inhibitory concentration test was performed to determine oxacillin treatment concentration. The quantitative multi-omics analysis was performed by liquid chromatography-mass spectrometry (LC-MS)-based label-free quantitative proteomics and LC-MS-based targeted metabolomics using an internal library of 134 metabolites. We, through this approach, were able to observe the influence of SCCmec type IV on the response to oxacillin without effects of unnecessary genetic background by introducing the isogenic model and using the multi-omics approach, and we expect these findings to contribute to basic research to control antibiotic-resistant bacteria.
2. Materials and methods
2.1 S. aureus strain, culture condition and oxacillin treatment
The Staphylococcus aureus WKZ-1 and WKZ-2 strains,10 which are isogenic except for SCCmec type IV, were used in this study. These bacterial strains were obtained through BEI Resources. Both bacterial strains were grown aerobically at 37 °C on 100 mL of tryptic soy broth (Becton, Dickinson and Company, Franklin Lakes, NJ, USA) with shaking at 250 rpm. First, we conducted an minimum inhibitory concentration (MIC) test for oxacillin (Sigma-Aldrich, St. Louis, MO, USA) using the broth microdilution method.11 The MIC values for S. aureus WKZ-1 and WKZ-2 were determined to be 1 mg L−1 and 64 mg L−1, respectively, and we treated with oxacillin equal to 0.5 of the MIC as subinhibitory concentration. Oxacillin was treated at the mid-exponential growth phase, and proteome and metabolome sample preparation were performed after 1 h 30 min.2.2 Whole genome sequencing
Genomic DNA was extracted from S. aureus WKZ-1 and WKZ-2 strains using a blood and cell culture DNA Midi kit (Qiagen, Hilden, Germany). The de novo assembly of the S. aureus genome was performed at Macrogen (Seoul, Republic of Korea) using both the Illumina HiSeq X-Ten (150 bp paired-end sequencing) and PacBio RSII (Pacific Biosciences, Menlo Park, CA, USA) platforms. Ultimately, for S. aureus WKZ-1 and WKZ-2, 12![[thin space (1/6-em)]](https://www.rsc.org/images/entities/char_2009.gif) 321200 and 14500754 paired-end reads were generated by Illumina sequencing, and 99380 and 79864 long reads were generated by PacBio sequencing. Subreads generated from PacBio RS II were assembled using the Hierarchical Genome Assembly Process (HGAP) 3 protocol with default options. The assembly was corrected using high-quality HiSeq 2500 reads by Pilon v1.21. Gene prediction was accomplished by Rapid Annotation using the Subsystem Technology SEED viewer (RAST; http://rast.nmpdr.org/).12 A genomic alignment dot plot was generated for S. aureus WKZ-1 and WKZ-2 using D-GENIES.13
321200 and 14500754 paired-end reads were generated by Illumina sequencing, and 99380 and 79864 long reads were generated by PacBio sequencing. Subreads generated from PacBio RS II were assembled using the Hierarchical Genome Assembly Process (HGAP) 3 protocol with default options. The assembly was corrected using high-quality HiSeq 2500 reads by Pilon v1.21. Gene prediction was accomplished by Rapid Annotation using the Subsystem Technology SEED viewer (RAST; http://rast.nmpdr.org/).12 A genomic alignment dot plot was generated for S. aureus WKZ-1 and WKZ-2 using D-GENIES.13
2.3 Intracellular metabolite extraction
A cell pellet was obtained from 10 mL of culture by centrifugation at 4000 rpm at 4 °C for 10 min and washed twice with 0.85% NaCl at 4 °C. 400 μL of 80% cold methanol (−80 °C, HPLC grade, Fisher Scientific, Fair Lawn, NJ, USA) was added to each cell pellet. After samples were vortexed for 1 min, they were incubated at −80 °C for 20 min. After samples were vortexed for 1 min again, they were filtrated through a 0.22 μm PVDF filter to remove cell debris. Metabolite samples were stored at −80 °C before analysis.2.4 Targeted metabolomics
An aliquot (90 μL) of each intracellular metabolite sample was transferred to a microtube, and 10 μL of 10 μg mL−1 L-phenylalanine-13C9, 15N (Sigma-Aldrich, St. Louis, MO, USA) was added as an internal standard. Prepared samples were transferred to LC vials, and LC-MS/MS analysis was performed. Analysis was performed using a 1260 Infinity Binary HPLC system (Agilent, Santa Clara, CA, USA) combined with a 6420 Triple Quadrupole LC-MS system (Agilent, Santa Clara, CA, USA). LC separation was on a Luna NH2 column (250 × 2 mm, 5 μm particle size, Phenomenex, Torrance, CA, USA) using a gradient solvent A (20 mM ammonium acetate (HPLC grade, Fisher Scientific, Fair Lawn, NJ, USA) and 20 mM ammonium hydroxide (HPLC grade, Fisher Scientific, Fair Lawn, NJ, USA) in 95:5 water:acetonitrile, pH 9.5) and solvent B (acetonitrile). The LC gradient was: 0 min, 85% B; 15 min, 0% B; 28 min, 0% B; 30 min, 85% B; 40 min, 85% B. Flow rate was 0.5 mL min−1 10 μL of each prepared metabolite sample was injected for LC-MS/MS analysis. The electrospray ionization voltage was 4 kV. Agilent MassHunter Qualitative Analysis (version B.07.00) software was used to extract MS peak areas. Peak area was normalized using intracellular protein concentration and peak area of internal standard.
2.5 Statistical analysis for metabolomics
Statistical analysis was performed using MetaboAnalyst 4.0 and the R statistical programming environment.14 When there were 3 or more missing values in both groups, the corresponding metabolites were removed from the list, and the missing values of the remained metabolites were estimated by the half-of-the-minimum imputation method. The p-value was calculated by a nonparametric method, and a false discovery rate (FDR)-adjusted p-value was used for further study. Subsequently, the metabolites with a fold-change of 1.5 times or more and a p-value of 0.05 or less were defined as quantitatively significant.2.6 Protein sample preparation for MS analysis
Cell pellets were obtained in the same manner described above. Cell pellets were resuspended in 5 mL of water (HPLC grade, Fisher Scientific, Fair Lawn, NJ, USA) and sonicated by a probe sonicator (Sonics & Materials, Inc, CT, USA) to cell lysis. Protein samples were obtained by modified trichloroacetic acid (TCA)-acetone precipitation.15 Briefly, after cell lysates were mixed with the same volume of 20% TCA in acetone at 20 °C and incubated on ice for 5 min, samples were centrifuged at 15000 × g at 4 °C for 3 min, and then supernatants were removed. Protein pellets were washed with absolute acetone at −20 °C and 80% acetone at −20 °C. Protein pellets were resolubilized in 8 M urea. For protein reduction, dithiothreitol (DTT:protein 1:50, w/w) was added to the sample, and samples were incubated at 55 °C for 15 min. Protein was alkylated by treating iodoacetamide (IAM:protein = 1:10, w/w), and samples were incubated in the dark for 15 min. After buffer change with 25 mM ammonium bicarbonate buffer (sample:buffer = 1:4, v/v), trypsin (trypsin:protein 1:25, w/w) was added followed by digestion overnight at 37 °C. Peptides were purified using a Sep-pak Plus C18 cartridge (Waters, Milford, MA, USA) and dried with a centrifugal vacuum concentrator (Vision Scientific, Seoul, Republic of Korea).
2.7 Quantitative proteomics
The dried sample was dissolved in solvent A (water/acetonitrile (98:2 v/v), 0.1% formic acid) for analysis. Analysis was performed using Ultimate 3000 RSLCnano LC system (Thermo Scientific, Waltham, MA, USA). A Q Exactive Hybrid Quadrupole-Orbitrap (Thermo Scientific, Waltham, MA, USA) equipped with a nanoelectrospray ionization source was used in combination with the nano-HPLC. The sample was trapped in an Acclaim PepMap 100 trap column (100 μm × 2 cm, nanoViper C18, 5 μm, 100 Å, Thermo Scientific, Waltham, MA, USA). Then, 98% of solvent A was used to wash the column at a flow rate of 4 μL min−1 for 6 min. After washing, the sample was separated at a flow rate of 350 nL min−1. LC separation was on an Acclaim PepMap 100 capillary column (75 μm × 15 cm, nanoViper C18, 3 μm, 100 Å, Thermo Scientific, Waltham, MA, USA) using gradient solvent B (0.1% formic acid in acetonitrile) and solvent A. The LC gradient was: 0 min, 2% B; 30 min, 35% B; 40 min 90% B, 45 min, 90% B; 60 min, 5% B. Through a coated silica tip (PicoTip emitter, New Objective, Woburn, MA, USA), separated peptides were electrosprayed. The ion spray voltage was 2100 eV. Xcaliber software version 3.1 was used to collect MS data. The Orbitrap analyzer scanned precursor ions with a mass range of 350–1800 m/z with 70000 resolution at m/z 200. For collision-induced dissociation (CID), up to the 15 most abundant precursor ions were selected. The normalized collision energy was 32. Mass data are acquired automatically using proteome discoverer 2.2 (Thermo Scientific, Waltham, MA, USA).
Protein identification and label-free quantification (LFQ) were performed by MaxQuant (version 1.6.2.3) a software program based on the Andromeda search engine.16,17 Proteins were identified by searching MS and MS/MS data of peptides against protein sequence database generated using RAST.12 Carbamidomethylation of cysteines was set as a fixed modification. Oxidation of methionine and N-terminal acetylation were set as variable modifications. Up to two missed cleavages were allowed. The “Match between runs” option was enabled. Statistical analysis of LFQ data was performed by LFQ Analyst and the R statistical programming environment.18 Perseus-type missing value estimation was used, and the significance was determined using the adjusted p-value. Proteins with a fold-change of 1.5 times or more and a p-value of 0.05 or less were defined as quantitatively significant. To match gene name and protein function derived from the SEED server, the AureoWiki was used.19
2.8 Delta toxin quantification by LC-MS
Delta toxin was quantified as described previously.20 Briefly, 5 μL of culture supernatant was infused into a C8 column (ZORBAX SB-C8, 2.1 × 30 mm, 3.5 μm, Agilent, Santa Clara, CA, USA) connected to Waters 2795 separation module (Waters, Milford, MA, USA). Delta toxin was eluted by 0.05% trifluoroacetic acid (TFA) in double distilled water (eluent A) and 0.05% TFA in acetonitrile (eluent B) at a flow rate of 0.3 mL min−1 for 10 min. The gradient program for elution is as follows: 0% eluent B for 1.5 min; 0% to 50% of eluent B for 1 min; 50% to 100% of eluent B for 4 min; 100% eluent B for 2.5 min; 0% eluent B for 1 min. The separated delta toxin was ionized and analyzed by the conjunct Waters ZQ 2000 MS system (Waters, Milford, MA, USA) equipped with an electrospray ionization (ESI) source. Ion source parameters are as follows: capillary voltage, 3.3 kV; cone voltage, 50 V; source temperature, 120 °C; desolvation temperature, 350 °C; desolvation gas flow, 900 L h−1; cone gas flow, 50 L h−1. Ions were analyzed in the positive ion full scan mode for the range of m/z 600 to 1600. Scan time is 1 s with an inter-scan delay of 0.1 s following parameters. The production of delta toxin was measured by integrating the extracted ion chromatograms based on the m/z 1504 and 1003 of doubly- and triply-charged ions, respectively.3. Result and discussion
3.1 Multi-omics based characterization of antibiotic response in clinical isogenic isolates
As mentioned above, using the isogenic model is crucial to observe the influence of only genetic elements associated with antibiotic resistance. Thus, we introduced the isogenic strain pair S. aureus WKZ-1 and WKZ-2 to examine how SCCmec type IV carried by community acquired (CA)-MRSA contributes to antibiotic resistance. To confirm genetic identicality, whole-genome sequencing was performed; that these strains are isogenic except for the SCCmec type IV element is confirmed by genome comparison (Fig. 1A).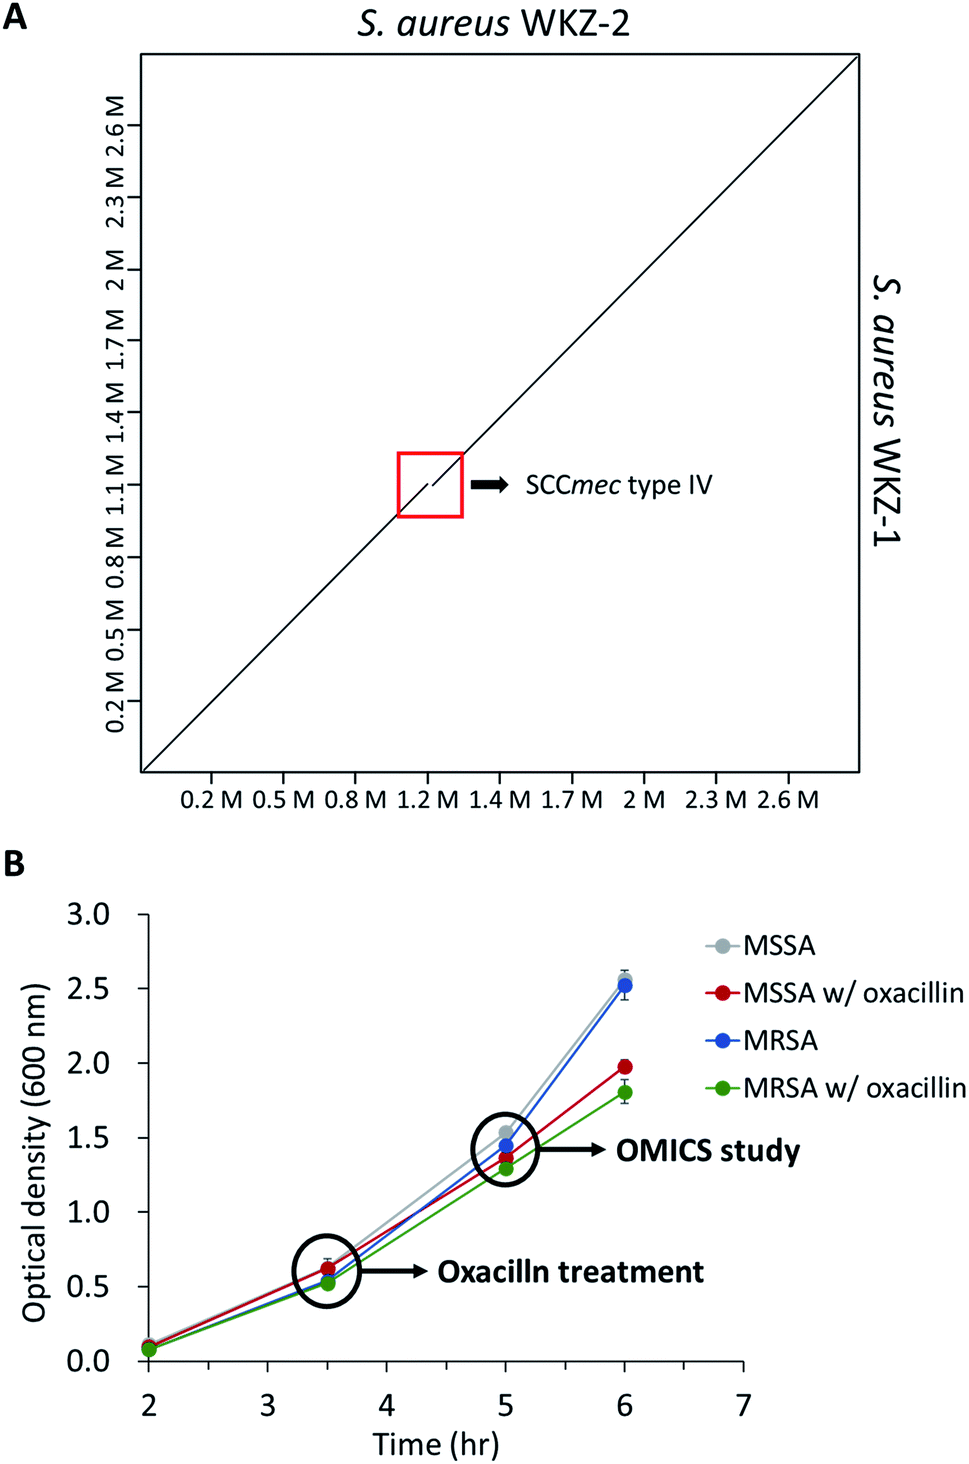 | ||
| Fig. 1 (A) The genome comparison of S. aureus WKZ-1 and S. aureus WKZ-2. A dot plot was generated using D-GENIES. The red box indicates the SCCmec type IV region. (B) The bacterial growth curve of all experimental groups in this study. Indications are time points that oxacillin treatment and sampling for proteomics and metabolomics. Error bars indicate standard deviation (n = 3). | ||
To avoid complete inhibition of bacterial growth and simultaneously provide sufficient stimulation, we treated each strain with oxacillin equal to 0.5 of the MIC as subinhibitory concentration. After treatment with oxacillin, the optical density (OD) was measured to confirm that growth occurred even though lower than control (Fig. 1B). To confirm for an immediate response induced by oxacillin, the sampling was performed in early-stage (1 h 30 min after oxacillin treatment). Quantitative investigations of metabolome and proteome were performed (Fig. 2A).
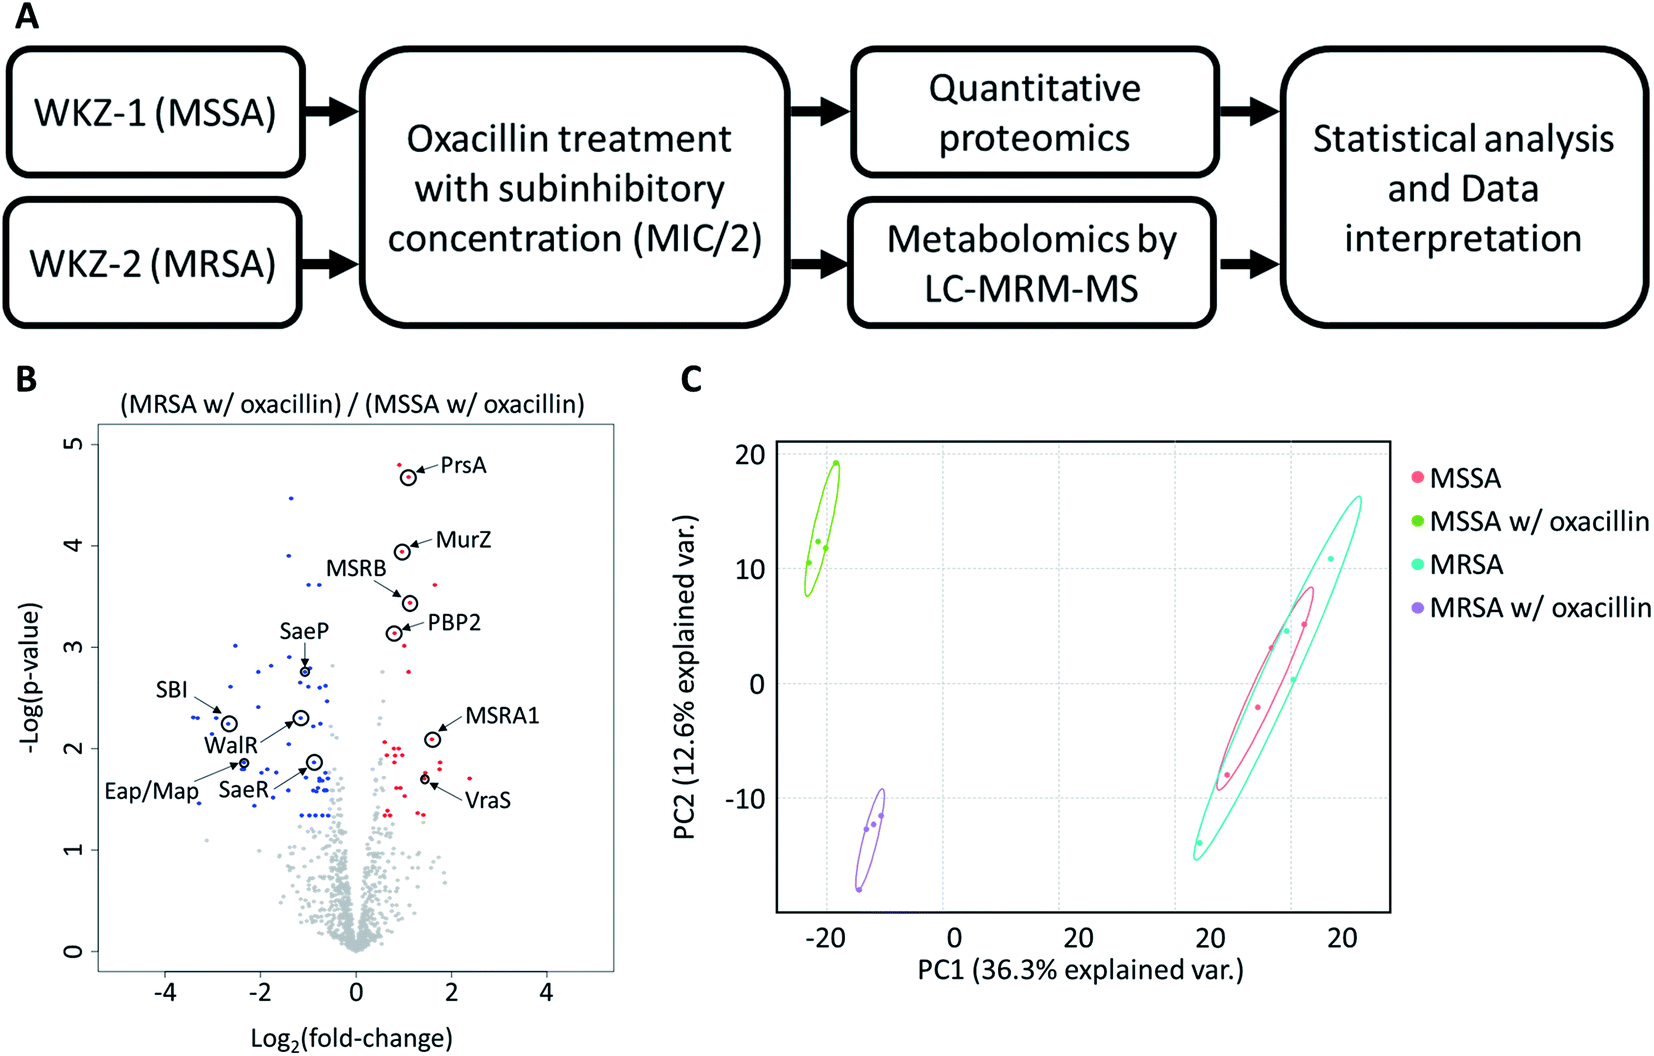 | ||
| Fig. 2 (A) The overall workflow of this study. (B) Volcano plot of proteomic analysis for oxacillin treated MSSA and oxacillin treated MRSA. Red color indicates relative high expression in oxacillin treated MRSA and blue color indicates relatively low expression in oxacillin treated MRSA. Proteins with fold change > 1.5 and with adjusted p-value < 0.05 were considered statistically significant (n = 4). Indications are proteins discussed in this study. (C) Principal Component Analysis (PCA) plot of proteomic analysis for all experimental groups. Control groups (MSSA and MRSA without oxacillin) were had high similarity with each other and the experimental group (MSSA and MRSA with oxacillin) were not similar to other ones. | ||
As a result, a total of 1018 proteins were identified in bottom-up proteomics, and 90 metabolites were identified in targeted metabolomics using 133 internal metabolites multiple reaction monitoring (MRM) library. When comparing MSSA and MRSA (without oxacillin treatment), there was no significant quantitative difference in any proteins except for PBP2a in the proteomic analysis (Fig. S1†); also, only 2 metabolites (alpha-ketoglutarate, CMP) out of 88 detected metabolites were significantly different in the metabolomic analysis. On the other hand, when comparing oxacillin-treated MSSA and MRSA, there were quantitative differences in proteome and metabolome (Fig. 2B and C). In the proteomic analysis, several proteins participating in peptidoglycan synthesis, two-component system, oxidative stress, stringent response were observed. Also, in the metabolomic analysis, amino acid and derivatives were significantly down-regulated in oxacillin-treated MRSA, and some metabolites belong to nucleoside derivatives (e.g., inosine, adenosine, AMP and etc.), carboxylic acids (e.g., lactic acid, citrate and etc.), CoAs (e.g., acetyl-CoA), vitamins (e.g., carnitine and biotin etc.) were differentially regulated (Fig. 3). Although this phenomenon (decreased intracellular metabolite level) were consistent with the previous study, the mechanism underlying the results is still unknown.3,4 In previous research, when comparing proteomes of the non-antibiotic treatment groups of MRSA and MSSA, 30% of the proteome was differentially detected, and vice versa.8 However, as a result of omics analysis using the isogenic strain model, our study showed there is no difference in metabolism between MSSA and MRSA (without oxacillin treatment), and this demonstrates that we were able to observe more precisely the responses to oxacillin induced by SCCmec type IV. All metabolomics and proteomics data in this paper were available on ESI.†
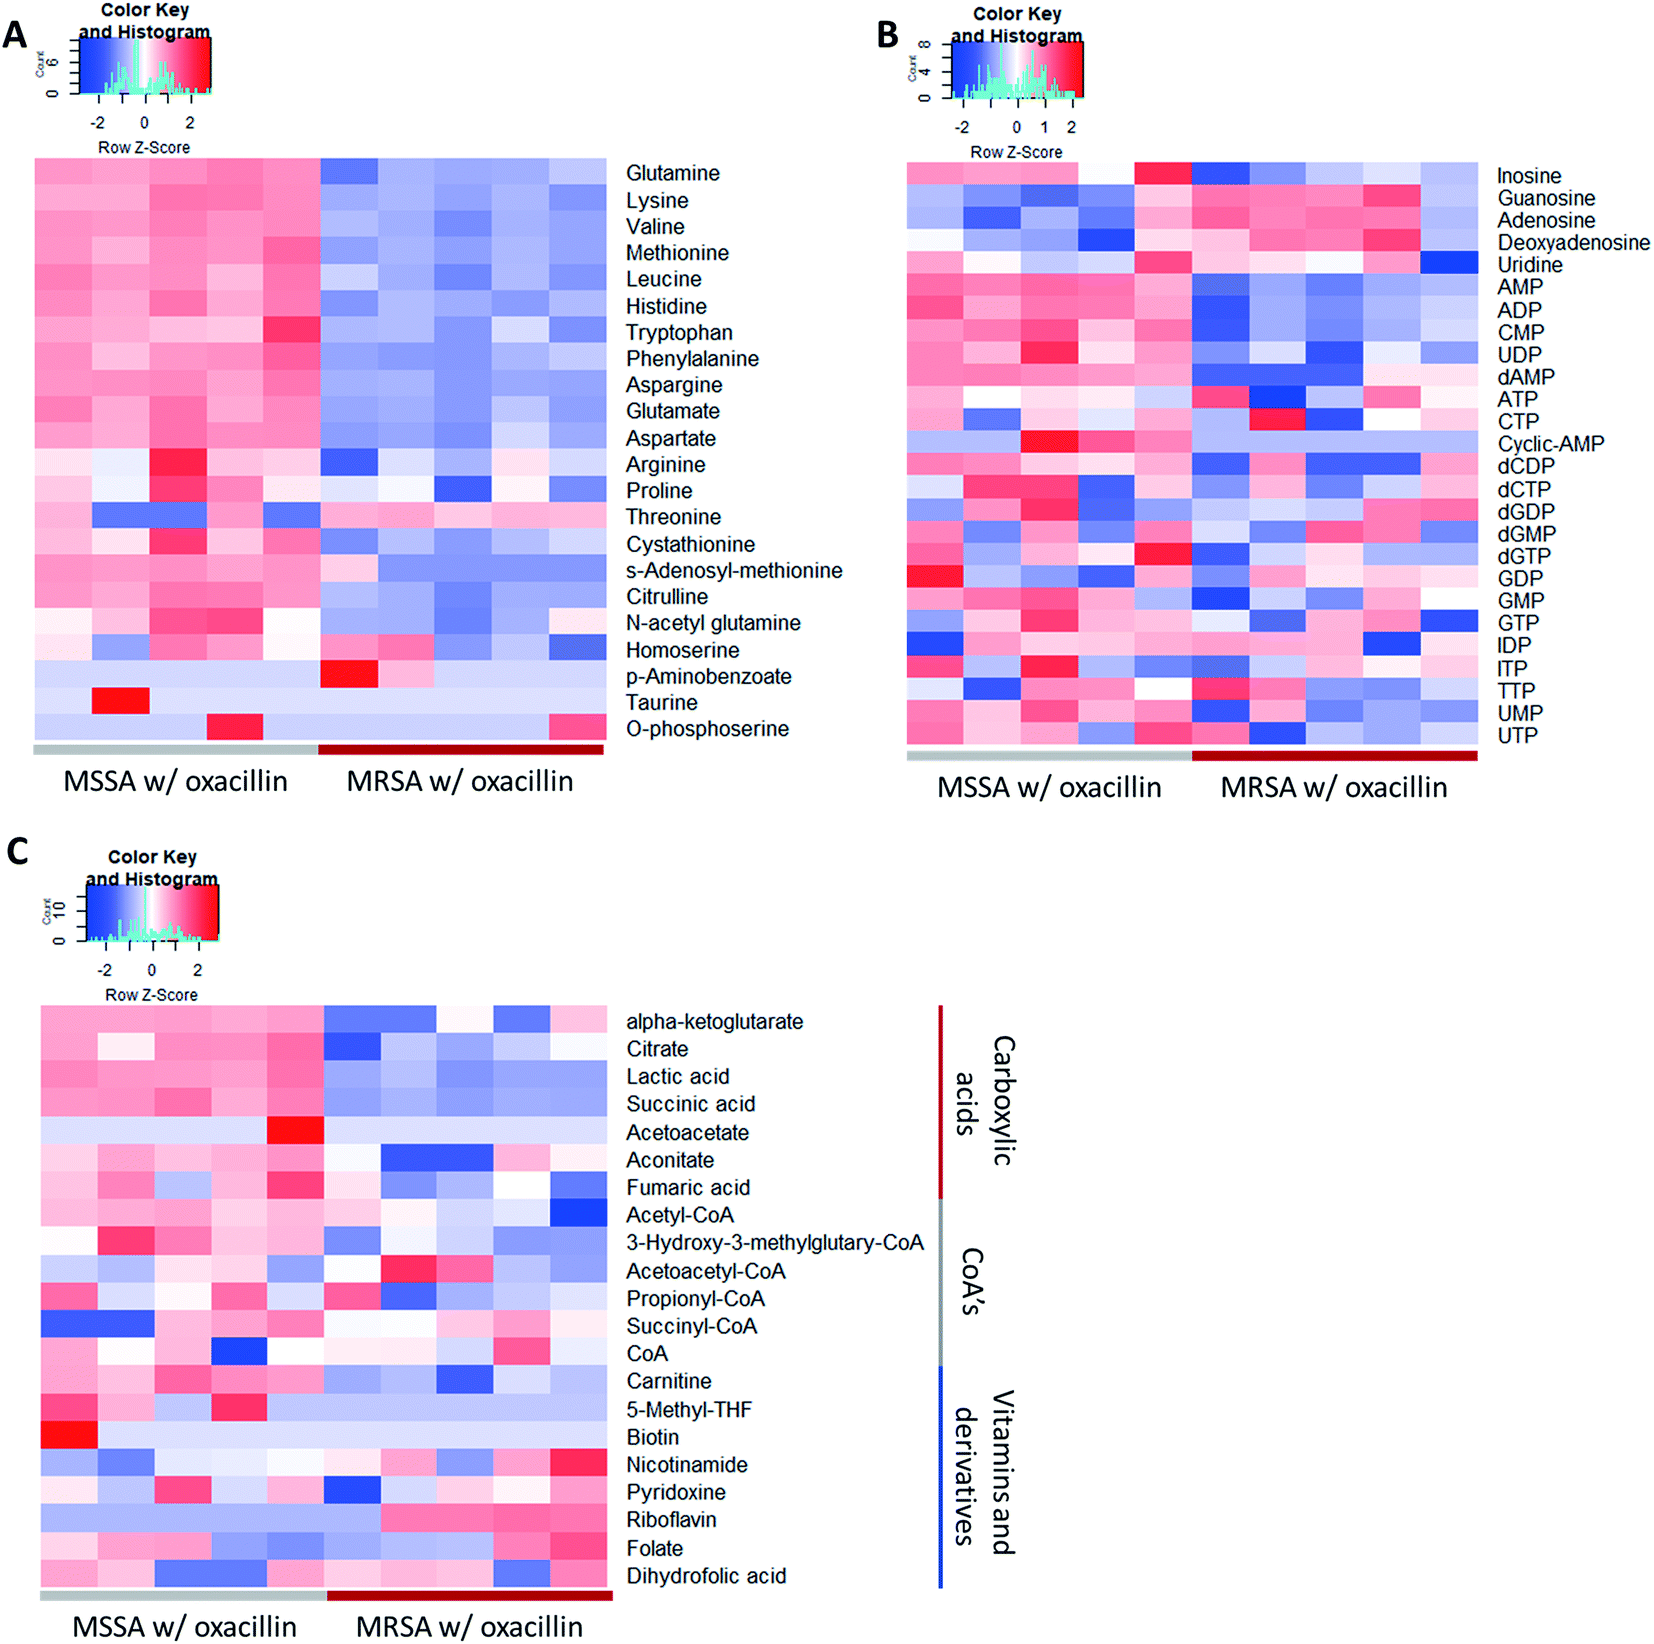 | ||
| Fig. 3 Heatmap of the result of the metabolomic analysis (n = 5). (A) Displayed metabolites are amino acids and derivatives. (B) Displayed metabolites are nucleoside and derivatives. (C) Displayed metabolites are carboxylic acids or CoA's or vitamins. Red color indicates relatively high abundance and blue color indicates relatively low abundance. Most amino acids were less abundant in oxacillin treated MRSA. | ||
3.2 Peptidoglycan biosynthesis
Peptidoglycan constitutes the cell wall of Gram-positive bacteria, and it is targeted by various antibiotics.6,21,22 β-Lactam antibiotics such as oxacillin inhibit cell wall synthesis by affecting PBPs, enzymes associated with cell wall cross-linking; it is known that cell death eventually occurs by osmotic lysis.6,21,22 In the proteomic analysis, proteins related to peptidoglycan biosynthesis were up-regulated in oxacillin-treated MRSA. Increased expression of UDP-N-acetylglucosamine 1-carboxyvinyltransferase (MurZ) and penicillin-binding protein 2 (PBP2) and, although not significant, monofunctional biosynthetic peptidoglycan transglycosylase (SgtB) was detected at a higher level (Fig. 4A). In addition, foldase protein PrsA, which indirectly affects peptidoglycan biosynthesis, was detected at significantly higher levels in oxacillin-treated MRSA than oxacillin-treated MSSA (Fig. 4A). PrsA influences posttranslocational folding of several cell wall associated proteins and exoproteins; in particular, it plays a role in the posttranscriptional maturation of PBP2a.23,24 These results show that MRSA seems to maintain cell wall integrity by up-regulating the peptidoglycan biosynthetic pathway against oxacillin and are consistent with findings of previous investigations (e.g., microarray and proteomic studies).8,9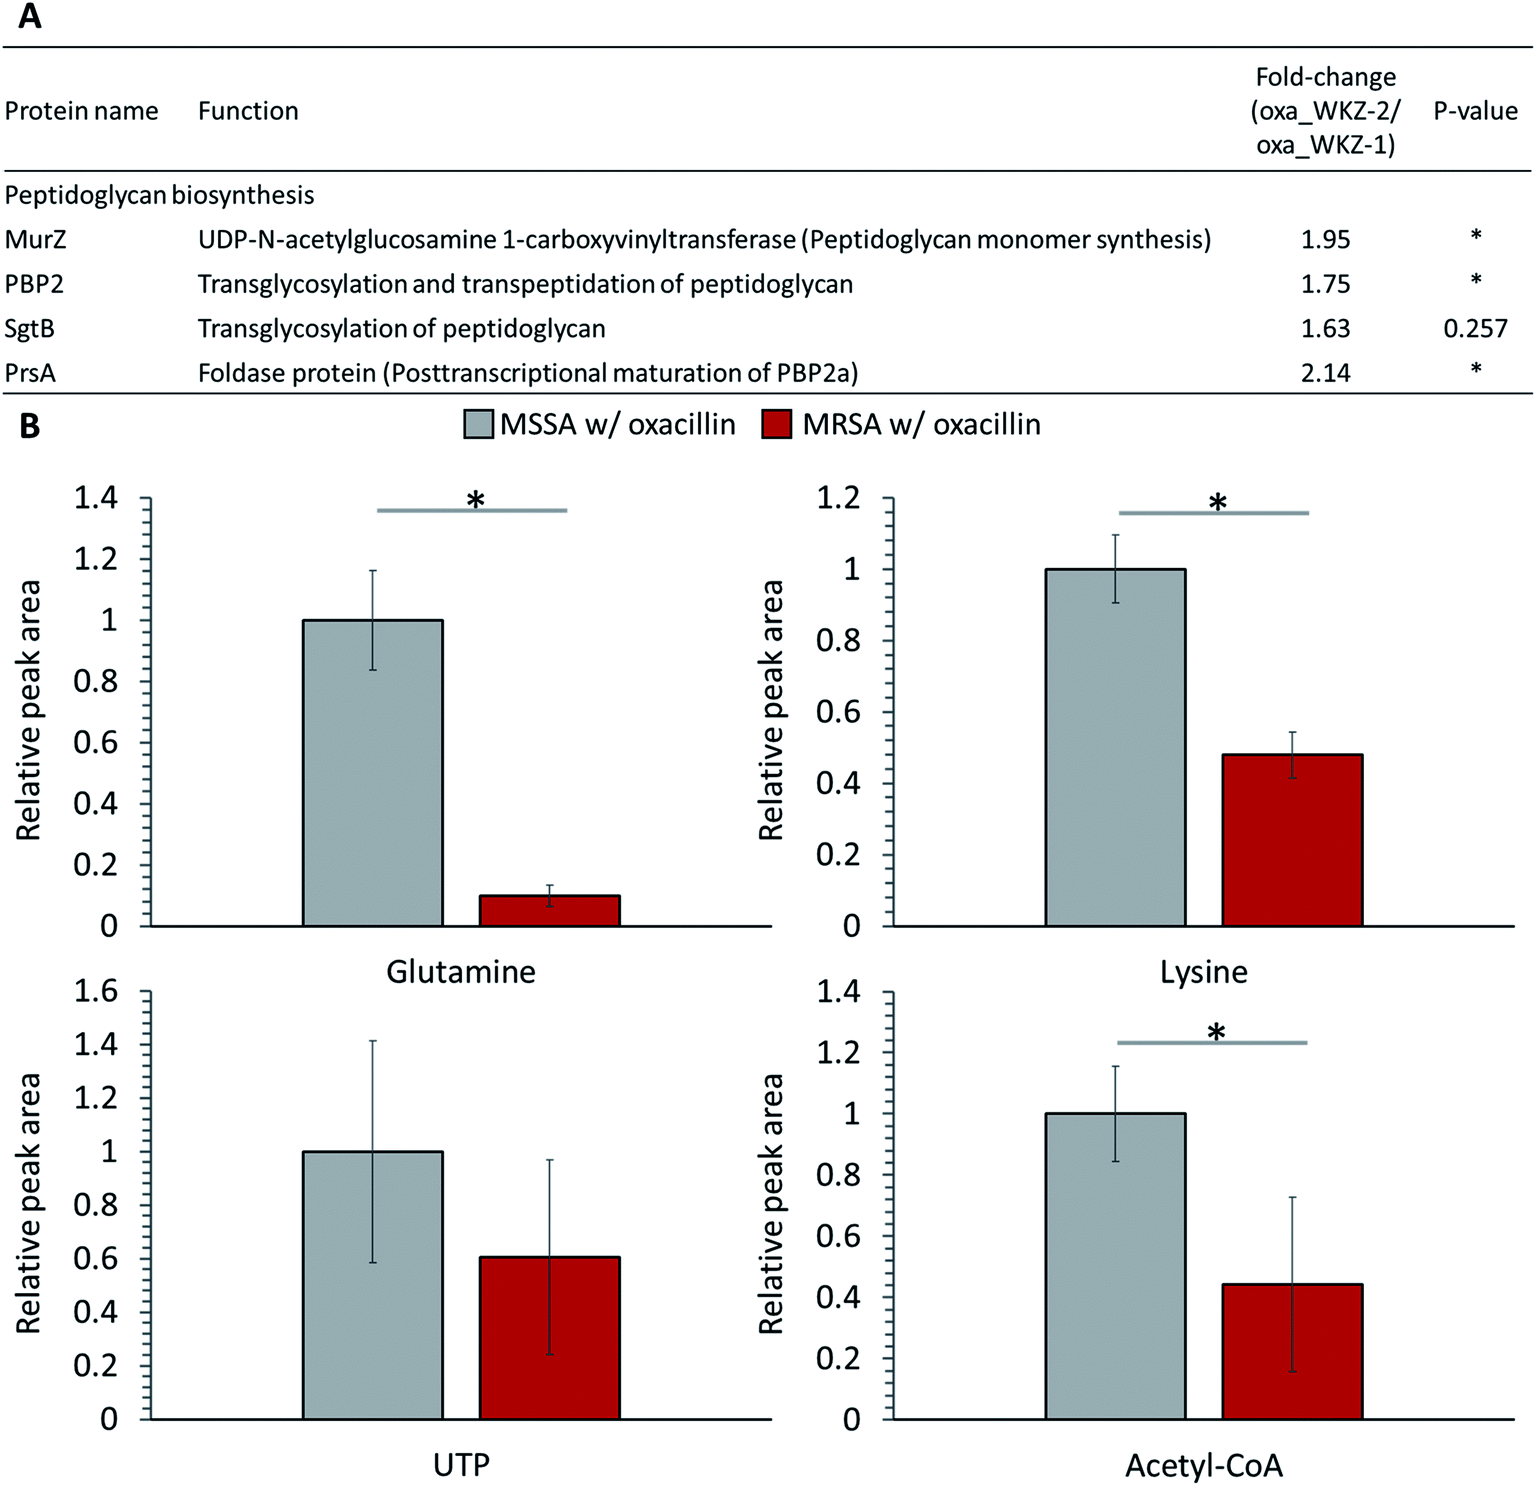 | ||
| Fig. 4 (A) Table of proteins responsible for peptidoglycan biosynthesis. The indicated protein functions were derived from the SEED server. (B) Abundance levels of metabolites consumed as peptidoglycan building-block. Gray color indicates oxacillin treated MSSA and red color indicates oxacillin treated MRSA. The symbol (*) indicates a statistically significant difference (n = 5, p < 0.05). Error bars indicate standard deviation. | ||
Several substrates (e.g., ATP, nucleotide-activated precursors, and amino acids) are essentially consumed for peptidoglycan biosynthesis. In metabolomic analysis, lysine, glutamine, acetyl-CoA, and UTP were at lower intracellular levels in oxacillin-treated MRSA than oxacillin-treated MSSA (Fig. 4B).4 It is predicted that the decrease in these metabolites is the result of the promotion of peptidoglycan production to resist oxacillin stress; these results are consistent with metabolomic studies with cell wall inhibitors.3,4 Taken together, we speculate that MRSA tolerates oxacillin stress by up-regulating enzymes belong to the peptidoglycan biosynthetic pathway and by consuming intracellular metabolites corresponding to building blocks for peptidoglycan.
3.3 Two-component system (TCS)
Quantitative differences in proteins belonging to two-component systems (TCS), serving a role sensing and responding to environmental conditions, are observed between oxacillin-treated MRSA and MSSA. First, up-regulation of VraS and VraR proteins constituting the VraSR TCS, which are known to be induced by external cell wall affecting agents such as β-lactam antibiotics, was observed in oxacillin-treated MRSA (Fig. 5A). VraSR is known for positively regulating proteins (e.g., PBP2, SgtB and MurZ) by signal transduction and for playing a crucial role in oxacillin resistance.25 In addition, VraT was detected at higher levels, and this protein is required for oxacillin resistance with the VraSR TCS and known for playing a major role in cell wall stress response (Fig. 5A).26 As a result, up-regulation of the VraRS TCS is responsible for the induction of the vra regulon by oxacillin and, consequently, affects the overexpression of proteins participating in peptidoglycan biosynthesis (e.g., SgtB, MurZ, and PBP2).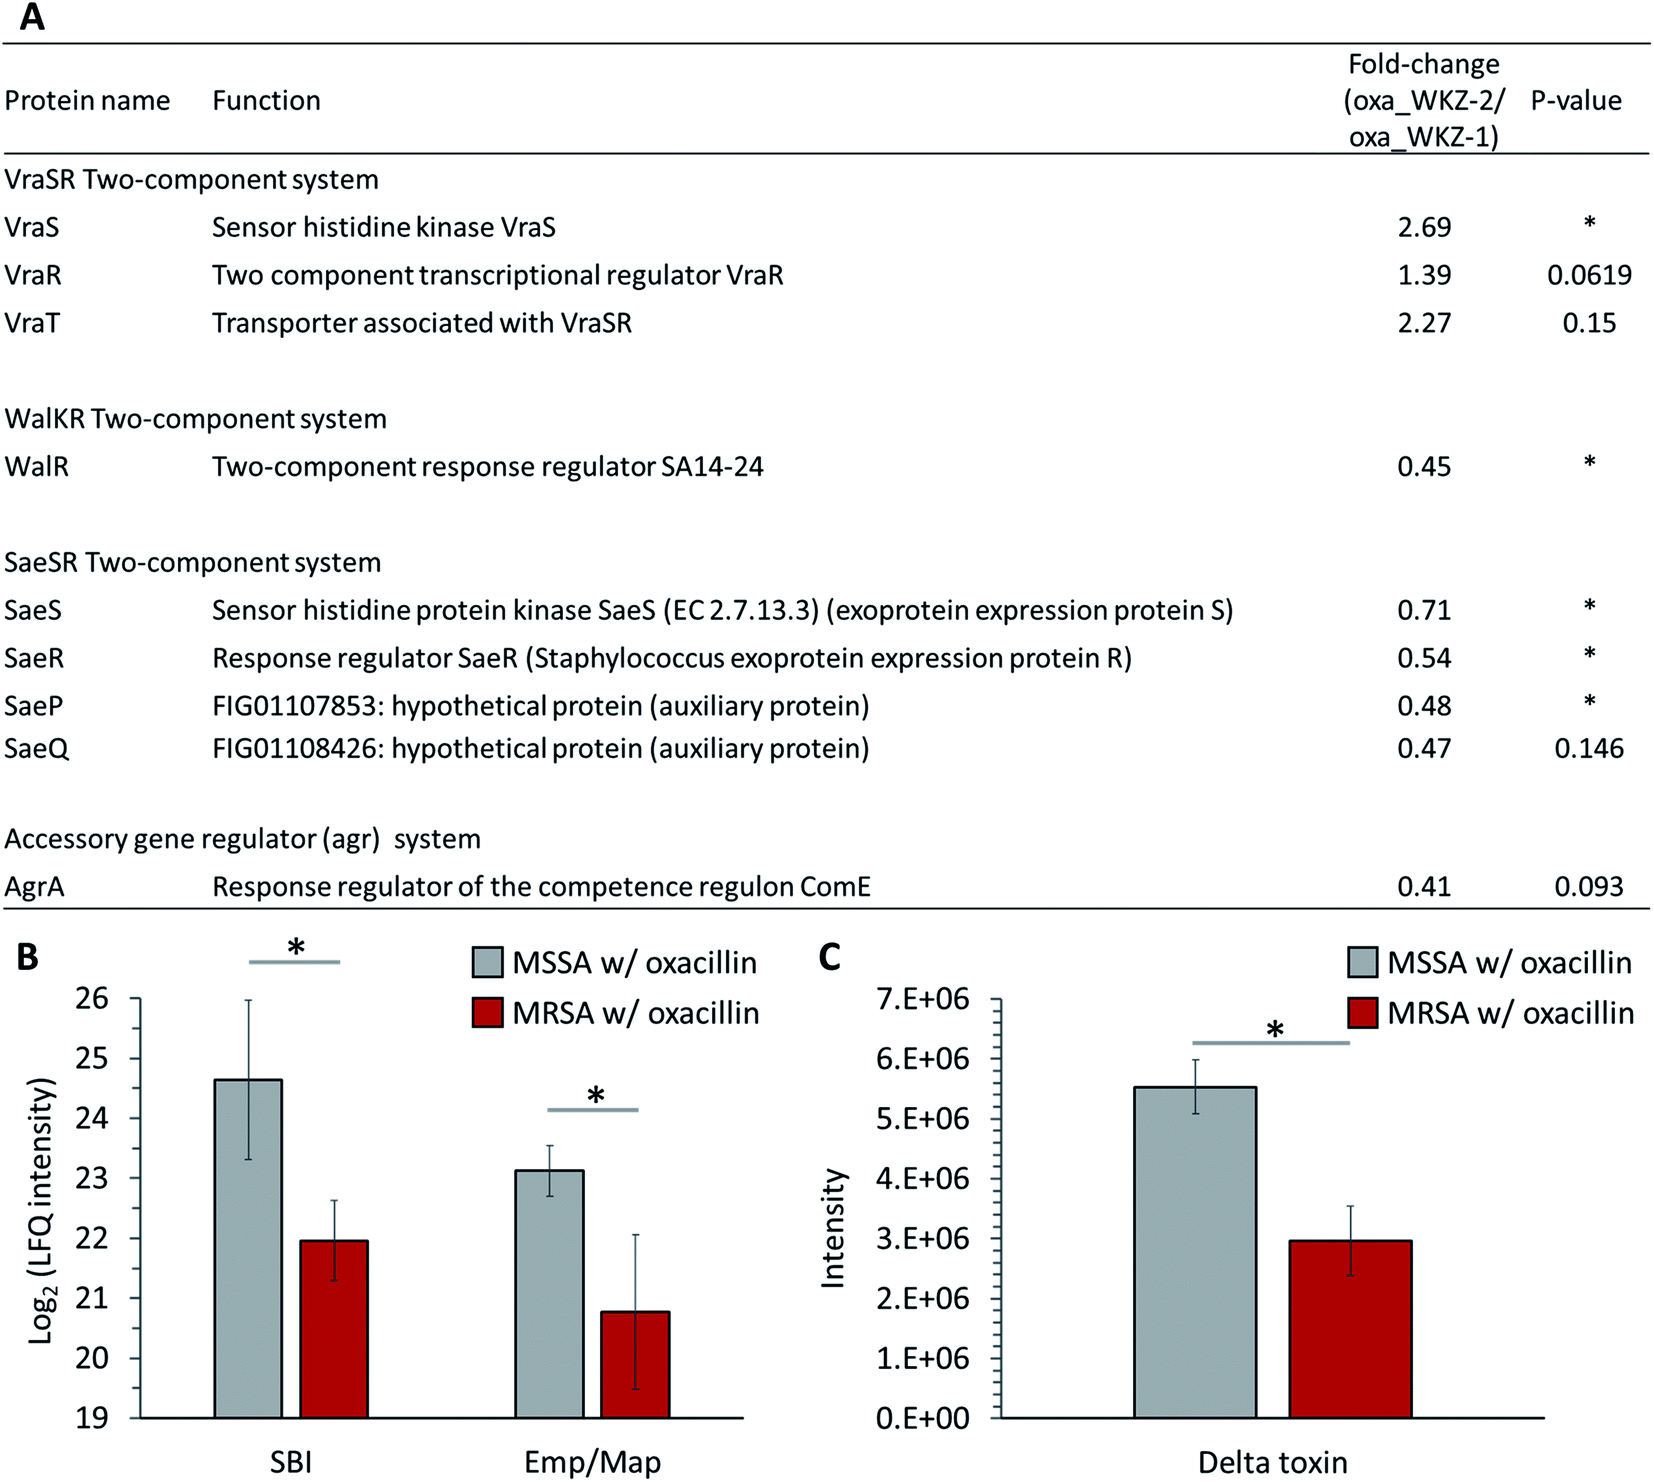 | ||
| Fig. 5 (A) Table of proteins belonging to two-component systems mentioned in this paper. The indicated protein functions were derived from the SEED server. Gray color indicates MSSA with oxacillin and red color indicates MRSA with oxacillin. (B) LFQ intensity levels of SBI and Emp/Map belong to virulence factors. (C) Quantitative analysis of the expression of delta toxin. Gray color indicates oxacillin treated MSSA and red color indicates oxacillin treated MRSA. The symbol (*) indicates a statistically significant difference (n = 4, p < 0.05). Error bars indicate standard deviation. | ||
Second, in our results, it was confirmed that WalR constituting the WalKR TCS was significantly reduced from oxacillin-treated MRSA than oxacillin-treated MSSA (WalK was not detected) (Fig. 5A). Furthermore, it was confirmed that WalR was down-regulated in oxacillin-treated MRSA compared to MRSA without oxacillin (Fig. S2†). Activation of WalKR positively regulates the expression of genes involved in cell wall turnover and degradation and up-regulates several major virulence factors by stimulating the SaeSR TCS.27 In particular, the previous experiment with the constitutively active form of WalR in S. aureus confirmed that the release of peptidoglycan increased.27 Therefore, these results show that MRSA down-regulates the WalKR TCS more than under normal conditions to reduce cell wall degradation to maintain an intact cell wall against oxacillin. It is predicted that the down-regulation of the WalRK TCS affected the expression of virulence factors by down-regulating the SaeRS TCS, which will be described later.
Third, down-regulation of the SaeRS TCS was observed (sensor histidine kinase SaeS, response regulator SaeR, and two auxiliary proteins (SaeP and SaeQ)) (Fig. 5A). The SaeRS TCS positively regulates over 20 virulence factors of S. aureus.28 These results are consistent with reports from previous studies that oxacillin reduces transcription by the P1 promoter, which can express all four genes belonging to the sae operon.28 Also, among these virulence factors, IgG-binding protein (SBI) and extracellular adherence protein of broad specificity (Eap/Map) were significantly reduced from oxacillin-treated MRSA than oxacillin-treated MSSA (Fig. 5B). Therefore, it can be predicted that MRSA reduces the expression of several virulence factors by down-regulating the SaeRS TCS when treated with oxacillin.
Fourth, down-regulation of the accessory gene regulator A (AgrA) belonging to the agr system was observed (Fig. 5A). The agr system regulates the expression of numerous virulence factors by responding to cell population density (i.e., quorum sensing).29,30 The agr system comprises RNA II including agrA and RNA III encoding hld gene (delta toxin).30 The reduction of AgrA level might be due to a down-regulation of the agr system.29 To validate the effect of down-regulation of the agr system, we quantitatively measured the extracellular delta toxin via LC-MS profiling. Interestingly, the level of delta toxin was also significantly reduced from oxacillin-treated MRSA than oxacillin-treated MSSA (Fig. 5C). This observation might support that the expression of PBP2a in MRSA interferes the agr system and oxacillin acts as a quorum-sensing inhibitor to MRSA.31
Taken together, MRSA seems to try to maintain cell integrity by up-regulating the peptidoglycan biosynthetic pathway and down-regulating the cell wall turnover and degradation pathways through the VraSR and WalKR TCS against oxacillin treatment (Fig. 6). Additionally, the down-regulation of the WalKR, SaeRS TCS, and agr system is expected to reduce the expression of several virulence factors.
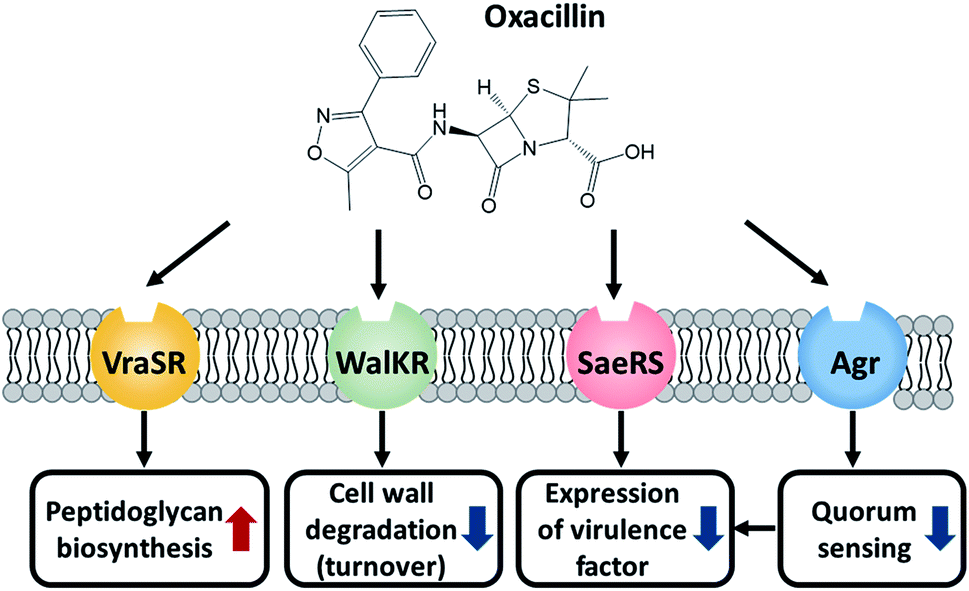 | ||
| Fig. 6 Illustration of the role of these TCSs and the effect of oxacillin. | ||
3.4 Oxidative stress
S. aureus expresses methionine sulfoxide reductases (Msr), which reduce methionine sulfoxide, against reactive oxygen species (ROS) to regain function that has been lost due to oxidation by ROS (Fig. 7B).32 There are two types of Msr enzymes (MsrA and MsrB), and three MsrA proteins (MsrA1, MsrA2 and MsrA3) and one MsrB protein is encoded in S. aureus.33 In our results, it was confirmed that MsrA1 and MsrB were significantly up-regulated in oxacillin-treated MRSA compared to oxacillin-treated MSSA (Fig. 7A) and were overproduced in the oxacillin-treated group compared to the control group (Fig. S3†). In previous studies, it was confirmed that S. aureus affected only the MsrA1 and MsrB loci among the four Msr genes when exposed to cell wall-active antibiotics, causing overproduction of MsrA1 and MsrB.33 These results are consistent with our results.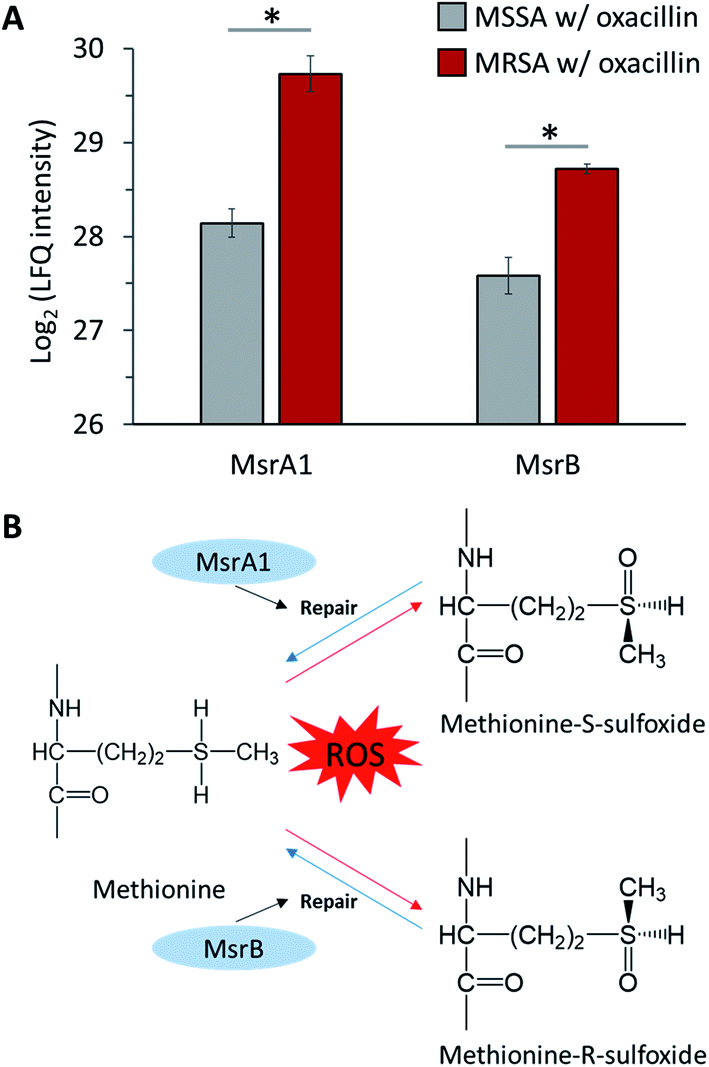 | ||
| Fig. 7 (A) LFQ intensity levels of MsrA1 and MsrB (Methionine sulfoxide reductases). Gray color indicates oxacillin treated MSSA and red color indicates oxacillin treated MRSA. The symbol (*) indicates a statistically significant difference (n = 4, p < 0.05). Error bars indicate standard deviation. (B) The mechanism of repair by methionine sulfoxide reductase against oxidative stress. | ||
In general, β-lactam antibiotics are believed to have a bactericidal effect by binding to PBPs to inhibit cell wall synthesis and induce cell lysis.34 On the other hand, evidence that β-lactam antibiotics inhibit pathogens without major bacteriolysis has been reported.35,36 Due to reports showing these opposite results, many studies have been conducted on the mechanism of inhibition of β-lactam antibiotics. In this context, studies have shown that β-lactam antibiotics contribute to growth inhibition through ROS production in several bacteria, including S. aureus.,37,38 and, more recently, studies showing that there is no correlation between antibiotics and ROS have also been published.39,40 These controversial research results exist, but recent evidence that antibiotics affect cell metabolism to generate ROS has been reported.41 Therefore, we assume that β-lactam antibiotics can induce ROS and affect cells in S. aureus and predict that MRSA resists ROS produced by oxacillin through Msr proteins.
3.5 Stringent response
The stringent response is a mechanism that regulates the expression of several genes by the synthesis of the alarmone (p)ppGpp and is induced by nutrient starvation and various environmental stresses.42 Our results confirmed that RelQ, an enzyme involved in the stringent response, was overproduced in oxacillin-treated MRSA and are consistent with previous studies that oxacillin induces RelQ expression (Fig. S4†).43 S. aureus harbors the (p)ppGpp synthetase Rel/SpoT homolog (RSH) and two small alarmone synthetase (RelQ and RelP).43 Among these proteins, RelQ was found to play a major role in mecA gene expression in the deletion mutant model, and an increase in β-lactam resistance was observed in the overexpression model of this protein.42 Therefore, our results show that the β-lactam resistance of MRSA is strongly associated with the stringent response mediated by RelQ.4. Conclusion
We observed the response to oxacillin more accurately by the proteomic and metabolomic approach using the clinical strains S. aureus WKZ-1 and WKZ-2, which are isogenic except for the presence of SCCmec type IV. First, it was confirmed that, as in previous microarray and proteomics data, cell wall integrity was maintained through the up-regulation of the peptidoglycan biosynthetic pathway. In particular, this pathway was double-checked with up-regulation of enzymes and consumption of metabolites involved in this pathway. Second, although, VraSR is already known for being up-regulated to increased peptidoglycan biosynthesis by cell wall inhibitors, our results confirmed that VraSR, WalKR, SaeSR, and agr system are regulated by oxacillin. It is speculated that MRSA regulates virulence and cell wall-related metabolism induced by oxacillin through TCS, and this phenomenon is consistent with previous studies using mutant models. Third, it was observed that methionine sulfoxide reductase, which is involved in oxidative stress, is up-regulated by oxacillin. For this reason, we propose that there may be a correlation between the oxacillin inhibition mechanism and oxidative stress, and Msr may affect these interactions. Last, the up-regulation of RelQ, an enzyme mediating the stringent response, which is known for having an important effect on antibiotic resistance, was observed. In summary, we propose the isogenic strain model, which has the advantage of confirming the response to antibiotics, and differentially regulated metabolic pathways of MRSA induced by oxacillin were identified using this model. Therefore, this study demonstrates the importance of using isogenic strains to investigate antibiotic mechanisms and indicates that multi-omic technologies are advantageous for studies of the mechanisms of action of antibiotics and responses to antibiotics. Furthermore, we will use this platform in future studies to discover control mechanisms and new targets for multidrug-resistant bacteria.Conflicts of interest
There are no conflicts to declare.Acknowledgements
This work was supported by the Basic Science Research Program through the National Research Foundation of Korea (NRF-2019M2C8A2058418, NRF-2018R1D1A1B07048185, NRF-2017M3A9E4077235, NRF-2017M3A9B6062989, NRF-2020R1A6A1A03044977) and a grant of the Korea Health Technology R&D Project through the Korea Health Industry Development Institute (KHIDI), funded by the Ministry of Health & Welfare, Republic of Korea (grant number: HP20C0210).References
- M. Otto, Int. J. Med. Microbiol., 2013, 303, 324–330 CrossRef.
- F. D. Lowy, N. Engl. J. Med., 1998, 339, 520–532 CrossRef CAS PubMed.
- J. Rutowski, F. Zhong, M. Xu and J. Zhu, J. Pharm. Biomed. Anal., 2019, 167, 140–148 CrossRef CAS.
- K. Dörries, R. Schlueter and M. Lalk, Antimicrob. Agents Chemother., 2014, 58, 7151–7163 CrossRef.
- P. D. Stapleton and P. W. Taylor, Sci. Prog., 2002, 85, 57–72 CrossRef CAS.
- E. Sauvage, F. Kerff, M. Terrak, J. A. Ayala and P. Charlier, FEMS Microbiol. Rev., 2008, 32, 234–258 CrossRef CAS PubMed.
- J. K. Rudkin, A. M. Edwards, M. G. Bowden, E. L. Brown, C. Pozzi, E. M. Waters, W. C. Chan, P. Williams, J. P. O'Gara and R. C. Massey, J. Infect. Dis., 2012, 205, 798–806 CrossRef CAS PubMed.
- X. Liu, Y. Hu, P.-J. Pai, D. Chen and H. Lam, J. Proteome Res., 2014, 13, 1223–1233 CrossRef CAS.
- S. Utaida, P. M. Dunman, D. Macapagal, E. Murphy, S. J. Projan, V. K. Singh, R. K. Jayaswal and B. J. Wilkinson, Microbiology, 2003, 149, 2719–2732 CrossRef CAS PubMed.
- A. L. A. Bloemendaal, E. C. Brouwer and A. C. Fluit, PLoS One, 2010, 5, e11841 CrossRef PubMed.
- I. Wiegand, K. Hilpert and R. E. W. Hancock, Nat. Protoc., 2008, 3, 163–175 CrossRef CAS.
- T. Brettin, J. J. Davis, T. Disz, R. A. Edwards, S. Gerdes, G. J. Olsen, R. Olson, R. Overbeek, B. Parrello, G. D. Pusch, M. Shukla, J. A. Thomason 3rd, R. Stevens, V. Vonstein, A. R. Wattam and F. Xia, Sci. Rep., 2015, 5, 8365 CrossRef PubMed.
- F. Cabanettes and C. Klopp, PeerJ, 2018, 6, e4958 CrossRef PubMed.
- J. Chong, O. Soufan, C. Li, I. Caraus, S. Li, G. Bourque, D. S. Wishart and J. Xia, Nucleic Acids Res., 2018, 46, W486–W494 CrossRef CAS.
- L. Niu, H. Zhang, Z. Wu, Y. Wang, H. Liu, X. Wu and W. Wang, PLoS One, 2018, 13 CAS.
- J. Cox, N. Neuhauser, A. Michalski, R. A. Scheltema, J. V. Olsen and M. Mann, J. Proteome Res., 2011, 10, 1794–1805 CrossRef CAS PubMed.
- J. Cox, M. Y. Hein, C. A. Luber, I. Paron, N. Nagaraj and M. Mann, Mol. Cell. Proteomics, 2014, 13, 2513–2526 CrossRef CAS PubMed.
- A. D. Shah, R. J. Goode, C. Huang, D. R. Powell and R. B. Schittenhelm, J. Proteome Res., 2020, 19, 204–211 CrossRef CAS PubMed.
- S. Fuchs, H. Mehlan, J. Bernhardt, A. Hennig, S. Michalik, K. Surmann, J. Pané-Farré, A. Giese, S. Weiss, L. Backert, A. Herbig, K. Nieselt, M. Hecker, U. Völker and U. Mäder, Int. J. Med. Microbiol., 2018, 308, 558–568 CrossRef PubMed.
- D. R. Kim, Y. Lee, H. K. Kim, W. Kim, Y. G. Kim, Y. H. Yang, J. S. Kim and H. S. Joo, Cells, 2020, 9, 788 CrossRef CAS PubMed.
- H. Cho, T. Uehara and T. G. Bernhardt, Cell, 2014, 159, 1300–1311 CrossRef CAS.
- R. M. Epand, C. Walker, R. F. Epand and N. A. Magarvey, Biochim. Biophys. Acta, Biomembr., 2016, 1858, 980–987 CrossRef CAS PubMed.
- M. H. Lin, C. C. Li, J. C. Shu, H. W. Chu, C. C. Liu and C. C. Wu, Proteomics, 2018, 18, 1700195 CrossRef.
- A. Jousselin, C. Manzano, A. Biette, P. Reed, M. G. Pinho, A. E. Rosato, W. L. Kelley and A. Renzoni, Antimicrob. Agents Chemother., 2015, 60, 1656–1666 CrossRef.
- S. Boyle-Vavra, S. Yin and R. S. Daum, FEMS Microbiol. Lett., 2006, 262, 163–171 CrossRef CAS.
- S. Boyle-Vavra, S. Yin, D. S. Jo, C. P. Montgomery and R. S. Daum, Antimicrob. Agents Chemother., 2013, 57, 83–95 CrossRef CAS.
- A. Delauné, S. Dubrac, C. Blanchet, O. Poupel, U. Mäder, A. Hiron, A. Leduc, C. Fitting, P. Nicolas, J.-M. Cavaillon, M. Adib-Conquy and T. Msadek, Infect. Immun., 2012, 80, 3438–3453 CrossRef.
- Q. Liu, W.-S. Yeo and T. Bae, Genes, 2016, 7, 81 CrossRef.
- K. Y. Le and M. Otto, Front. Microbiol., 2015, 6 Search PubMed.
- D. Bronesky, Z. Wu, S. Marzi, P. Walter, T. Geissmann, K. Moreau, F. Vandenesch, I. Caldelari and P. Romby, Annu. Rev. Microbiol., 2016, 70, 299–316 CrossRef CAS PubMed.
- E. M. Waters, J. K. Rudkin, S. Coughlan, G. C. Clair, J. N. Adkins, S. Gore, G. Xia, N. S. Black, T. Downing, E. O'Neill, A. Kadioglu and J. P. O'Gara, J. Infect. Dis., 2016, 215, 80–87 CrossRef PubMed.
- J. Moskovitz, B. S. Berlett, J. M. Poston and E. R. Stadtman, Proc. Natl. Acad. Sci. U. S. A., 1997, 94, 9585–9589 CrossRef CAS PubMed.
- K. Singh and V. K. Singh, Int. J. Microbiol., 2012, 2012 Search PubMed.
- A. Tomasz, Rev. Infect. Dis., 1986, 8, S260–S278 CrossRef CAS.
- T. D. McDowell and C. L. Lemanski, J. Bacteriol., 1988, 170, 1783–1788 CrossRef CAS PubMed.
- P. Moreillon, Z. Markiewicz, S. Nachman and A. Tomasz, Antimicrob. Agents Chemother., 1990, 34, 33–39 CrossRef CAS.
- Y. Liu, X. Liu, Y. Qu, X. Wang, L. Li and X. Zhao, Antimicrob. Agents Chemother., 2012, 56, 6048–6050 CrossRef CAS PubMed.
- J. J. Foti, B. Devadoss, J. A. Winkler, J. J. Collins and G. C. Walker, Science, 2012, 336, 315–319 CrossRef CAS.
- Y. Liu and J. A. Imlay, Science, 2013, 339, 1210–1213 CrossRef CAS.
- I. Keren, Y. Wu, J. Inocencio, L. R. Mulcahy and K. Lewis, Science, 2013, 339, 1213–1216 CrossRef CAS PubMed.
- L. Léger, A. Budin-Verneuil, M. Cacaci, A. Benachour, A. Hartke and N. Verneuil, Cell Rep., 2019, 29, 2184–2191 CrossRef PubMed.
- A. Bhawini, P. Pandey, A. P. Dubey, A. Zehra, G. Nath and M. N. Mishra, Front. Microbiol., 2019, 10, 339 CrossRef PubMed.
- T. Geiger, B. Kästle, F. L. Gratani, C. Goerke and C. Wolz, J. Bacteriol., 2014, 196, 894–902 CrossRef.
Footnote |
| † Electronic supplementary information (ESI) available. See DOI: 10.1039/d0ra05407k |
| This journal is © The Royal Society of Chemistry 2020 |