 Open Access Article
Electrocatalytic reduction of oxygen at platinum nanoparticles dispersed on electrochemically reduced graphene oxide/PEDOT:PSS composites†
Teklewold Getachew*a,
Fitsum Addisa,
Solomon Mehretiea,
Hin-Lap Yip b,
Ruidong Xiab and
Shimelis Admassie
 ab
ab
aDepartment of Chemistry, Addis Ababa University, PBox 1176, Addis Ababa, Ethiopia. E-mail: teklewold.getachew@aau.edu.et
bState Key Laboratory of Luminescent Materials and Devices, Institute of Polymer Optoelectronic Materials and Devices, School of Materials Science and Engineering, South China University of Technology, 381 Wushan Road, Guangzhou, 510640, PR China
First published on 18th August 2020
Abstract
Composites of commercially available graphene oxide (GO) and poly(3,4-ethylenedioxythiophene):poly(styrenesulfonate) (PEDOT:PSS) with solvent additive ethylene glycol (EG) were investigated as an alternative support for Pt nanoparticles towards the electrocatalytic reduction of oxygen. The surface characteristics of the materials were examined using atomic force microscopy (AFM), X-ray diffraction (XRD), field-emission scanning electron microscopy (FESEM), and energy dispersive X-ray spectroscopy (EDS). Cyclic voltammetry (CV) and linear sweep voltammetry (LSV) at rotating disk electrodes (RDEs) and rotating ring-disk electrodes (RRDEs) were used to characterise the electrocatalytic activities of the composites materials. The structural and electrochemical studies reveal that the addition of EG favours the homogeneous distribution of Pt particles with reduced particle size and improves the electrocatalytic properties. A 30% and 16% increase in electrochemically active surface area (ECSA), a 1.2 and 1.1 fold increase in specific area activity (SA), and a 1.5 and 1.2 fold increase in mass activity (MA) were observed for 30% and 40% Pt loading on PEDOT:PSS after the addition of EG. A composite of rGO and PEDOT:PSS(EG) was investigated for different (w/w) ratios of PEDOT:PSS and rGO. The 1![[thin space (1/6-em)]](https://www.rsc.org/images/entities/char_2009.gif) :
:![[thin space (1/6-em)]](https://www.rsc.org/images/entities/char_2009.gif) 2 w/w ratio showed an enhanced catalytic activity with high limiting current, more positive onset potential, higher SA and MA with lower H2O2 yield compared to PEDOT:PSS(EG) and rGO and previously reported values for PEDOT:PSS.
2 w/w ratio showed an enhanced catalytic activity with high limiting current, more positive onset potential, higher SA and MA with lower H2O2 yield compared to PEDOT:PSS(EG) and rGO and previously reported values for PEDOT:PSS.
Introduction
Commercialization and widespread application of fuel cells and metal–air batteries in different sectors require the development of catalyst materials with low cost and satisfactory activity and stability.1,2 In all these applications, the oxygen reduction reaction (ORR) at the cathode is the major contributor to single-cell efficiency losses due to its slow kinetics. Hence, platinum (Pt) and Pt-based alloys are commonly employed catalysts to improve the kinetics of the ORR.2,3 However, the cost of Pt is very high and its supply is limited.4 To circumvent this problem, several authors investigated and reported non-Pt based catalysts,5,6 while others used Pt-dispersed nanoparticles on different supports1,2 to reduce the amount of Pt-loading. The dispersion of Pt on catalyst supports not only reduces the cost of the noble metals but also improves the efficiency of the electrocatalysts.7,8 Higher catalytic activity on a support matrix requires nanometric dimensions with a uniform distribution of Pt particles.9 Hence, an ideal Pt catalyst support material needs to have several properties including high surface area, good electronic conductivity and electrochemical stability, strong cohesion to catalyst particles and the ability to homogeneously distribute uniformly sized nanoparticles.10,11Various carbon-based materials such as carbon blacks, carbon nanotubes, carbon nanofibers, multiwall carbon nanotubes, conducting polymers and graphene have been extensively investigated as Pt supports for ORR.1,8,9,12–14 Among these, graphene (or reduced graphene oxide, rGO) has become more attractive in recent years due to its unique physicochemical properties, like excellent conductivity, high charge-carrier mobility, good transparency, great mechanical flexibility, and huge specific surface area (theoretically 2630 m2 g−1 for a single layer).10,13–15 However, weak interaction of graphene with metals and restacking of graphene sheets due to pi–pi interaction are still some of the problems that are hindering its application as electrocatalyst support for Pt nanoparticles.11,14 On the other hand, conducting polymers, which are good catalysts for ORR and support materials for the dispersion of Pt metal catalysts, prevent aggregation of graphene sheets and particle agglomeration in addition to their high accessible surface area, low resistance and high stability in three-dimensional structure.15–18
Among conducting polymers, PEDOT:PSS is one of the most versatile and commercially available polymers successfully used in many different applications like organic solar cells, organic light emitting diodes, energy storage, transistors and sensors.19 It can also be promising support material for Pt particle dispersion due to its chemical stability, dispersibility in water and some organic solvents, tunable conductivity and electrochemical performance.20,21 Though, dependent on the method of synthesis and microstructures, PEDOT22,23 and PEDOT:PSS24 also shows electrocatalytic activity for ORR. Since the electrocatalytic ORR on Pt in acidic solution is a proton-coupled electron transfer reaction,25 PEDOT:PSS, which has a polyanionic phase (PSS) will promote proton transport. The conducting polymer phase (PEDOT) further ensures electronic transport.26 Moreover, the high boiling point polar organic compounds like ethylene glycol added into PEDOT:PSS aqueous solution to improve its conductivity27 is known to improve the activity of Pt-supported catalyst by decreasing the average particle size, inhibition of growth of Pt particle, and evenly dispersion of Pt particle.28 Hence, a composite of rGO and PEDOT:PSS treated with ethylene glycol combined the best features of each material. As part of numerous effort in the search for reducing the amount of Pt used in the electrocatalytic reduction of oxygen, herein, we report the potential application of commercially available GO and PEDOT:PSS composites with solvent additive EG as an alternative support for Pt nanoparticles towards ORR.
Experimental
Materials
Potassium nitrate (Riedel de Haen), potassium hexacyanoferrate(III) (Riedel de Haen), ethylene glycol (Sigma-Aldrich), sodium sulfate (Sigma-Aldrich), 5 wt% Nafion solution (Sigma-Aldrich), 4.0 mg mL−1 graphene oxide dispersion in water (Sigma-Aldrich), 70% perchloric acid (Fluka), 98% sulfuric acid (Carlo Erba Reagents), hexachloroplatinic acid (Research Lab Fine Chem Industries) and Clevios PH1000 (PEDOT:PSS) (Heraeus) were used for the preparation of electrolyte solutions and inks for the modified glassy carbon electrode (GCE). Nitrogen and oxygen gases were purchased in cylinders from Chora gas & chemical product factory (Addis Ababa). Deionized (DI) water was used throughout the experiment.Preparation of the modified glassy GCE
The Pt support were first prepared by drop casting 3 μL of PEDOT:PSS without EG (PEDOT:PSS), PEDOT:PSS (PEDOT:PSS(EG)) and rGO/PEDOT PSS with EG (rGO/PEDOT PSS(EG)) onto a 0.196 cm2 GCE (polished with 0.05 μm alumina powder). 6 vol% EG which is optimal concentration to improve the conductivity was added on PEDOT:PSS.29 The addition of EG induces a conformational change in the PEDOT chain from a benzoid with a preferred coiled structure to a quinoid with a preferred linear or expanded-coil structure. This conformational change results in an increase in the intrachain and interchain charge-carrier mobility, so the conductivity is enhanced.27 The films were then dried under room temperature overnight. The GO![[thin space (1/6-em)]](https://www.rsc.org/images/entities/char_2009.gif) :
:![[thin space (1/6-em)]](https://www.rsc.org/images/entities/char_2009.gif) PEDOT:PSS(EG) composites were prepared by mixing solution of GO and PEDOT:PSS(EG) in weight ratios of 2
PEDOT:PSS(EG) composites were prepared by mixing solution of GO and PEDOT:PSS(EG) in weight ratios of 2![[thin space (1/6-em)]](https://www.rsc.org/images/entities/char_2009.gif) :
:![[thin space (1/6-em)]](https://www.rsc.org/images/entities/char_2009.gif) 1, 1
1, 1![[thin space (1/6-em)]](https://www.rsc.org/images/entities/char_2009.gif) :
:![[thin space (1/6-em)]](https://www.rsc.org/images/entities/char_2009.gif) 1, 1
1, 1![[thin space (1/6-em)]](https://www.rsc.org/images/entities/char_2009.gif) :
:![[thin space (1/6-em)]](https://www.rsc.org/images/entities/char_2009.gif) 2, 1
2, 1![[thin space (1/6-em)]](https://www.rsc.org/images/entities/char_2009.gif) :
:![[thin space (1/6-em)]](https://www.rsc.org/images/entities/char_2009.gif) 3 and 1
3 and 1![[thin space (1/6-em)]](https://www.rsc.org/images/entities/char_2009.gif) :
:![[thin space (1/6-em)]](https://www.rsc.org/images/entities/char_2009.gif) 5 (GO
5 (GO![[thin space (1/6-em)]](https://www.rsc.org/images/entities/char_2009.gif) :
:![[thin space (1/6-em)]](https://www.rsc.org/images/entities/char_2009.gif) PEDOT:PSS(EG)). The electrochemical reduction of GO to rGO was carried out with CV in the potential range 0 to −1.5 V vs. Ag/AgCl at a scan rate of 50 mV s−1 in N2 saturated 0.1 M Na2SO4 for 20 cycles. 30 Pt particles were then electrodeposited onto PEDOT:PSS, PEDOT:PSS(EG) and rGO/PEDOT:PSS(EG) potentiostatically from a 5 mM H2PtCl6 in 0.5 M H2SO4 by applying a potential of −0.15 V (vs. Ag/AgCl) until the amount of charge consumed to reduce Pt(IV) to Pt(0) were 10% (mPt = 3.6 μg), 20% (mPt = 8.1 μg), 30% (mPt = 13.85 μg) and 40% (mPt = 21.6 μg) of the total mass the catalytic material assuming 100% current efficiency.31,32 The quantity of electricity associated with double-layer charging and the reduction of surface oxide is obtained by integration in the double layer region and subtracted from the total charge for determining the mass of platinum loading. 32 3 μL of Nafion (0.05%) dropped on the catalyst film as a binder.33
PEDOT:PSS(EG)). The electrochemical reduction of GO to rGO was carried out with CV in the potential range 0 to −1.5 V vs. Ag/AgCl at a scan rate of 50 mV s−1 in N2 saturated 0.1 M Na2SO4 for 20 cycles. 30 Pt particles were then electrodeposited onto PEDOT:PSS, PEDOT:PSS(EG) and rGO/PEDOT:PSS(EG) potentiostatically from a 5 mM H2PtCl6 in 0.5 M H2SO4 by applying a potential of −0.15 V (vs. Ag/AgCl) until the amount of charge consumed to reduce Pt(IV) to Pt(0) were 10% (mPt = 3.6 μg), 20% (mPt = 8.1 μg), 30% (mPt = 13.85 μg) and 40% (mPt = 21.6 μg) of the total mass the catalytic material assuming 100% current efficiency.31,32 The quantity of electricity associated with double-layer charging and the reduction of surface oxide is obtained by integration in the double layer region and subtracted from the total charge for determining the mass of platinum loading. 32 3 μL of Nafion (0.05%) dropped on the catalyst film as a binder.33
For comparison purposes, a thin-film electrode made from a commercial 20 wt% Pt/C catalyst (ETEK) were deposited on rotating glassy carbon electrode with Pt loading of 20 μgPt cm−2. 10 mg of a 20 wt% Pt/C catalyst (ETEK), 1 mL of isopropanol, 3.98 mL of deionized water and 20 μL of 5 wt% Nafion ionomer solution were mixed, ultrasonicated for 60 minutes in a water bath for the catalytic ink formation. 10 μL of the resulting suspension was dropped on glassy carbon disc electrode (0.196 cm2) dried using solvent evaporation by covering the catalyst ink-coated electrode with a beaker to get smooth and crack free film.36
Physical characterization
XRD spectra of the catalysts were collected using Rigaku Smart Lab SE X-ray diffractometer (Cu-Kα radiation at λ = 0.15406 nm). The average crystallite size of the nanoparticles was estimated using the Debye–Scherrer eqn (1):28,34
 | (1) |
AFM was used to study the sample's surface morphology and dispersion of Pt nanoparticles on PEDOT:PSS and PEDOT:PSS(EG) using a Nanotec Electronica SPM with and without the EG. The images were processed with WsxM software (v3.1).
The morphology of rGO/PEDOT:PSS(EG)/Pt was characterized by a FESEM (Hitachi, S-4800) and an EDS (HORIBA, EX-250) coupled on the FESEM was used to confirm the component of the rGO/PEDOT:PSS(EG)/Pt.
Electrochemical characterization
 | (2) |
 | (3) |
 | (4) |
 | (5) |
 | (6) |
 | (7) |
 | (8) |
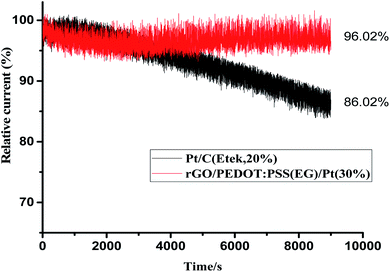
![[thin space (1/6-em)]](https://www.rsc.org/images/entities/char_2009.gif) 000 s.
000 s.Results and discussion
Surface characterization
The crystalline structure of Pt nanoparticles dispersed on to PEDOT:PSS/Pt(30%), PEDOT:PSS (EG)/Pt(30%) and rGO/PEDOT:PSS(EG)/Pt(30%) were investigated by XRD studies. Fig. 1 shows the XRD patterns of PEDOT:PSS/Pt(30%), PEDOT:PSS(EG)/Pt(30%) and rGO/PEDOT:PSS(EG)/Pt(30%) films. A broad peak (Fig. 1a) at 25° observed in all materials correspond to the (020) plane of PEDOT:PSS.41 The peaks at 2θ = 39.9°, 46.5°, 67.7°, and 81.9° correspond to the diffraction planes (111), (200), (220), and (311) of Pt, respectively.15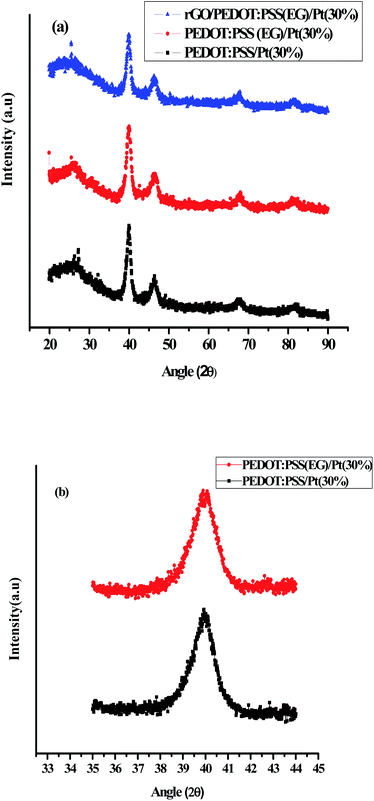 | ||
| Fig. 1 XRD patterns of (a): PEDOT:PSS/Pt(30%), PEDOT:PSS(EG)/Pt(30%), and rGO/PEDOT:PSS(EG)/Pt(30%) (b): over a narrow range of 2θ (35–44 degrees) for PEDOT:PSS/Pt(30%) and PEDOT:PSS(EG)/Pt(30%). | ||
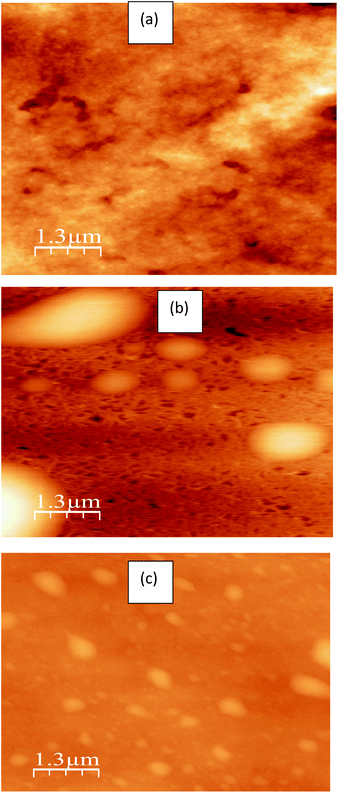
The average crystallite size of PEDOT:PSS supported Pt was calculated from the broadening of the (111) diffraction peak using Debye–Scherrer eqn (1) and Fig. 1b. The average crystallite size of Pt obtained by using EG is 7.3 nm which is smaller compared to the deposition of Pt in the absence of EG (7.9 nm). But, the incorporation of rGO further increased the average crystallite size of Pt supported on rGO/PEDOT:PSS(EG) to 7.9 nm. The AFM images for PEDOT:PSS/Pt (Fig. 2b) and PEDOT:PSS(EG)/Pt (Fig. 2c) shows small cluster of particles not shown in PEDOT:PSS (Fig. 2a) confirming the deposition of Pt particle on PEDOT:PSS films. PEDOT:PSS(EG)/Pt (Fig. 2c) film shows small Pt nanoparticles and a full coverage of the Pt particle compared to PEDOT:PSS/Pt (Fig. 2b). The incorporation of EG in PEDOT:PSS not only minimizes the rate of growth of Pt clusters during electrodeposition but also improves distribution of Pt particles.42
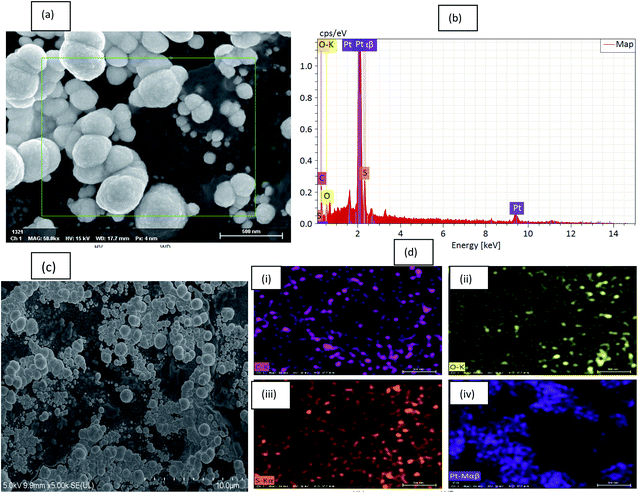
To further reveal the electrodeposition of the Pt particles, FESEM/EDS spectra were recorded for the composite material. A typical SEM image and selected rectangular area used for EDS studies of Pt deposited on rGO/PEDOT:PSS(EG) are shown in Fig. 3a. The EDS reveals the presence of carbon (from PEDOT and rGO), sulfur (from PEDOT and PSS), oxygen (from PEDOT:PSS, rGO and EG) and Pt nanoparticles. Fig. 3c shows SEM images depicting a heterogeneous morphology for a rGO/PEDOT:PSS(EG)/Pt. The composite reveals globular microstructure characteristic of PEDOT and a wrinkled morphology which is a characteristic feature of rGO. The lighter areas are agglomerated Pt particles homogenously distributed onto the surface as confirmed by EDS data (Fig. 3b). Electrochemically deposited Pt nanoparticles tend to agglomerate instead of dispersed nanoparticles on the surface of the substrate.9 The elemental mapping images of (Fig. 3d) reveals a homogeneous distribution of C, O and S (Fig. 3d(i–iii)) throughout the composite while some larger aggregated Pt within the mapped area is observed (Fig. 3d(iv)).
Electrochemical characterisation
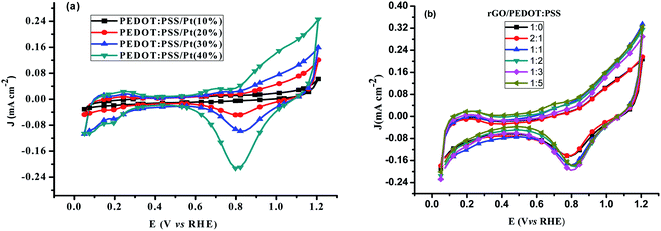 | ||
| Fig. 4 Cyclic voltammograms of (a) different wt% Pt catalyst on PEDOT:PSS (b) rGO:PEDOT:PSS(EG)/Pt(30%) catalyst in N2 saturated 0.1 M HClO4 at scan rate of 20 mV s−1. | ||
The oxide reduction peak in Fig. 4b increase when PEDOT:PSS(EG) was added to rGO until the w/w ratio is 1![[thin space (1/6-em)]](https://www.rsc.org/images/entities/char_2009.gif) :
:![[thin space (1/6-em)]](https://www.rsc.org/images/entities/char_2009.gif) 3 and reduced on further addition of PEDOT:PSS (1
3 and reduced on further addition of PEDOT:PSS (1![[thin space (1/6-em)]](https://www.rsc.org/images/entities/char_2009.gif) :
:![[thin space (1/6-em)]](https://www.rsc.org/images/entities/char_2009.gif) 5). The reduction peak potential is also shifted to more positive value with a maximum shift of about 30 mV for 1
5). The reduction peak potential is also shifted to more positive value with a maximum shift of about 30 mV for 1![[thin space (1/6-em)]](https://www.rsc.org/images/entities/char_2009.gif) :
:![[thin space (1/6-em)]](https://www.rsc.org/images/entities/char_2009.gif) 2 ratio. The real surface area (Ar) of platinum determined by charge integration under the hydrogen adsorption peaks increased from 0.5 cm2 to 0.8 cm2 as the amount of rGO/PEDOT:PSS ratio increased from 1
2 ratio. The real surface area (Ar) of platinum determined by charge integration under the hydrogen adsorption peaks increased from 0.5 cm2 to 0.8 cm2 as the amount of rGO/PEDOT:PSS ratio increased from 1![[thin space (1/6-em)]](https://www.rsc.org/images/entities/char_2009.gif) :
:![[thin space (1/6-em)]](https://www.rsc.org/images/entities/char_2009.gif) 0 to 1
0 to 1![[thin space (1/6-em)]](https://www.rsc.org/images/entities/char_2009.gif) :
:![[thin space (1/6-em)]](https://www.rsc.org/images/entities/char_2009.gif) 5.
5.
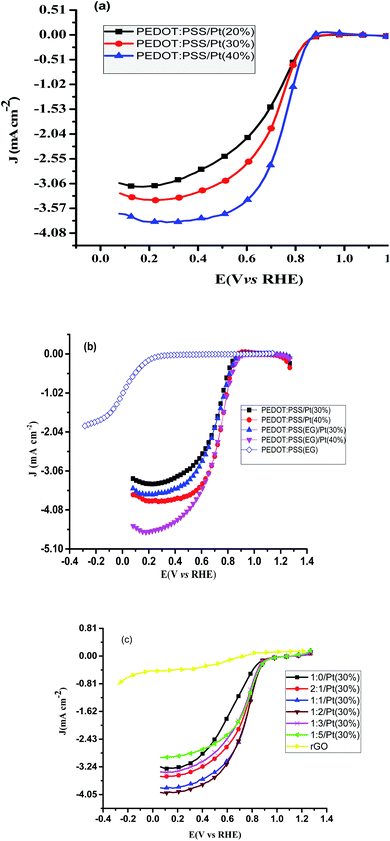
Hence, using this pronounced effect of EG at 30% Pt loading different ratio of rGO and PEDOT:PSS(EG) were further investigated. Typical background-corrected polarisation curves for the rGO and rGO/PEDOT:PSS(EG) composite supported catalyst in 0.1 M HClO4 at 1600 rpm are shown in Fig. 5c. More positive onset potentials and higher limiting current densities were obtained as the percentage of PEDOT:PSS increased from 1![[thin space (1/6-em)]](https://www.rsc.org/images/entities/char_2009.gif) :
:![[thin space (1/6-em)]](https://www.rsc.org/images/entities/char_2009.gif) 0 to 1
0 to 1![[thin space (1/6-em)]](https://www.rsc.org/images/entities/char_2009.gif) :
:![[thin space (1/6-em)]](https://www.rsc.org/images/entities/char_2009.gif) 2. Increasing the percentage of PEDOT:PSS beyond 1
2. Increasing the percentage of PEDOT:PSS beyond 1![[thin space (1/6-em)]](https://www.rsc.org/images/entities/char_2009.gif) :
:![[thin space (1/6-em)]](https://www.rsc.org/images/entities/char_2009.gif) 2 to 1
2 to 1![[thin space (1/6-em)]](https://www.rsc.org/images/entities/char_2009.gif) :
:![[thin space (1/6-em)]](https://www.rsc.org/images/entities/char_2009.gif) 3 and 1
3 and 1![[thin space (1/6-em)]](https://www.rsc.org/images/entities/char_2009.gif) :
:![[thin space (1/6-em)]](https://www.rsc.org/images/entities/char_2009.gif) 5 lowers the onset potential and limiting current density. Hence, rGO/PEDOT:PSS(EG) (1
5 lowers the onset potential and limiting current density. Hence, rGO/PEDOT:PSS(EG) (1![[thin space (1/6-em)]](https://www.rsc.org/images/entities/char_2009.gif) :
:![[thin space (1/6-em)]](https://www.rsc.org/images/entities/char_2009.gif) 2)/Pt 30% which gave a 2.2 and 2.9 fold increase in the SA and MA at 0.81 V, respectively, was found to be the optimum composition. rGO modified GC electrode (Fig. 5C) shows a clear reduction pre-wave at low overpotential, followed by a second reduction wave starting at around −0.013 V, which is indicative of a prevalent 2e reduction pathway.30 The onset potential and the current density are remarkably improved after platinum is deposited on rGO.
2)/Pt 30% which gave a 2.2 and 2.9 fold increase in the SA and MA at 0.81 V, respectively, was found to be the optimum composition. rGO modified GC electrode (Fig. 5C) shows a clear reduction pre-wave at low overpotential, followed by a second reduction wave starting at around −0.013 V, which is indicative of a prevalent 2e reduction pathway.30 The onset potential and the current density are remarkably improved after platinum is deposited on rGO.
The mass transport corrected Tafel plots (log|jk| vs. E) for PEDOT:PSS/Pt, PEDOT:PSS(EG)/Pt, and rGO/PEDOT:PSS(EG)/Pt are shown in Fig. 6. The figures show a transition in the Tafel slope from 60 mV per decade to 120 mV per decade for all the catalysts. The observed Tafel slope of ∼60 mV per decade at low overpotentials is associated to an oxygen reduction process on an oxide-covered Pt, and the 120 mV per decade slope at higher overpotentials is related to reduction process taking place on oxide-free Pt surfaces.45 The addition of EG reduces the Tafel slope for both the 30 and 40% Pt loading (Table 1) which confirms more favourable kinetics for ORR.46
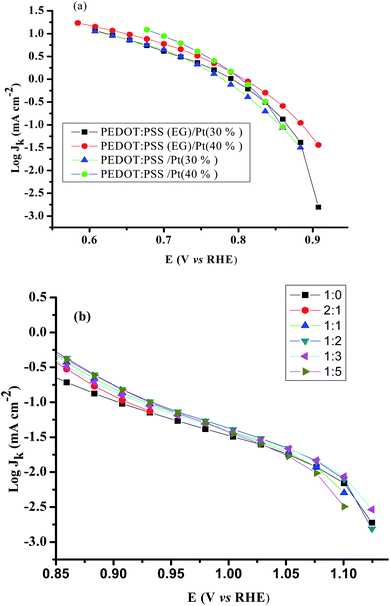 | ||
| Fig. 6 Mass transport corrected Tafel plots for (a) PEDOT:PSS/Pt, PEDOT:PSS(EG)/Pt and. (b) rGO/PEDOT:PSS(EG)/Pt obtained from disk current in the cathodic sweep at 1600 rpm. Scan rate: 20 mV s−1. | ||
| Samples | Pt loading (μg cm−2) | Ar (cm2) | ECSA (m2 g−1) | Tafel slope (mV dec−1) lcd/hcd | n | SA (μA cmPt−2) | MA (mA mgPt −1) 0.8 V | Reference |
|---|---|---|---|---|---|---|---|---|
| a Lcd/hcd – low current density/high current density.b Rotational rate = 750 rpm, E (V vs. RHE) = 0.836.c Rotational rate = 1000 rpm, E (V vs. RHE) = 0.8.d Rotational rate = 400 rpm, E (V vs. RHE) = 0.836.e Rotational rate = 900 rpm, E (V vs. RHE) = 0.836. | ||||||||
| Pt/C (pulse current deposition), (EG) | 55 | 1.83 | 16.9 | — | — | 33c | 5.6c | 28 |
| PEDOT:PSS/Pt | 73 | 0.8 | 15.5 | 66/159 | — | 17b | — | 43 |
| PEDOT:PSS/Pt | 138 | 1.5 | 15.37 | 90/200 | 3.7 | 87b | — | 43 |
| PEDOT:PSS/Pt(30%) | 71 | 0.41 | 2.93 | 68/154 | 3.46 | 132d, 156e | 4.62e | This work |
| PEDOT:PSS/Pt(40%) | 110 | 0.526 | 2.32 | 70/133 | 3.71 | 137d, 291e | 7.1e | This work |
| PEDOT:PSS(EG)/Pt(30%) | 71 | 0.526 | 3.8 | 61/146 | 3.75 | 144d, 175e | 6.65e | This work |
| PEDOT:PSS(EG)/Pt(40%) | 110 | 0.61 | 2.68 | 62/120 | 3.91 | 262d, 376e | 10.61e | This work |
rGO/PEDOT:PSS(EG) (1![[thin space (1/6-em)]](https://www.rsc.org/images/entities/char_2009.gif) : :![[thin space (1/6-em)]](https://www.rsc.org/images/entities/char_2009.gif) 2)/Pt(30%) 2)/Pt(30%) |
71 | 0.65 | 4.72 | 66/125 | 3.93 | 158d, 188e | 10.54e | This work |
![[thin space (1/6-em)]](https://www.rsc.org/images/entities/char_2009.gif) :
:![[thin space (1/6-em)]](https://www.rsc.org/images/entities/char_2009.gif) 0, 2
0, 2![[thin space (1/6-em)]](https://www.rsc.org/images/entities/char_2009.gif) :
:![[thin space (1/6-em)]](https://www.rsc.org/images/entities/char_2009.gif) 1, 1
1, 1![[thin space (1/6-em)]](https://www.rsc.org/images/entities/char_2009.gif) :
:![[thin space (1/6-em)]](https://www.rsc.org/images/entities/char_2009.gif) 1, 1
1, 1![[thin space (1/6-em)]](https://www.rsc.org/images/entities/char_2009.gif) :
:![[thin space (1/6-em)]](https://www.rsc.org/images/entities/char_2009.gif) 2, 1
2, 1![[thin space (1/6-em)]](https://www.rsc.org/images/entities/char_2009.gif) :
:![[thin space (1/6-em)]](https://www.rsc.org/images/entities/char_2009.gif) 3 and 1
3 and 1![[thin space (1/6-em)]](https://www.rsc.org/images/entities/char_2009.gif) :
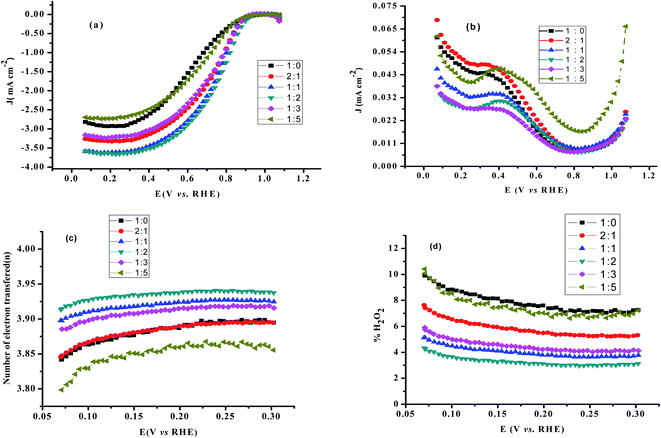
:![[thin space (1/6-em)]](https://www.rsc.org/images/entities/char_2009.gif) 5 as shown in Fig. 7c which confirms the improvement of the electrocatalytic activity of rGO up on the addition of PEDOT:PSS(EG). The percentage of H2O2 generated was quantified using eqn (7) and found to be 7.9% for 1
5 as shown in Fig. 7c which confirms the improvement of the electrocatalytic activity of rGO up on the addition of PEDOT:PSS(EG). The percentage of H2O2 generated was quantified using eqn (7) and found to be 7.9% for 1![[thin space (1/6-em)]](https://www.rsc.org/images/entities/char_2009.gif) :
:![[thin space (1/6-em)]](https://www.rsc.org/images/entities/char_2009.gif) 0 composition and significantly reduced to 3.3% for 1
0 composition and significantly reduced to 3.3% for 1![[thin space (1/6-em)]](https://www.rsc.org/images/entities/char_2009.gif) :
:![[thin space (1/6-em)]](https://www.rsc.org/images/entities/char_2009.gif) 2 composition (Fig. 7d). Hence, the 1
2 composition (Fig. 7d). Hence, the 1![[thin space (1/6-em)]](https://www.rsc.org/images/entities/char_2009.gif) :
:![[thin space (1/6-em)]](https://www.rsc.org/images/entities/char_2009.gif) 2 composition (rGO/PEDOT:PSS(EG)/Pt) exhibits the largest limiting current density (on the disk electrode), the most positive onset potential, and the lowest % H2O2 indicating an excellent ORR activity via the 4-electron pathway. The detection of hydrogen peroxide at potentials below 0.8 V in Fig. 7b indicates that the two-electron pathway does in fact occur on the surface of rGO/PEDOT:PSS(EG)/Pt(30%). The yield of H2O2 increase with decreasing potential and a significant increase in H2O2 formation was observed at potentials <0.1 V. This can partly be attributed to the blockage of surface active sites by adsorbed hydrogen atoms, preventing the dissociative adsorption of oxygen molecules.47 The higher activity and number of electron transfer observed for rGO/PEDOT:PSS(EG) (1
2 composition (rGO/PEDOT:PSS(EG)/Pt) exhibits the largest limiting current density (on the disk electrode), the most positive onset potential, and the lowest % H2O2 indicating an excellent ORR activity via the 4-electron pathway. The detection of hydrogen peroxide at potentials below 0.8 V in Fig. 7b indicates that the two-electron pathway does in fact occur on the surface of rGO/PEDOT:PSS(EG)/Pt(30%). The yield of H2O2 increase with decreasing potential and a significant increase in H2O2 formation was observed at potentials <0.1 V. This can partly be attributed to the blockage of surface active sites by adsorbed hydrogen atoms, preventing the dissociative adsorption of oxygen molecules.47 The higher activity and number of electron transfer observed for rGO/PEDOT:PSS(EG) (1![[thin space (1/6-em)]](https://www.rsc.org/images/entities/char_2009.gif) :
:![[thin space (1/6-em)]](https://www.rsc.org/images/entities/char_2009.gif) 2)/Pt(30%) could be related to the decreased H2O2 formation by further reduction of H2O2 to H2O.44 Therefore, the electrocatalytic ORR on rGO/PEDOT:PSS(EG)/Pt(30%)largely proceeds via a sequential pathway via H2O2 species, rather than via direct reduction of O2.
2)/Pt(30%) could be related to the decreased H2O2 formation by further reduction of H2O2 to H2O.44 Therefore, the electrocatalytic ORR on rGO/PEDOT:PSS(EG)/Pt(30%)largely proceeds via a sequential pathway via H2O2 species, rather than via direct reduction of O2.
For comparison, the RRDE voltammograms, n, and % H2O2 formation as a function of the disk potential for various Pt loadings (10%, 20%, 30% and 40%) on PEDOT:PSS(EG) were studied and are shown in Fig. S3.† The % H2O2 yield determined for 10%, 20%, 30% and 40% Pt loading on PEDOT:PSS(EG) were found to be 52%, 24%, 12%, and 4.5%, respectively. The electron transfer numbers (n) over the potential range of 0.07 to 0.3 V were found to be 2.96, 3.52, 3.78, and 3.91, respectively, for 10, 20, 30, and 40% Pt loading on PEDOT:PSS(EG). PEDOT:PSS(EG)/Pt(10%) displays the largest % H2O2 indicating that the electrochemistry is largely dominated by the PEDOT:PSS.43 The % H2O2 yields and n for 30% Pt loading on PEDOT:PSS(EG), rGO and rGO/PEDOT:PSS(EG) (1![[thin space (1/6-em)]](https://www.rsc.org/images/entities/char_2009.gif) :
:![[thin space (1/6-em)]](https://www.rsc.org/images/entities/char_2009.gif) 2) are shown in Fig. 8. Lower % H2O2 and higher n were found for Pt particles deposited on rGO/PEDOT:PSS(EG) composite. The MA for ORR on Pt particles deposited on rGO, PEDOT:PSS(EG) and rGO/PEDOT:PSS(EG) were found to be 7.8, 8.7, and 22.3 A g−1, respectively (Table S1†). Hence, a 2.9 fold increase in mass activity was found in the optimised composite ratio.
2) are shown in Fig. 8. Lower % H2O2 and higher n were found for Pt particles deposited on rGO/PEDOT:PSS(EG) composite. The MA for ORR on Pt particles deposited on rGO, PEDOT:PSS(EG) and rGO/PEDOT:PSS(EG) were found to be 7.8, 8.7, and 22.3 A g−1, respectively (Table S1†). Hence, a 2.9 fold increase in mass activity was found in the optimised composite ratio.
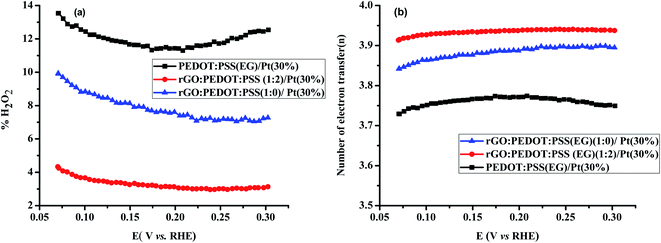 | ||
Fig. 8 (a) % H2O2 and (b) n as a function of the disk potential for PEDOT:PSS(EG)/Pt(30%), rGO/PEDOT:PSS(EG) (1![[thin space (1/6-em)]](https://www.rsc.org/images/entities/char_2009.gif) : :![[thin space (1/6-em)]](https://www.rsc.org/images/entities/char_2009.gif) 0)/Pt(30%) and rGO/PEDOT:PSS(EG) (1 0)/Pt(30%) and rGO/PEDOT:PSS(EG) (1![[thin space (1/6-em)]](https://www.rsc.org/images/entities/char_2009.gif) : :![[thin space (1/6-em)]](https://www.rsc.org/images/entities/char_2009.gif) 2)/Pt(30%) at 1600 rpm in 0.1 M HClO4 solution. 2)/Pt(30%) at 1600 rpm in 0.1 M HClO4 solution. | ||
The electrocatalytic performance of the optimized composite material was compared with previously reported values of Pt deposited on PEDOT:PSS and Vulcan carbon treated with EG (Table 1). The composite show better electrocatalytic performance and the use of commercially available materials (PEDOT:PSS and rGO) and their synergistic effect further gives promise for wide spread application.
Stability and electrochemical crossover effect are two important factors to evaluate the performance of an electrocatalyst in fuel cells. To further verify the electrocatalytic performance of the catalyst, a small quantity of 3 M methanol was introduced at 500th s in chronoamperometric (CA) measurement (Fig. 9) for ORR at rGO/PEDOT:PSS(EG)/Pt(30%) and commercial Pt/C (Etek, 20%). A sharp and immediate jumping in current on rGO/PEDOT:PSS(EG)/Pt(30%) and commercial Pt/C catalyst upon the addition of methanol indicates the occurrence of methanol oxidation. The rGO/PEDOT:PSS(EG)/Pt(30%) electrode exhibited better methanol tolerance with 15% current decay compared with a 22% current decay for commercial Pt/C electrode. The durability of rGO/PEDOT:PSS(EG)/Pt(30%) and commercial Pt/C catalysts was also investigated by I–t measurement. As shown in Fig. 10, rGO/PEDOT:PSS(EG)/Pt(30%) exhibits a very slow attenuation with high current retention 96.02% after 9000 s. By contrast, the Pt/C electrode exhibited a gradual decrease with 86.2% current retention after the same period indicating that rGO/PEDOT:PSS(EG)/Pt(30%) electrocatalyst is much more stable than the commercial Pt/C catalyst.
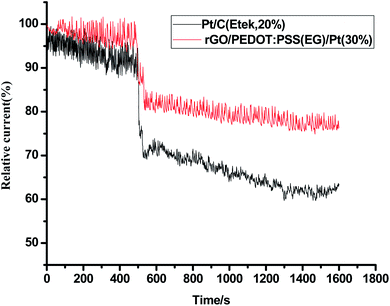 | ||
| Fig. 9 Comparative study of methanol tolerance ability of rGO/PEDOT:PSS(EG)/Pt(30%) and Pt/C (Etek, 20%) by chronoamperometry at 0.8 V in O2-saturated 0.1 MHClO4 with a rotational speed of 1600 rpm. | ||
Conclusions
Electrodeposited Pt on rGO, PEDOT:PSS, PEDOT:PSS(EG) and rGO/PEDOT:PSS(EG) were demonstrated for electrocatalytic reduction of oxygen in acidic solution. Reduced particle size and higher dispersion of Pt nanoparticle are responsible for the improved catalytic activity of PEDOT:PSS up on the addition of EG. Analysis of the electrochemical reduction of oxygen at rGO/PEDOT:PSS(EG) (1![[thin space (1/6-em)]](https://www.rsc.org/images/entities/char_2009.gif) :
:![[thin space (1/6-em)]](https://www.rsc.org/images/entities/char_2009.gif) 2)/Pt(30%) reveals enhanced catalytic activity with highest limiting current, lowest onset potential, maximum SA and MA with lowest H2O2 yield towards oxygen reduction reaction in acidic solution compared to PEDOT:PSS, PEDOT:PSS(EG) and rGO. rGO/PEDOT:PSS(EG)/Pt(30%) exhibits better tolerance to methanol crossover effect and longer durability than that of the Pt/C catalyst. The composite of rGO and PEDOT:PSS(EG) is a promising support material for platinum in the oxygen reduction reaction.
2)/Pt(30%) reveals enhanced catalytic activity with highest limiting current, lowest onset potential, maximum SA and MA with lowest H2O2 yield towards oxygen reduction reaction in acidic solution compared to PEDOT:PSS, PEDOT:PSS(EG) and rGO. rGO/PEDOT:PSS(EG)/Pt(30%) exhibits better tolerance to methanol crossover effect and longer durability than that of the Pt/C catalyst. The composite of rGO and PEDOT:PSS(EG) is a promising support material for platinum in the oxygen reduction reaction.
Conflicts of interest
There are no conflicts to declare.Acknowledgements
Financial support from the Basic and Applied Basic Research Major Program of Guangdong Province (No. 2019B030302007), the Institute of Polymer Optoelectronic Materials and Devices, School of Materials Science and Engineering, South China University of Technology, Guangzhou, PR China and International Science Program, Uppsala University, Sweden, is acknowledged.Notes and references
- K. Jukk, N. Kongi, A. Tarre, A. Rosental, A. B. Treshchalov, J. Kozlova, P. Ritslaid, L. Matisen, V. Sammelselg and K. Tammeveski, J. Electroanal. Chem., 2014, 735, 68–76 CrossRef CAS.
- N. Zhang, L. Lingcong, Y. Chu, L. Zheng, S. Sun, G. Zhang, H. He and J. Zhaob, Catal. Today, 2019, 332, 101–108 CrossRef CAS.
- X. Song, N. Li, H. Zhang, H. Wang, L. Wang and Z. Bian, J. Power Sources, 2019, 435, 226771 CrossRef CAS.
- M. K. L. Mendoza, B. J. V. Tongol, S. Shanmugam and H. Kim, Int. J. Hydrogen Energy, 2018, 43, 19930–19938 CrossRef CAS.
- Q. Liu, S. Cao and Y. Qiu, Int. J. Hydrogen Energy, 2017, 42, 29274–29282 CrossRef CAS.
- A. Jindal, D. K. Gautam and S. Basu, J. Electroanal. Chem., 2016, 775, 198–204 CrossRef CAS.
- F. Jiang, Z. Yao, R. Yue, J. Xu, Y. Du, P. Yang and C. Wang, J. Solid State Electrochem., 2013, 17, 1039–1047 CrossRef CAS.
- C. Coutanceau, M. J. Croissant, T. Napporn and C. Lamy, Electrochim. Acta, 2000, 46, 579–588 CrossRef CAS.
- S. Patra and N. Munichandraiah, Langmuir, 2009, 25, 1732–1738 CrossRef CAS PubMed.
- X. Zhou, J. Qiao, L. Yang and J. Zhang, Adv. Energy Mater., 2014, 4, 1301523 CrossRef.
- D. Higgins, P. Zamani, A. Yu and Z. Chen, Energy Environ. Sci., 2016, 9, 357–390 RSC.
- H. Feng, Y. Liu and J. Li, Chem. Commun., 2015, 51, 2418–2420 RSC.
- M. B. Gastelum, M. I. S. Gastelum, J. R. F. Hernandez, G. G. Botte, S. P. Sicairos, T. R. Castanon, E. R. Soto and R. M. F. Navarro, Energy, 2019, 181, 1225–1234 CrossRef.
- Y. Li, Y. Li, E. Zhu, T. McLouth, C. Y. Chiu, X. Huang and Y. Huang, J. Am. Chem. Soc., 2012, 134, 12326–12329 CrossRef CAS PubMed.
- G. G. Kumar, C. J. Kirubaharan, S. Udhayakumar, C. Karthikeyan and K. S. Nahm, Ind. Eng. Chem. Res., 2014, 53, 16883–16893 CrossRef.
- E. Antolini and E. R. Gonzalez, Appl. Catal., A, 2009, 365, 1–19 CrossRef CAS.
- T. Getachew, F. Addis, T. Beyene, S. Mehretie and S. Admassie, Bull. Chem. Soc. Ethiop., 2019, 33, 359–372 CrossRef CAS.
- S. D. Domínguez, J. A. Pardilla, A. B. Murcia, E. Morallon and D. C. Amoros, J. Appl. Electrochem., 2007, 38, 259 CrossRef.
- K. Sun, S. Zhang, P. Li, Y. Xia, X. Zhang, D. Du, F. H. Isikgor and J. Ouyang, J. Mater. Sci.: Mater. Electron., 2015, 26, 4438–4462 CrossRef CAS.
- T. Cheng, Y. Z. Zhang, J. D. Zhang, W. Y. Lai and W. Huang, J. Mater. Chem. A, 2016, 4, 10493–10499 RSC.
- Y. Xia, K. Sun and J. Ouyang, Adv. Mater., 2012, 24, 2436–2440 CrossRef CAS PubMed.
- B. W. Jensen, O. W. Jensen, M. Forsyth and D. R. MacFarlane, Science, 2008, 321, 671–674 CrossRef PubMed.
- B. Wondimu and S. Admassie, Bull. Chem. Soc. Ethiop., 2012, 26, 449–454 CrossRef CAS.
- M. Zhang, W. Yuan, B. Yao, C. Li and G. Shi, ACS Appl. Mater. Interfaces, 2014, 6, 3587–3593 CrossRef CAS PubMed.
- Y. Nie, L. Li and Z. Wei, Chem. Soc. Rev., 2015, 44, 2168–2201 RSC.
- C. Che, M. Vagin, K. Wijeratne, D. Zhao, M. Warczak, M. P. Jonsson and X. Crispin, Adv. Sustainable Syst., 2018, 2, 1800021 CrossRef.
- H. Shi, C. Liu, Q. Jiang and J. Xu, Adv. Electron. Mater., 2015, 1, 1500017 CrossRef.
- W. Yohannes, S. V. Belenov, V. E. Guterman, L. M. Skibina, V. A. Volotchaev and N. V. Lyanguzov, J. Appl. Electrochem., 2015, 45, 623–633 CrossRef CAS.
- F. Chekol, S. Mehretie, F. Addis, T. Tolcha, N. Megersa and S. Admassie, Electroanalysis, 2019, 31, 1104–1111 CrossRef CAS.
- S. K. Bikkarolla, P. Cumpson, P. Joseph and P. Papakonstantinou, Faraday Discuss., 2014, 173, 415–428 RSC.
- B. W. Zewde and S. Admassie, J. Power Sources, 2012, 216, 502–507 CrossRef CAS.
- L. F. Gloaguen, J. M. Leager and C. Lamy, J. Appl. Electrochem., 1997, 27, 1052–1060 CrossRef.
- J. Schmidt, H. A. Gasteiger, G. D. Stab, P. M. Urban, D. M. Kolb and R. J. Behm, J. Electrochem. Soc., 1998, 145, 2354–2358 CrossRef.
- Q. He and S. Mukerjee, Electrochim. Acta, 2010, 55, 1709–1719 CrossRef CAS.
- X. Min, Y. Chen and M. W. Kanan, Phys. Chem. Chem. Phys., 2014, 16, 13601–13604 RSC.
- Y. Garsany, O. A. Baturina, E. S. Lyons and S. S. Kocha, Anal. Chem., 2010, 82, 6321–6328 CrossRef CAS PubMed.
- Y. Saito and T. Kikuchi, Voltammetry Theory, Types and Application, Nova Science Publishers, Inc., New York, 2014 Search PubMed.
- W. J. Khudhayer, N. N. Kariuki, X. Wang, D. J. Myers, A. U. Shaikh and T. Karabacak, J. Electrochem. Soc., 2011, 158, B1029–B1041 CrossRef CAS.
- M. E. Scofield, H. Liu and S. S. Wong, Chem. Soc. Rev., 2015, 44, 5836–5860 RSC.
- G. Zhang, Q. Wei, X. Yang, A. C. Tavares and S. Sun, Appl. Catal., B, 2017, 206, 115–126 CrossRef CAS.
- Y. Chen, X. Zhu, D. Yang, P. Wangyang, B. Zeng and H. Sun, Electrochim. Acta, 2019, 298, 297–304 CrossRef CAS.
- Y. Wang, N. Zhao, B. Fang, H. Li, X. T. Bi and H. Wang, RSC Adv., 2015, 5, 56570–56577 RSC.
- J. Shan and P. G. Pickup, Electrochim. Acta, 2000, 46, 119–125 CrossRef CAS.
- E. Fabbri, S. Taylor, A. Rabis, P. Levecque, O. Conrad, R. Kotz and T. J. Schmidt, ChemCatChem, 2014, 6, 1410–1418 CrossRef CAS.
- E. T. Salgado, D. B. Uribe, P. A. M. Aguilar, J. L. R. Rodriguez, R. C. Silva and O. S. Feria, Electrochim. Acta, 2019, 298, 172–185 CrossRef.
- S. Chen, J. Duan, J. Ran, M. Jaroniec and S. Z. Qiao, Energy Environ. Sci., 2013, 6, 3693–3699 RSC.
- S. Taylor, E. Fabbri, P. Levecque, T. J. Schmidt and O. Conrad, Electrocatalysis, 2016, 7, 287–296 CrossRef CAS.
Footnote |
| † Electronic supplementary information (ESI) available. See DOI: 10.1039/d0ra05232a |
| This journal is © The Royal Society of Chemistry 2020 |

