 Open Access Article
Photocatalysis, photoinduced enhanced anti-bacterial functions and development of a selective m-tolyl hydrazine sensor based on mixed Ag·NiMn2O4 nanomaterials†
Md Abdus Subhan *a,
Pallab Chandra Saha
 a,
Md Anwar Hossain
 a,
M. M. Alam
 b,
Abdullah M. Asiri
 c,
Mohammed M. Rahman
 *c,
Mohammad Al-Mamun
 d,
Tanjila Parvin Rifata,
Topu Raihane and
A. K. Azade
aDepartment of Chemistry, School of Physical Sciences, Shah Jalal University of Science and Technology, Sylhet-3114, Bangladesh. E-mail: subhan-che@sust.edu; Tel: +8801716073270
bDepartment of Chemical Engineering and Polymer Science, Shah Jalal University of Science and Technology, Sylhet 3100, Bangladesh
cCenter of Excellence for Advanced Materials Research (CEAMR), Department of Chemistry, Faculty of Science, King Abdulaziz University, P.O. Box 80203, Jeddah 21589, Saudi Arabia. E-mail: mmrahman@kau.edu.sa; Fax: +966-12-695-2292; Tel: +966-59-642-1830
dCentre for Clean Environment and Energy, Griffith School of Environment, Gold Coast Campus, Griffith University, QLD 4222, Australia
eDepartment Genetics Engineering and Biotechnology, Shah Jalal University of Science and Technology, Sylhet-3114, Bangladesh
First published on 19th August 2020
Abstract
In this work, a tri-metal based nanocomposite was synthesized and characterized. A detailed investigation of the photocatalytic dye degradation efficiency of the nanocomposite under visible light showed promising results in a wide pH range, both acidic and basic medium. Studies on anti-bacterial activity against seven pathogenic bacteria, including both Gram positive and Gram negative species, were conducted in the presence and absence of light and compared with the standard antibiotic gentamicin. The minimum inhibitory concentration (MIC) values of Ag·NiMn2O4 against multidrug-resistant (MDR) pathogens ranged from 0.008 to 0.65 μg μL−1, while the minimum bactericidal concentration (MBC) was found to be 0.0016 μg μL−1. The nanomaterial, Ag·NiMn2O4 was deposited onto the surface of a glassy carbon electrode (GCE; 0.0316 cm2) as a thin film to fabricate the chemical sensor probe. The proposed sensor showed linear current (vs. concentration) response to m-THyd (m-tolyl hydrazine) from 1.0 pM to 0.01 mM, which is denoted as the linear dynamic range (LDR). The estimated sensitivity and detection limit of the m-THyd sensor were found to be 47.275 μA μM−1 cm−2 and 0.97 ± 0.05 pM, respectively. As a potential sensor, it is reliable due to its good reproducibility, rapid response, higher sensitivity, working stability for long duration and efficiency in the analysis of real environmental samples.
Introduction
Dyes are extensively used in the textile industry, and considerable amounts are discharged into natural water reservoirs without any treatment. To treat wastewater, many catalysts have been investigated. Harmful pollutants are increasingly becoming a serious threat to the environment by several-fold every year as the economic development increases.1 Numerous organic and inorganic pollutants enter the environment every day2 and inorganic pollutants such as heavy metals are hazardous. Organic pollutants used in industries, including textile, cosmetics, paper, printing, and pharmaceutical industries, are even more harmful.3,4 The dyes used in textile industries contribute to disruption of harmony in the ecosystem. These industries use azo dyes, which are released to nearby water bodies without any treatment. Most textile industries are situated in developing countries and are often reluctant to address environmental issues. These dyes, containing wastewater destabilize the natural harmony destroying the aquatic ecosystem. In addition, they are a threat to human health, as allergen and mutagen enforce an unrecoverable negative effect on ecology.5 Organic dyes are highly non-biodegradable and cause genetic problems, toxicity, and carcinogenicity to humans, and their direct release into the environment adversely affects the photosynthesis cycle.6,7 Conventional methods of treatment, including physical, chemical, and biological processes, fail to decompose and mineralize organic waste materials and only transfer them to another phase called secondary pollutants.8 Secondary pollutants require further processing, which incurs added operational costs.9–11Recent studies have offered several modern techniques to remove textile dyes from wastewater, including chemical oxidation,12 anaerobic treatment,13 membrane filtration,14 adsorption,15 biosorption,16 and coagulation17 and the most prominent is the photocatalysis.18 In order to enhance the efficiency of catalysts, researchers have developed many heterogeneous photocatalytic materials, including Ag3PO4/graphene oxide,19 NiO,20 and MnO2.21 Although the efficiency of degradation of pollutants was increased using heterogeneous materials, a substantial percentage is required to treat wastewater with highly concentrated pollutants. Another problem related to nanocatalytic dye degradation is the pH selectivity. There is an optimum pH limit where nanocomposites work efficiently. A few of them work better in acidic conditions, whereas others work better in basic conditions, thus limiting the application of catalysts under different reaction conditions. A nanocomposite which can effectively degrade organic dyes in wastewater in both higher and lower buffer conditions will be extremely exciting and useful. In this study, Methyl Violet 6b (MV) was used as a model dye to evaluate the photocatalytic dye degradation efficiency of the synthesized nanocomposite, Ag·NiMn2O4.
Nanocomposites can also be used to modify electrodes to detect specific molecules in waste water and as antibacterial agents to kill several types of bacteria.22 The antibacterial activities of a mixed metal oxide nanocomposite, Ag·NiMn2O4, were tested against some pathogenic bacteria, including Gram positive (S. aureus, B. subtilis) and Gram negative (S. marcescens, E. coli, K. pneumoniae, P. aeruginosa, P. mirabilis) bacteria, by the agar well diffusion method in the absence and presence of visible light.
Hydrazine is used as an industrial raw material to produce pesticides, herbicides, insecticides, corrosion inhibitors, pharmaceutical intermediates, dyestuffs, antioxidants, explosives, catalysts, fuel cells, and rocket fuel.23–27 Due to the high toxicity of hydrazine, several syndromes, including eye irritation, throat and nose irritation, temporary blindness, seasickness, unconsciousness, respiratory edema, and faintness, are perceived in humans. Long-term high-level exposure can cause carcinogenic and mutagenic effects in the lungs and liver as well as kidney damage. Additionally, the toxicity of hydrazine can affect the central nervous system.28–36 Therefore, hydrazines are classified as priority toxic elements by the US Environmental Protection Agency (EPA).37
Numerous analytical methods have been reported regarding the detection of hydrazine, including titrimetric methods,38 spectrophotometric methods,39,40 chemiluminescence,41,42 chromatographic methods,43,44 coulometry,45 fluorescence,46,47 and electrochemistry.48 However, these methods have disadvantages, including heavy and expensive instrumentation, time consumption during analysis, and inconvenient in situ detection. To overcome these drawbacks, reliable and sensitive electrochemical methods involving the I–V approach for the detection of toxic chemicals have reported previously.49,50 In this study, we report the development of an electrochemical sensor using a Ag·NiMn2O4 nanomaterial on GCE.
The m-tolyl hydrazine chemical sensor was fabricated with GCE coated with the Ag·NiMn2O4 nanomaterial. The stability of the sensor probe was implemented by applying conductive Nafion (5% in ethanol) as a chemical glue under ambient conditions. Detailed analyses, such as sensor sensitivity, linear dynamic range, detection limit, stability, linearity, response time, and reproducibility, were investigated by the electrochemical method. Finally, various real samples (collected from various environmental sources) were analyzed to check the applicability as well as the validity of this chemical sensor probe.
Experimental
Materials and methods
To synthesize the nanocomposite in this experiment, silver nitrate, AgNO3 (Sigma Aldrich, Germany), manganese acetate, Mn(CH3COOH)2·4H2O (Sigma Aldrich, Germany), NiCl2·6H2O (Sigma Aldrich, Germany) and sodium carbonate, Na2CO3 (AR, BDH) were purchased and used as supplied. Methyl violet 6b (C24H28N3Cl, Sigma Aldrich, Germany), was used to assess the photocatalytic activity. Gentamicin (C21H43N5O7, HiMedia Laboratories, India) was used as a standard to compare the antibacterial activity. The other chemicals were analytical grade, including m-tolyl hydrazine (m-THyd), 1,2-diaminobenzene (1,2-DAB), phenylhydrazine (PHyd), 2,4-dinitrophenol (2,4-DNP), chlorobenzene (CB), 1,2-dichlorobenzene (1,2-DCB), salicylaldehyde, 1,4-dioxane and zimtaldehyde, and were procured from Sigma-Aldrich. As supporting chemicals, monosodium and disodium phosphate buffers and Nafion (commercially obtained as a 5% suspension in ethanol) were used to complete this study. Distilled and autoclaved water were used throughout the study.The bulk crystal phases and other structural evidence of the materials considered in this study were characterized by X-ray diffraction (XRD, Bruker D8 Advance diffractometer equipped with a graphite monochromator). The diffraction patterns were logged in the step scan mode at 0.05 steps and a measurement rate of 10 s per step. The diffraction patterns were registered within the 2θ angle range from 10° to 80°. The surface morphology was determined using a scanning electron microscope (SEM) equipped with an energy-dispersive X-ray spectrometer (EDS) (JSM-7100F) linked with an EDS (Oxford) mapping device and using an atomic force microscope (AFM) (NaioAFM, NanoSurf). The Fourier transform infrared spectroscopic (FTIR) analysis of the samples was carried out using an FTIR spectrometer (Shimadzu, FTIR-8400S) with KBr as a reference matrix. The photoluminescence behavior of the synthesized nanocomposite was studied by a spectrofluorophotometer (Shimadzu Corp. model RF-5301), and the photocatalytic activity was observed with the aid of a double beam UV-visible spectrophotometer (UV-1800 Series, Shimadzu Corporation, Kyoto, Japan). A Keithley electrometer was used to assemble and study the desired sensor.
Synthesis of the Ag·NiMn2O4 nanocomposite
The Ag·NiMn2O4 nanocomposite was synthesized using a simple co-precipitation method. 0.25 M solutions of AgNO3 (4.246 gm in 100 mL), NiCl2·6H2O (5.942 gm in 100 mL) and Mn(CH3COOH)2·4H2O (6.177 gm in 100 mL) were respectively prepared. All these solutions were mixed in a beaker in the same volume (50 mL) ratio with constant stirring for about 15 minutes. In this triple metal salt mixture, 0.5 M Na2CO3 was added dropwise at 65 °C until the reaction was complete. The resultant mixture was stirred for an additional 1 hour at 65 °C with constant stirring. After terminating the reaction, the white precipitate was separated from the solution by centrifugation, washed several times with deionized water and finally dried at 120 °C in an oven for 2 hours. Then, the powder sample was calcined in an electric muffle furnace (Gallenkamp, Korea) at 950 °C for four hours. The calcinations converted the carbonates of the sample into their oxides.51,52 Three different single metal oxides (Ag2O, NiO and MnO) were also synthesized by the same method. All these oxides were calcined at 950 °C. The reactions of the Ag·NiMn2O4 synthesis can be summarized as below:| 2(Ag+ + NO3−) + (Na+ + CO32−) → Ag2CO3 + (Na+ + NO3−) |
| Ag2CO3 → 2Ag + CO2 |
| 4(Mn2+ + 2CH3COO−) + 4(Na+ + CO32−) + H2O → Mn4(CO3)3(OH)2 + CO2 + 4(Na+ + CH3COO−) |
| 3(Ni2+ + 2Cl−) + 6(Na+ + CO32−) + H2O → Ni3(CO3)2(OH)2 + CO2 + 6(Na+ + Cl−) |
| 3Mn4(CO3)3(OH)2 + 2Ni3(CO3)2(OH)2 → 6NiMn2O4 |
| NiMn2O4 + Ag → Ag·NiMn2O4 |
Results and discussion
Structural characterization of the Ag·NiMn2O4 nanocomposites
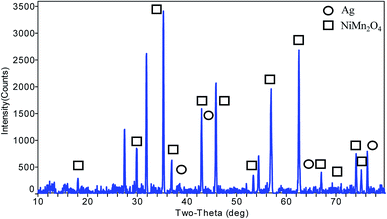
The XRD data analysis (Fig. 1) was carried out using MDI Jade software. The synthesized nanocomposite has matching peaks at 2θ angles of 18.19° (1 1 1), 29.97° (2 2 0), 35.32° (3 1 1), 36.95° (2 2 2), 42.94° (4 0 0), 47.02° (3 3 1), 53.29° (4 2 2), 53.29° (4 2 2), 56.81° (5 1 1), 62.39° (4 4 0), 65.60° (5 3 1), 66.65° (4 4 2), 70.78° (6 2 0), 73.82° (5 3 3), 74.82° (6 2 2), and 78.77° (4 4 4). The peak search results matched the obtained pattern for the structure of nickel manganese oxide, NiMn2O4 (matching JCPDS #74-1865). The structure is cubic in shape with the Fd![[3 with combining macron]](https://www.rsc.org/images/entities/char_0033_0304.gif) m (227) space group, with cell dimensions (a) of 8.4028 Å, an angle (α) of 90° and a unit cell volume of 593.3 Å3. The presence of silver nanoparticles was predicted by the matching peaks at 2θ values of 38.2° (1 1 1), 44.4° (2 0 0), 64.6° (2 2 0) and 77.59° (3 1 1) (matching JCPDS #87-0720), which is cubic silver 3C (Ag). The space group of silver is Fm
m (227) space group, with cell dimensions (a) of 8.4028 Å, an angle (α) of 90° and a unit cell volume of 593.3 Å3. The presence of silver nanoparticles was predicted by the matching peaks at 2θ values of 38.2° (1 1 1), 44.4° (2 0 0), 64.6° (2 2 0) and 77.59° (3 1 1) (matching JCPDS #87-0720), which is cubic silver 3C (Ag). The space group of silver is Fm![[3 with combining macron]](https://www.rsc.org/images/entities/char_0033_0304.gif) m (225), with cell dimensions (a) of 4.07724 Å, an angle (α) of 90° and a unit cell volume of 67.8 Å3. For size analysis, a Williamson–Hall plot (eqn (1)) was used; the particle size was estimated to be 58.3 nm, where the standard deviation (ESD) of the peak fitting is 0.00039 (Fig. S1†).53
m (225), with cell dimensions (a) of 4.07724 Å, an angle (α) of 90° and a unit cell volume of 67.8 Å3. For size analysis, a Williamson–Hall plot (eqn (1)) was used; the particle size was estimated to be 58.3 nm, where the standard deviation (ESD) of the peak fitting is 0.00039 (Fig. S1†).53
 | (1) |
From the XRD data, the structural composition of this nanocomposite can be estimated to be Ag·NiMn2O4.
Morphological and elemental analysis of the Ag·NiMn2O4 nanocomposite
SEM studies were performed to determine the morphology of the Ag·NiMn2O4 nanocomposite. The SEM images show nanoplates with clear edges (Fig. 2). The as-prepared crystals exhibited a uniform and regular rhombic-like morphology, with average dimensions of about 500 to 700 nm in edge length and 100 nm in thickness; cubic Ag was aggregated on the surface as nanoclusters. As evidenced by the SEM images, the Ag·NiMn2O4 nanocomposite comprises different facets, which may impart enhanced photocatalytic activity.54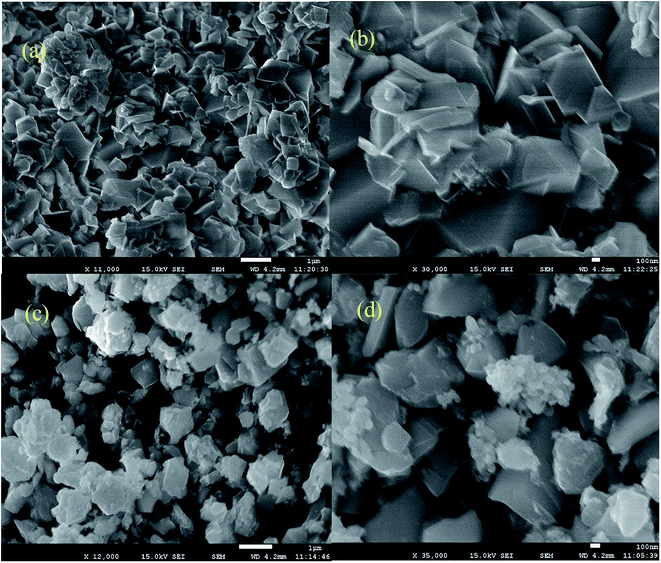 | ||
| Fig. 2 Scanning electron microscope image of the Ag·NiMn2O4 nanocomposite surface (a and c) on a 1 μm scale and (b and d) on a 100 nm scale. | ||
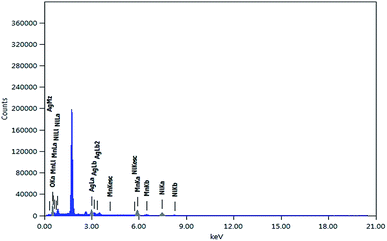
The EDS showed the mass and atomic percentages of the individual elements in the nanocomposite, as shown in Fig. 3 and Table 1. The nanocomposite comprises 50.35% oxygen, 21.13% nickel and 21.72% manganese. On the other hand, the composite contains about 6.8% silver. This analysis supported the formation of mixed oxide Ag·NiMn2O4.
| Element | (keV) | Mass% | Sigma | Atom% |
|---|---|---|---|---|
| O K | 0.525 | 20.27 | 0.09 | 50.35 |
| Mn K | 5.894 | 30.04 | 0.15 | 21.72 |
| Ni K | 7.471 | 31.22 | 0.2 | 21.13 |
| Ag L | 2.983 | 18.47 | 0.1 | 6.8 |
| Total | 100 | 100 |
The SEM-EDS mapping image (in Fig. S2(a–d)†) shows the individual metals in the nanocomposite surface. It provides information about the distribution of all the metals in the whole nanocomposite matrix. However, in the overlap image (in Fig. S2(e)†), a dominating blue tint can be seen; this supports our predicted self-assembly of Ag nanoparticles on the NiMn2O4 oxide surface.
FTIR analysis of the Ag·NiMn2O4 nanocomposite
The FTIR spectrum of Ag·NiMn2O4 was measured in the range of 400–4000 cm−1. The metal oxide composite calcined at 950 °C (Fig. S3†) showed no peaks corresponding to carbonate species. Therefore, the composite was completely converted into metal oxides. The peak at 447.49 cm−1 is associated with Ni–O vibration, the peaks at 516.92 cm−1 and 605.65 cm−1 can be ascribed to Mn–O stretching vibrations, and the peak at 800.46 cm−1 is due to O–Mn–O stretching.Surface analysis of the Ag·NiMn2O4 nanocomposite
A thin film of Ag·NiMn2O4 nanocomposite was deposited on a glass surface. A very dilute solution of the nanocomposite in acetone was used as a drop coat. AFM images of Ag·NiMn2O4 were recorded using the dynamic (tapping) method to observe the surface morphology of the nanocomposite, as shown in Fig. S4(a and b).† Fig. S4(a)† depicts a particle of the composite with a length of 163 nm and a width of 97 nm. The average particle size was found to be 130 nm. The linear roughness of that surface was cut out (Fig. S4(b)†) and analyzed using NaioAFM software, and the average roughness is 2154.4 pm, as shown in Table S1.† The enhanced surface roughness may exert excellent catalytic contributions in nanocomposites than in single oxide particles.Photoluminescence studies of the Ag·NiMn2O4 nanocomposite
The Ag·NiMn2O4 nanocomposite calcined at 950 °C was used to measure the photoluminescence spectra by dispersing the nanocomposite in acetone (as shown in Fig. 4). The Ag·NiMn2O4 nanocomposite showed a photoluminescence excitation (PLE) spectrum when monitored at 450 nm, as shown in Fig. 4(a). A broad peak (320 to 400 nm) was observed with a maximum at 370 nm when monitored at 450 nm.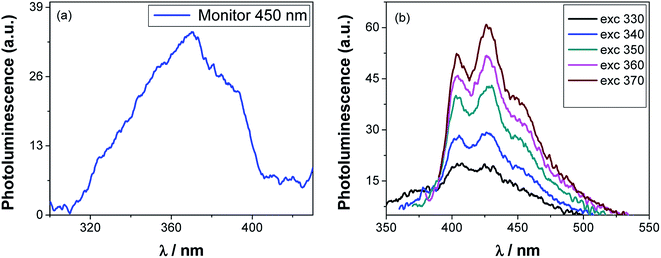 | ||
| Fig. 4 Photoluminescence emission spectrum of the Ag·NiMn2O4 nanocomposite monitored at 450 nm (a) and photoluminescence spectra at various wavelengths of excitation (b) heated at 950 °C. | ||
When the sample was excited at different wavelengths of 330, 340, 350, 360 and 370 nm, different photoluminescence (PL) peaks were observed (Fig. 4(b)). Three emission peaks were observed at 406, 425 and 427 nm when excited at 330 nm. Two emission peaks were observed at 404 and 427 nm as a result of excitation at 340 nm. Four PL peaks were observed at 403, 420, 430 and 450 nm when the sample was excited at 350 nm. Then, the sample was excited at 360 nm, and the emission peaks were observed at 403, 427 and 450 nm. Similarly, three emission peaks were found at 403, 427 and 449 nm when the sample was excited at 370 nm. The emission band from 420 to 470 nm indicates a blue band in the visible region.55 Ionized oxygen vacancies in the valence band may be the reason for the blue band emission. A blue emission may have been detected because of the radiative recombination of the photogenerated holes with electrons occupying the oxygen vacancies.56 The excitation-wavelength-dependent PL properties of Ag·NiMn2O4 may be caused by the existence of an energetically dissimilar molecular distribution of the ground state, coupled with a low rate of the excited state relaxation processes. The data are compiled in Table 2.
| Monitored wavelength (nm) | Emissions observed (nm) |
|---|---|
| 450 | 370, 391 |
| Excitation wavelength (nm) | Emissions observed (nm) |
|---|---|
| 330 | 406, 425, 431 |
| 340 | 404, 427 |
| 350 | 403, 420, 430, 450 |
| 360 | 403, 427, 450 |
| 370 | 403, 427, 449 |
Photoluminescence study of single metal oxides (Ag2O, NiO, MnO)
The PL spectra of single metal oxides (Ag2O, NiO and MnO) were also measured in acetone at various wavelengths (Fig. S5–S7†) and compared with that of the nanocomposite. When the particles were excited by 330 nm light, NiO and MnO showed somewhat similar PL spectra to the tri-metal oxide nanocomposite, both giving peaks around 404 and 427 nm. In the case of Ag2O, there is a peak at 385 nm which is absent in the emission spectrum of the tri-metal oxide nanocomposite (Fig. 5). This indicates that the as-synthesized nanocomposite contains no Ag2O species. Thus, the PL study supports the structural assignment of the Ag·NiMn2O4 nanocomposite.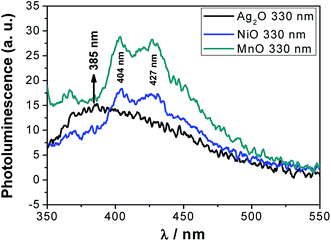 | ||
| Fig. 5 Comparative photoluminescence spectra of the single metal oxides (Ag2O, NiO and MnO) calcined at 950 °C. | ||
Photocatalytic activity of the Ag·NiMn2O4 nanocomposite
The photocatalytic activity of the catalyst was evaluated using the decolorization of MV dye under visible light irradiation. The dye solution (100 mL, with an initial concentration of 8.0 ppm) was maintained in a Pyrex beaker 5 cm in diameter, and the catalyst (differing amounts) was added to the dye solution. The solution was stirred prior to irradiation for about 1 hour in the dark to ensure adsorption/desorption equilibrium. Two 200 W, 220–240 volt tungsten incandescent light bulbs were used as a visible light source. The distance between the experimental dye solution and the light source was 15 cm. The reactor was set in the open air. 5 mL of solutions were collected at regular intervals, and the dye solutions were separated from the photo-catalyst by centrifugation before analysis. The changes in the concentrations of the dye solutions were measured spectrophotometrically using a Shimadzu-1800 spectrophotometer. The photocatalytic efficiency was calculated using the expression given in eqn (2):| η = (1 − C/C0) ×100 = (1 − A/A0) × 100 | (2) |
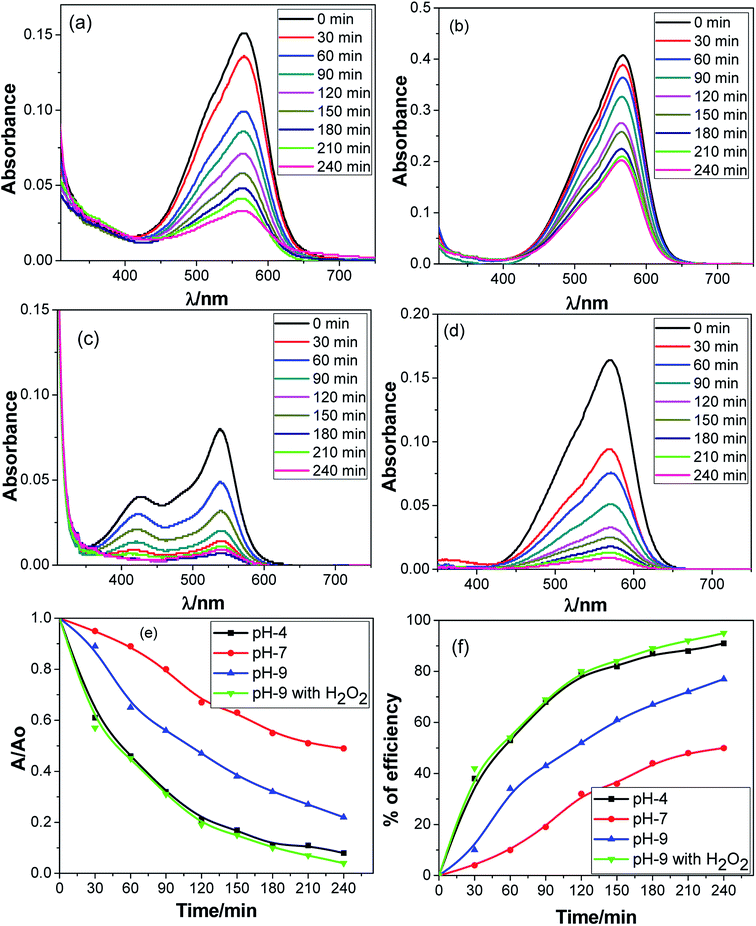
In this study, the pH selectivity of the dye degradation efficiency of the nanocomposite was assessed under three different conditions: acidic (pH 4), neutral (pH 7) and basic (pH 9) media. To examine the catalytic process, hydrogen peroxide was used as a catalyst booster. Fig. 6 depicts the change in the UV-vis spectra with time due to the photocatalytic degradation of MV dye at different pH values in the presence of the Ag·NiMn2O4 nanocomposite. A gradual decrease in absorption intensity with time was observed in each case. Fig. 6 shows that in the presence of the catalyst at pH 4, pH 7, and pH 9 and in the presence of the catalyst at pH 9 with H2O2, the dye degradation efficiencies were 91%, 50%, 77%, and 95%, respectively. It is usually found that photocatalytic dye degradation efficiency of the nanocomposite is pH-dependent, that is, they show higher efficiency at a particular pH, under either acidic or basic conditions. In the current study, the dye degradation efficiency is higher at both acidic pH 4 (91%) and basic pH 9 (77% and 95%) compared to neutral pH 7 (50%). This observation indicated a special feature of the nanocomposite, Ag·NiMn2O4, in photocatalytic dye degradation, which may be applied for different types of waste water treatment either in acidic or basic medium with no pH selectivity.
Nanocomposites which work better in basic solution generally promote the reaction by enhancing hydroxyl ion/radical formation. The hydroxyl radicals can be produced by oxidizing more hydroxide ions in alkaline solution. Thus, the efficiency of the method is logically boosted at pH 9. It appears that pH and H2O2 have strong effects on the photodegradation of the dye. The addition of H2O2 to the heterogeneous system increases the concentration of ˙OH radicals. Being an electron acceptor, H2O2 not only generates ˙OH radicals but also inhibits the electron–hole recombination process at the same time. When the ˙OH radical concentration becomes high, the H2O2 consumes hydroxyl radicals and performs as a hydroxyl radical scavenger.
In acidic medium, catalysis is usually driven by surface charge and high occupation of the active sites.57 The perhydroxyl radical  can produce hydrogen peroxide, which in turn gives rise to the hydroxyl radical. Under both acidic and basic conditions, the oxidation of surface-bound HO− and H2O to form the hydroxyl radical is thermodynamically possible. Thus, both H+ and HO− may be able to enhance the photocatalytic degradation efficiency.58,59 The reactions of photo-catalysis can be summarized as follows:
| MO + hv → MO (eCB− + hVB+) |
| MO (hVB+) + H2O → MO + H+ + ˙OH |
| MO (hVB+) + OH−→ MO + ˙OH |
Oxidative reactions due to photocatalytic effects,
| 2h+ + 2H2O → 2H+ + H2O2 |
| H2O2 → HO˙ + ˙OH |
Reductive reaction due to photocatalytic effects,
| H2O2 → HO˙ + ˙OH |
| Dye + ˙OH → degradation products |
| Dye + hVB+ → oxidation products |
| Dye + eCB− → reduction products |
Effects of the photocatalyst amount of the Ag·NiMn2O4 nanocomposite
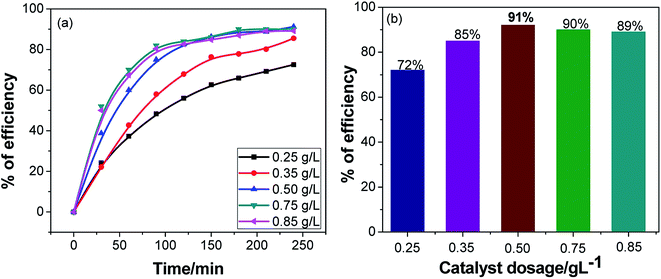
The optimum dosage for the maximum performance of the synthesized nanocomposite was examined, and the dye was maintained in pH 4 medium (Fig. 7). The solution was maintained at pH 4 because the nanocomposite showed enhanced dye degradation efficiency by about 91% at this pH value. Photocatalytic dye degradation was studied in different doses (Fig. S8†), where the amount of dye was kept the same but the catalyst dose was changed every time. When 0.3 g L−1 catalyst was used in the process, the photocatalytic dye degradation efficiency was found to be 72%. Similarly, for 0.4 g L−1, the efficiency was 85%. The efficiency climbed to an apex when 0.5 g L−1 of catalyst was used with a degradation efficiency of 91%. With further increase of the catalytic dose, the efficiency falls. When 0.6 g L−1 was used, the efficiency declined to 90%; finally, for 0.7 g L−1, the efficiency plummeted to 89%. To ensure high fidelity, further experiments were carried out using the 0.5 g L−1 catalyst dose.Catalytic stability of the Ag·NiMn2O4 nanocomposite
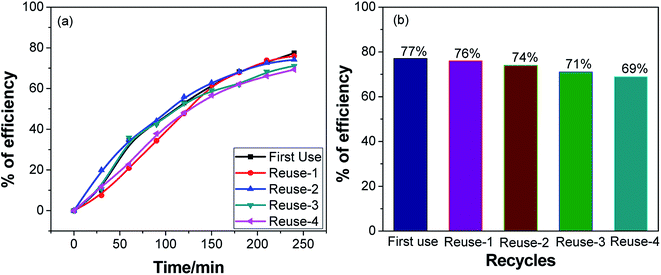
The notion of using a catalyst once is neither cost-effective nor nature-friendly. A suitably stable catalyst can contribute significantly to lowering the operational cost of the process, which is an important parameter in the applicability of photocatalysts for waste water purification. The actual pH value of textile industrial waste water in Bangladesh is ∼8 because of the use of NaOH in washing materials. We believe that the photocatalyst Ag·NiMn2O4 is useful for treatment of industrial waste water. To evaluate the possibility of using the same catalyst multiple times without considerable reduction of the performance, a catalytic stability assessment was performed at pH 9, as shown in Fig. 8.The catalyst was regenerated in a straightforward way. After the first photocatalytic dye degradation reaction was complete, the solution was allowed to stand for 24 h; then, the supernatant was removed. Then, the catalyst was thoroughly rinsed several times with distilled water and dried at 220 °C for 2 hours. To evaluate the photocatalytic efficiency of the reused catalyst, a series of experiments were performed using 0.5 g L−1 catalyst under visible light at pH 9 using MV dye solution. The experimental results are shown in Fig. S9.† For each new cycle, the photocatalyst was reused for the degradation of a fresh MV solution under similar conditions after the photocatalyst samples were separated and dried. In the presence of the Ag·NiMn2O4 catalyst at pH 9, the degradation percentages of MV solution for 5 cycles of use were 77%, 76%, 74%, 71% and 69% after 4 h of visible light irradiation, respectively (Fig. 8). The decrease in the degradation percentage may be due to the adsorption of intermediate products on the active sites of the photocatalyst, which renders them unavailable for degradation of fresh dye solution. Another cause may be the loss of some of the catalyst during separation. However, 69% of MV was degraded successfully during the 5th use of the photocatalyst, i.e. the total decrease of efficiency over 5 cycles was only 8%; this indicates that the catalyst can be reused effectively.
Kinetics study of methyl violet 6b degradation by the Ag·NiMn2O4 nanocomposite
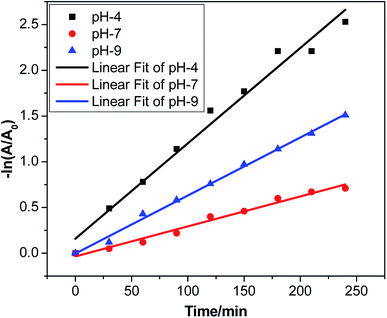
The plot of ln([MV]0/[MV]) vs. time provided a straight line with slope k at variable pH, as shown in Fig. 9. The pseudo-first order assumption describes the experimental data well. The observed dye degradation rate constants and the values of r-squared (r2) are listed in Table S2.† The value of r2 for pH 4 is 0.97731, that for pH 7 is 0.97964 and that for pH 9 is 0.99563. All these values are close to 1.Finally, the study indicated that trimetallic oxide nanocomposites are promising candidates for photocatalytic applications and environmental protection due to their nanostructure formation and perturbations of electronic energy levels.51,52,60–62
Anti-bacterial activity of the Ag·NiMn2O4 nanocomposite
Nanocomposites are being thoroughly studied as potential anti-bacterial agents. The anti-bacterial activity of a nanomaterial varies with several factors, including size, morphology and crystal growth behavior.63,64The pathogenic bacterial isolates were precultured in nutrient broth media at 37 °C and shaken at 120 rpm overnight. The mixed metal oxide nanocomposite samples were prepared at concentrations of 1, 2 and 3 mg mL−1. Mueller–Hinton agar nutrients were used for the subculture of the pure cultures of the organisms. A well around 4 mm in depth was created on the agar media. About 60 μL of solution was poured into each well from the prepared nanocomposite solutions using a micropipette, and gentamicin (GEN 10) was used as a control. The plates were incubated at 37 °C for 24 h; then, the various levels of zone inhibition were measured. Two separate sets of incubation were performed, where one was carried out in the dark and another one under visible light from a compact fluorescent lamp (25 Watt, Transtec, Bangladesh).
The anti-bacterial activities of the mixed metal oxide nanocomposite, Ag·NiMn2O4, were tested against some pathogenic bacteria, as shown in Fig. 10–12 and Table S3,† including Gram positive (S. aureus, B. subtilis) and Gram negative bacteria (S. marcescens, E. coli, K. pneumoniae, P. aeruginosa, and P. mirabilis) by the agar well diffusion method in the absence and presence of visible light. The obtained results are shown in Tables S4 and S5.†
For the clear zones of inhibition, the synthesized nanocomposite Ag·NiMn2O4 has larger rings for all three concentrations than the GEN 10 standard, except for that of P. mirabilis. This dominating performance can be seen for both Gram positive and Gram negative bacteria. The effects of light on the performance of the anti-bacterial activity of the synthesized nanocomposite were also studied. The effects of light on the anti-bacterial activity for E. coli are shown in Fig. 10. It was found that in the absence of light, the Ag·NiMn2O4 nanocomposite (Fig. 11 and S10†) showed anti-bacterial effects at all three concentrations by killing both Gram positive and Gram negative bacteria. In all cases, the activity rose as the concentration increased. Similarly, in the presence of light (Fig. 12 and S11†), all three solutions of different concentrations showed anti-bacterial activity to a higher degree. This may be because of the excitation of the nanocomposite by light and the formation of radicals such as reactive oxygen species (ROS), which induced improvement of bacteria killing through the ROS mechanism. This effectiveness of the composites may exert great mechanical damage on the cell walls of bacteria.
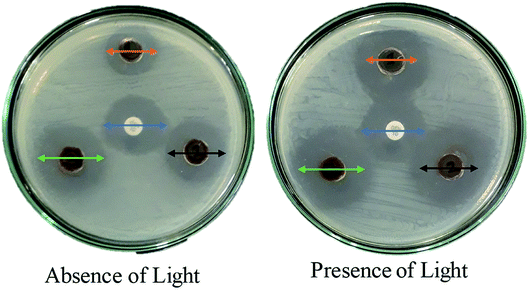 | ||
| Fig. 10 Effects of light on the anti-bacterial activity of Ag·NiMn2O4 against E. coli bacteria; arrows of the same color have the same length in both images (the center point is the GEN 10 standard). | ||
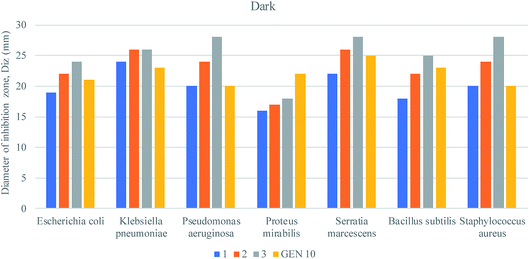 | ||
| Fig. 11 Anti-bacterial activities of the Ag·NiMn2O4 nanocomposite against pathogenic bacteria in the dark. | ||
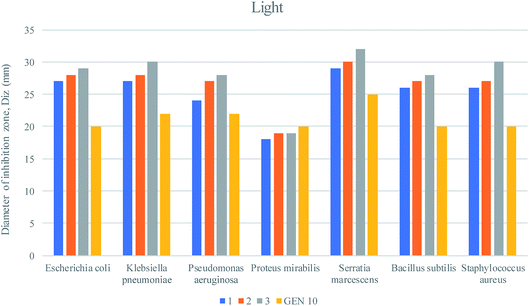 | ||
| Fig. 12 Anti-bacterial activities of the Ag·NiMn2O4 nanocomposite against pathogenic bacteria under light. | ||
Determination of MIC and MBC values of the Ag·NiMn2O4 nanocomposite against seven different bacteria
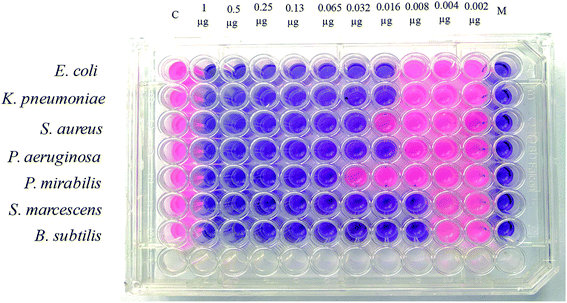
The minimum inhibitory concentration (MIC) is defined as the lowest concentration of a compound that will completely inhibit the visible growth of microorganisms after overnight incubation. The minimum bactericidal concentration (MBC) is the lowest concentration of an antibacterial agent required to kill a bacterium under a certain set of conditions over a specified, quite prolonged period, such as 18 hours or 24 hours.The MIC and MBC values of the Ag·NiMn2O4 nanocomposites were analyzed using the microdilution method according to the CLSI guidelines. The microorganisms used in this study, including E. coli, K. pneumoniae, S. aureus, P. aeruginosa, P. mirabilis, S. marcescens and B. subtilis, were grown in nutrient broth (0.5% NaCl, 0.5% peptone, 0.15% beef extract, 0.15% yeast extract; pH 7) for overnight at 37 °C in a shaker incubator (120 rpm). For the MIC test, 100 μL of the synthesized Ag·NiMn2O4 stock solution (1 μg μL−1) was added and diluted two-fold with the nutrient broth (NB) from column 2 to column 11. Column 1 served as a positive control (medium and bacterial inoculums) and column 12 served as a negative control (only medium). 2 μL of bacterial suspension was added to the respective wells containing Ag·NiMn2O4 solution according to McFarland standard 0.5 and incubated at 37 °C for 24 h. After 24 h of incubation, 20 μL of presto blue was added to each well, and the cells were further incubated at 37 °C for 2–4 h. A change from blue to pink indicates the reduction of resazurin and hence bacterial growth. Therefore, MIC was defined as the lowest concentration of the Ag·NiMn2O4 solution that prevented this change in color. A change in color of the growth control well to pink indicated the proper growth of the isolate, and the lack of change in color of the sterile control well indicated the absence of contaminants.
The MBC test was carried out by plating a suspension from each well of the microtiter plate onto Mueller–Hinton agar (MHA) plates. The plates were incubated at 37 °C for 24 h. The lowest concentration with no visible growth on the MHA plate was taken as the MBC value.
Fig. 13 shows the MIC and MBC values of Ag·NiMn2O4 nanocomposite against seven different Gram positive and Gram negative bacteria. The MIC is the lowest concentration of the anti-bacterial agent to inhibit the growth of bacteria. As shown in Table 3, the MIC values of Ag·NiMn2O4 against the multidrug-resistant (MDR) pathogens ranged from 0.008 to 0.65 μg μL−1. E. coli, K. pneumoniae, and P. aeruginosa showed MIC values of 0.016 μg μL−1, while S. aureus showed a 2 times higher MIC (0.032 μg μL−1) than these three pathogens. P. mirabilis showed a maximum MIC of 0.65 μg μL−1. S. marcescens and B. subtilis showed similar MICs of 0.008 μg μL−1, which were the lowest MICs in this study. The MBC is the lowest concentration of antibacterial agent needed to kill bacteria (no growth on the agar plate). In the study, the MBC for P. mirabilis was a maximum of 0.13 μg μL−1, while the lowest MBCs were found in the cases of S. marcescens and B. subtilis (0.0016 μg μL−1). E. coli, K. pneumoniae, and P. aeruginosa showed similar MBC values of 0.032 μg μL−1, while S. aureus showed a MBC of 0.065 μg μL−1.
| Isolate | MIC (μg μL−1) | MBC (μg μL−1) |
|---|---|---|
| E. coli | 0.016 | 0.032 |
| K. pneumoniae | 0.016 | 0.032 |
| S. aureus | 0.032 | 0.065 |
| P. aeruginosa | 0.016 | 0.032 |
| P. mirabilis | 0.065 | 0.130 |
| S. marcescens | 0.008 | 0.016 |
| B. subtilis | 0.008 | 0.016 |
In summary, the self-assembled nanostructured material, Ag·NiMn2O4, is expected to be applied as an efficient anti-bacterial agent against MDR bacteria as well as an industrial sterilization system.51,60–62
Electrochemical analysis of the Ag·NiMn2O4 nanomaterials/binder/GCE
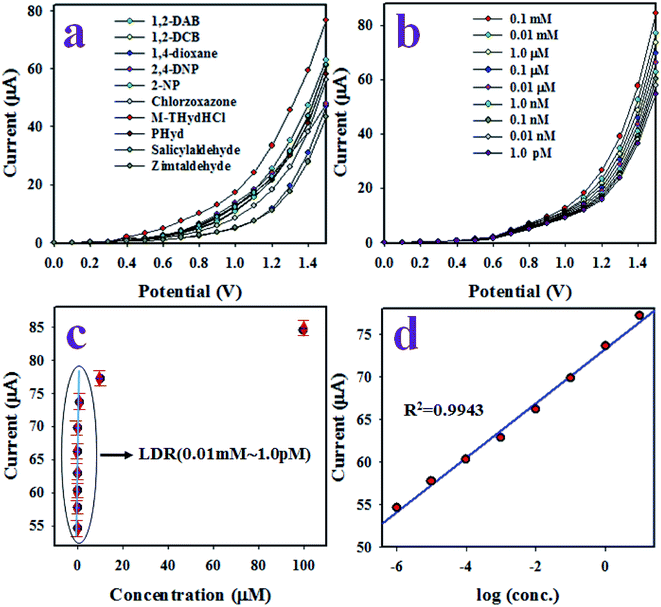
The electrochemical sensor based on Ag·NiMn2O4 nanomaterial/binder/GCE was prepared using a Keithley electrometer. The synthesized Ag·NiMn2O4 nanocomposite was deposited on GCE as a uniform layer of thin-film using a conductive Nafion binder. Because Nafion is a conductive co-polymer, it improved both the stability of the sensor and the electron transfer rate of the working electrode. A similar observation was reported for electrochemical analysis in a previous study.65,66 The proposed electrochemical sensor was applied to detect m-THyd in phosphate buffer medium with pH 7.0. To the best of our knowledge, the Ag·NiMn2O4 nanomaterial was applied for the first time as a sensing element to detect m-THyd; other reports are not available. During the electrochemical analysis of m-THyd, the observed current was measured on the surface of the thin film of Ag·NiMn2O4 nanomaterial/binder/GCE, and the holding period in the electrometer was set as 1.0 s. At the beginning of the electrochemical investigation, several chemicals known as environmental toxins were analyzed to evaluate the selectivity towards the assembled electrochemical sensor. Fig. 14(a) presents the electrochemical responses of m-THyd, 1,2-DAB, PHyd, 2,4-DNP, CB, 1,2-DCB, salicylaldehyde, 1,4-dioxane, and zimtaldehyde. These analyses were executed using 0.1 μM of each toxic chemical and a potential range of 0 to +1.5 V in phosphate buffer medium with pH 7.0. Obviously, the toxic m-THyd was found to be the most highly responsive chemical among all the toxins, as demonstrated in Fig. 14(a). Therefore, considering its highest I–V response, m-THyd was considered as a selective toxin for the assembled sensor based on Ag·NiMn2O4 nanomaterial/binder/GCE. After that, the m-THyd sensor was applied to analyze a series of m-THyd solutions based on the concentration range from 0.1 nM to 0.1 mM, as illustrated in Fig. 14(b). As shown in Fig. 14(b), the electrochemical responses are clearly distinguishable from lower to higher concentrations of m-THyd. Similar observed oxidation reactions to detect various toxins were described in our previous reports.67–69 Then, the calibration of the m-THyd sensor, as shown in Fig. 14(c), was established from the relationship of current vs. concentration of m-THyd. The current data for this calibration was isolated from Fig. 14(b) at a potential of +1.5 V. As shown in Fig. 14(c), the current data are regularly scattered in a linear manner from concentrations of 1.0 pM to 0.01 mM, and this range of concentration is defined as the linear dynamic range (LDR). This range of concentration (LDR) is wider. The slope of the calibration curve in the LDR was used to calculate the sensitivity of the proposed m-THyd sensor based on Ag·NiMn2O4 nanomaterial/binder/GCE, and it was found to be 47.2753 μA μM−1 cm−2. Obviously, this sensitivity is appreciable. The detection limit (DL) of the m-THyd sensor was estimated from the signal-to-noise ratio of 3, and the obtained value was equal to 0.97 ± 0.05 pM; this is a considerably low limit of detection. Fig. 14(d) shows the current vs. log(conc.) plot with R2 of 0.9943.
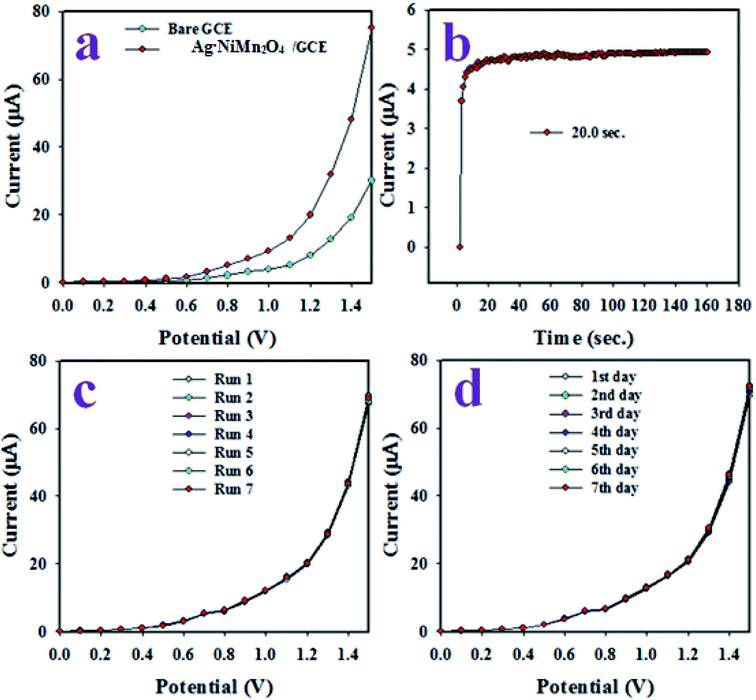
To estimate the reliability of the sensor performance, various tests were executed, as illustrated in Fig. 15. As shown in Fig. 15(a), the electrochemical responses for the coated and bare GCE with m-THyd at 0.1 μM concentration are illustrated at applied potentials of 0 to +1.5 V in phosphate buffer medium of pH 7.0. Obviously, the GCE coated with the Ag·NiMn2O4 nanomaterial showed the maximum electrochemical response. Thus, this test provides the information that the synthesized Ag·NiMn2O4 nanomaterial has high electrochemical activity in phosphate buffer medium. The response time of an electrochemical sensor is a vital characteristic, and it is defined as the time required by the sensor to execute a complete steady-state electrochemical response. From Fig. 15(b), it can be seen that the proposed m-THyd sensor exhibited an appreciable response time of around 20.0 s. This test was performed with 0.1 μM m-THyd in phosphate buffer medium of pH 7.0.
The reproducibility of an electrochemical sensor is another important precision measuring criterion, and this test was performed with 0.1 μM m-THyd in potentials ranging from 0 to +1.5 V in phosphate buffer, as illustrated in Fig. 15(c). As is apparent in Fig. 15(c), the seven runs are completely undistinguishable and replicated, and the intensity of this reproducible I–V response did not change even after washing the working electrode after each run under identical conditions. Therefore, the outcome of this reproducibility test confirmed the reliability of the electrode for the electrochemical analysis of real samples. The precision of the current data at a potential of +1.5 V of the reproducibility test was found to be 1.32% in terms of the relative standard deviation, which demonstrates the high precision of the reproducibility performance. The stability of the sensor during electrochemical analysis was prepared for considerable duration. To evaluate this performance, the proposed electrochemical sensor was applied to analyze m-THyd under similar conditions as in the reproducibility test for an extended period of around seven days, as demonstrated in Fig. 15(d). Analogous results to the reproducibility test were perceived. Therefore, it can be concluded that the projected m-THyd has enough stability in phosphate buffer for electrochemical analysis of the analyte (m-THyd). In summary, the proposed m-THyd chemical sensor exhibited good performance, such as appreciable sensitivity, wider LDR, lower DL, short response time, good reproducibility, stability for long duration and, above all, reliability in the analysis of real samples.
Analysis of real samples by the recovery method
The end application of an electrochemical sensor should be the detection of real samples collected from various environmental sources.50–52,60–62 Therefore, the assembled sensor based on Ag·NiMn2O4 nanomaterial/binder/GCE was applied to analyze a number of samples obtained from various environmental sources, such as a PC baby bottle, PC water bottle, industrial waste effluent, and PVC food packaging bag; the resulting data obtained by applying the recovery method are summarized in Table 4. As illustrated in Table 4, the data were deemed to be quite acceptable.| Sample | Added m-THyd conc. (μM) | Measured m-THyd conc.a by Ag·NiMn2O4 nanomaterial/binder/GCE (μM) | Average recoveryb (%) | RSDc (%) (n = 3) | ||
|---|---|---|---|---|---|---|
| R1 | R2 | R3 | ||||
| a Mean of three repeated determinations (signal-to-noise ratio: 3) of Ag·NiMn2O4 nanomaterial/binder/GCE.b Concentration of m-THyd determined/concentration taken (unit: nM).c The relative standard deviation values indicate precision among three repeated measurements (R1, R2, R3). | ||||||
| Industrial effluent | 0.0100 | 0.00992 | 0.00993 | 0.00984 | 98.97 | 0.50 |
| PC baby bottle | 0.0100 | 0.00969 | 0.00968 | 0.00963 | 96.57 | 0.33 |
| PC water bottle | 0.01000 | 0.00969 | 0.00955 | 0.00953 | 95.90 | 0.91 |
| PVC food packaging bag | 0.01000 | 0.00979 | 0.00981 | 0.00974 | 97.80 | 0.37 |
Conclusions
A Ag·NiMn2O4 nanocomposite has been successfully synthesized and characterized. The structure was predicted by XRD. SEM, EDS, EDS-mapping and AFM studies of the nanocomposite were performed to determine its surface and morphological aspects. PL studies of the trimetallic nanocomposite Ag·NiMn2O4 as well as of its three single metal oxides (Ag2O, NiO, and MnO) were performed. This nanocomposite showed photocatalytic dye degradation in both acidic and basic media. At pH 4, the efficiency was 91%, at pH 9, the efficiency was 77%, and in the presence of a catalytic amount of H2O2, the efficiency was 95%. However, in neutral buffer solution at pH 7, the efficiency was found to be 50%. This dye degradation capability in a wide pH range is rare and may be effective in real-world applications. The synthesized Ag·NiMn2O4 nanocomposite was also tested against some pathogenic bacteria, including both Gram positive (S. aureus, B. subtilis) and Gram negative bacteria (S. marcescens, E. coli, K. pneumoniae, P. aeruginosa, P. mirabilis) by the agar well diffusion method in the absence and presence of visible light. Apart from P. mirabilis, the Ag·NiMn2O4 nanocomposite showed higher activity against these bacteria compared to the standard antibiotic agent gentamicin. In all cases, the effectiveness was higher in the presence of light. This may be because of the excitation of the Ag·NiMn2O4 nanocomposite by light and the formation of the ROS in solution, which improved the effectiveness of bacteria killing through the ROS mechanism. A selective chemical sensor based on Ag·NiMn2O4 nanomaterial/binder/GCE was developed for analyzing m-THyd in phosphate buffer medium by an electrochemical approach. The assembled Ag·NiMn2O4 nanomaterial/binder/GCE as an m-THyd sensor showed considerable performance in terms of sensitivity, DL, LDR, response time, reproducibility, and long-term stability in phosphate buffer medium. It was utilized to detect m-THyd in real environmental samples by an electrochemical technique. Therefore, this method introduces a new route to develop selective chemical sensors using ternary doped nanomaterials for safety in the environmental and healthcare fields.Conflicts of interest
We declare that there is no conflict of interest.Acknowledgements
SUST Research Grant No. PS/2019/106 is gratefully acknowledged for funding. Md Abdus Subhan acknowledges Fulbright, USA for a Fulbright Visiting Scholar Award 2018–2019 during his stay at Northeastern University, Boston, MA, USA. The Center of Excellence for Advanced Materials Research (CEAMR), Chemistry Department, King Abdulaziz University, Jeddah, Saudi Arabia is highly acknowledged for financial support and research facilities.References
- X. Y. Wu, H. X. Qi, J. J. Ning, J. F. Wang, Z. G. Ren and J. P. Lang, One silver (I)/tetraphosphine coordination polymer showing good catalytic performance in the photodegradation of nitroaromatics in aqueous solution, Appl. Catal., B, 2015, 168, 98–104 CrossRef.
- S. C. Motshekga, S. S. Ray, M. S. Onyango and M. N. Momba, Preparation and antibacterial activity of chitosan-based nanocomposites containing bentonite-supported silver and zinc oxide nanoparticles for water disinfection, Appl. Clay Sci., 2015, 114, 330–339 CrossRef CAS.
- M. Moghaddari, F. Yousefi, M. Ghaedi and K. Dashtian, A simple approach for the sonochemical loading of Au, Ag and Pd nanoparticle on functionalized MWCNT and subsequent dispersion studies for removal of organic dyes: Artificial neural network and response surface methodology studies, Ultrason. Sonochem., 2018, 42, 422–433 CrossRef CAS PubMed.
- J. Oliva, A. I. Martinez, A. I. Oliva, C. R. Garcia, A. Martinez-Luevanos, M. Garcia-Lobato and A. Berlanga, Flexible graphene composites for removal of methylene blue dye-contaminant from water, Appl. Surf. Sci., 2018, 436, 739–746 CrossRef CAS.
- G. Sharma, V. K. Gupta, S. Agarwal, A. Kumar, S. Thakur and D. Pathania, Fabrication and characterization of Fe@MoPO nanoparticles: ion exchange behavior and photocatalytic activity against malachite green, J. Mol. Liq., 2016, 219, 1137–1143 CrossRef CAS.
- Y. Çalışkan, H. C. Yatmaz and N. Bektaş, Photocatalytic oxidation of high concentrated dye solutions enhanced by hydrodynamic cavitation in a pilot reactor, Process Saf. Environ. Prot., 2017, 111, 428–438 CrossRef.
- V. K. Gupta, S. Agarwal, A. Olgun, H. İ. Demir, M. L. Yola and N. Atar, Adsorptive properties of molasses modified boron enrichment waste based nanoclay for removal of basic dyes, J. Ind. Eng. Chem., 2016, 34, 244–249 CrossRef CAS.
- N. B. Bokhale, S. D. Bomble, R. R. Dalbhanjan, D. D. Mahale, S. P. Hinge, B. S. Banerjee and P. R. Gogate, Sonocatalytic and sonophotocatalytic degradation of rhodamine 6G containing wastewaters, Ultrason. Sonochem., 2014, 21(5), 1797–1804 CrossRef CAS PubMed.
- C. G. Joseph, G. L. Puma, A. Bono, Y. H. Taufiq-Yap and D. Krishnaiah, Operating parameters and synergistic effects of combining ultrasound and ultraviolet irradiation in the degradation of 2, 4, 6-trichlorophenol, Desalination, 2011, 276(1–3), 303–309 CrossRef CAS.
- S. Mosleh, M. R. Rahimi, M. Ghaedi, K. Dashtian and S. Hajati, Photocatalytic degradation of binary mixture of toxic dyes by HKUST-1 MOF and HKUST-1-SBA-15 in a rotating packed bed reactor under blue LED illumination: central composite design optimization, RSC Adv., 2016, 6(21), 17204–17214 RSC.
- K. Gul, S. Sohni, M. Waqar, F. Ahmad, N. N. Norulaini and A. K. Mohd Omar, Functionalization of magnetic chitosan with graphene oxide for removal of cationic and anionic dyes from aqueous solution, Carbohydr. Polym., 2016, 152, 520–531 CrossRef CAS PubMed.
- S. Khorramfar, N. M. Mahmoodi, M. Arami and H. Bahrami, Oxidation of dyes from colored wastewater using activated carbon/hydrogen peroxide, Desalination, 2011, 279(1–3), 183–189 CrossRef CAS.
- B. Kokabian, B. Bonakdarpour and S. Fazel, The effect of salt on the performance and characteristics of a combined anaerobic–aerobic biological process for the treatment of synthetic wastewaters containing Reactive Black 5, Chem. Eng. J., 2013, 221, 363–372 CrossRef CAS.
- S. Barredo-Damas, M. I. Alcaina-Miranda, M. I. Iborra-Clar and J. A. Mendoza-Roca, Application of tubular ceramic ultrafiltration membranes for the treatment of integrated textile wastewaters, Chem. Eng. J., 2012, 192, 211–218 CrossRef CAS.
- M. S. U. Rehman, M. Munir, M. Ashfaq, N. Rashid, M. F. Nazar, M. Danish and J. I. Han, Adsorption of Brilliant Green dye from aqueous solution onto red clay, Chem. Eng. J., 2013, 228, 54–62 CrossRef CAS.
- R. Abdallah and S. Taha, Biosorption of methylene blue from aqueous solution by nonviable Aspergillus fumigatus, Chem. Eng. J., 2012, 195, 69–76 CrossRef.
- M. C. Wei, K. S. Wang, C. L. Huang, C. W. Chiang, T. J. Chang, S. S. Lee and S. H. Chang, Improvement of textile dye removal by electrocoagulation with low-cost steel wool cathode reactor, Chem. Eng. J., 2012, 192, 37–44 CrossRef CAS.
- R. Yuan, S. N. Ramjaun, Z. Wang and J. Liu, Photocatalytic degradation and chlorination of azo dye in saline wastewater: kinetics and AOX formation, Chem. Eng. J., 2012, 192, 171–178 CrossRef CAS.
- H. Cui, X. Yang, Q. Gao, H. Liu, Y. Li, H. Tang and X. Yan, Facile synthesis of graphene oxide-enwrapped Ag3PO4 composites with highly efficient visible light photocatalytic performance, Mater. Lett., 2013, 93, 28–31 CrossRef CAS.
- A. J. Haider, R. Al-Anbari, H. M. Sami and M. J. Haider, Photocatalytic Activity of Nickel Oxide, J. Mater. Res. Technol., 2019, 8(3), 2802–2808 CrossRef CAS.
- S. Li, Z. Ma, L. Wang and J. Liu, Influence of MnO2 on the photocatalytic activity of P-25 TiO2 in the degradation of methyl orange, Sci. China, Ser. B: Chem., 2008, 51(2), 179–185 CrossRef CAS.
- S. Yoshizawa, D. Fourmy and J. D. Puglisi, Structural origins of gentamicin antibiotic action, EMBO J., 1998, 17(22), 6437–6448 CrossRef CAS PubMed.
- J. Ding, S. Zhu, T. Zhu, W. Sun, Q. Li, G. Wei and Z. Su, Hydrothermal synthesis of zinc oxide-reduced graphene oxide nanocomposites for an electrochemical hydrazine sensor, RSC Adv., 2015, 5(29), 22935–22942 RSC.
- S. Ameen, M. S. Akhtar and H. S. Shin, Highly sensitive hydrazine chemical sensor fabricated by modified electrode of vertically aligned zinc oxide nanorods, Talanta, 2012, 100, 377–383 CrossRef CAS PubMed.
- M. M. Rahman, Efficient formaldehyde sensor development based on Cu-codoped ZnO nanomaterial by an electrochemical approach, Sens. Actuators, B, 2020, 305, 127541 CrossRef.
- M. M. Rahman, Selective capturing of phenolic derivative by a binary metal oxide microcubes for its detection, Sci. Rep., 2019, 9(1), 1–10 CrossRef PubMed.
- P. Malik, M. Srivastava, R. Verma, M. Kumar, D. Kumar and J. Singh, Nanostructured SnO2 encapsulated guar-gum hybrid nanocomposites for electrocatalytic determination of hydrazine, Mater. Sci. Eng., C, 2016, 58, 432–441 CrossRef CAS PubMed.
- M. A. Aziz and A. N. Kawde, Gold nanoparticle-modified graphite pencil electrode for the high-sensitivity detection of hydrazine, Talanta, 2013, 115, 214–221 CrossRef PubMed.
- X. Gu, X. Li, S. Wu, J. Shi, G. Jiang, G. Jiang and S. Tian, A sensitive hydrazine hydrate sensor based on a mercaptomethyl-terminated trinuclear Ni (II) complex modified gold electrode, RSC Adv., 2016, 6(10), 8070–8078 RSC.
- I. Tiwari, M. Gupta, P. Sinha and C. E. Banks, Simultaneous determination of hydrazine and phenyl hydrazine using 4′-(4-carboxyphenyl)-2,2′:6′,2′′ terpyridine diacetonitrile triphenylphosphine ruthenium (II) tetrafluoroborate complex functionalized multiwalled carbon nanotubes modified electrode, Mater. Res. Bull., 2014, 60, 166–173 CrossRef CAS.
- A. D. Arulraj, M. Vijayan and V. S. Vasantha, Spectrophotometric determination of pico-molar level of hydrazine by using Alizarin red in water and urine samples, Spectrochim. Acta, Part A, 2015, 148, 355–361 CrossRef CAS PubMed.
- S. Amlathe and V. K. Gupta, Spectrophotometric determination of trace amounts of hydrazine in polluted water, Analyst, 1988, 113(9), 1481–1483 RSC.
- M. M. Alam, A. M. Asiri and M. M. Rahman, Fabrication of phenylhydrazine sensor with V2O5 doped ZnO nanocomposites, Mater. Chem. Phys., 2020, 243, 122658 CrossRef CAS.
- M. M. Rahman, M. M. Alam and K. A. Alamry, Sensitive and selective m-tolyl hydrazine chemical sensor development based on CdO nanomaterial decorated multi-walled carbon nanotubes, J. Ind. Eng. Chem., 2019, 77, 309–316 CrossRef CAS.
- E. H. Vernot, J. D. MacEwen, R. H. Bruner, C. C. Haun, E. R. Kinkead, D. E. Prentice and J. T. Young, Long-term inhalation toxicity of hydrazine, Toxicol. Sci., 1985, 5(6 part 1), 1050–1064 CrossRef CAS.
- R. F. Kimball, The mutagenicity of hydrazine and some of its derivatives, Mutat. Res., Rev. Genet. Toxicol., 1977, 39(2), 111–126 CrossRef CAS.
- S. D. Zelnick, D. R. Mattie and P. C. Stepaniak, Occupational exposure to hydrazines: treatment of acute central nervous system toxicity, Aviat., Space Environ. Med., 2003, 74(12), 1285–1291 CAS.
- M. M. Rahman, J. Ahmed, A. M. Asiri, I. A. Siddiquey and M. A. Hasnat, Development of highly-sensitive hydrazine sensor based on facile CoS 2–CNT nanocomposites, RSC Adv., 2016, 6(93), 90470–90479 RSC.
- A. Safavi and A. A. Ensafi, Kinetic spectrophotometric determination of hydrazine, Anal. Chim. Acta, 1995, 300(1–3), 307–311 CrossRef CAS.
- S. Ganesh, F. Khan, M. K. Ahmed, P. Velavendan, N. K. Pandey and U. K. Mudali, Spectrophotometric determination of hydrazine with para-(dimethylamino) benzaldehyde in aqueous streams of purex process, Int. J. Nucl. Energy Sci. Eng., 2012, 2, 1 Search PubMed.
- A. Safavi and M. R. Baezzat, Flow injection chemiluminescence determination of hydrazine, Anal. Chim. Acta, 1998, 358(2), 121–125 CrossRef CAS.
- J. Lv, Y. Huang and Z. Zhang, Determination of hydrazine by flow injection with chemiluminescence, Anal. Lett., 2001, 34(8), 1323–1330 CrossRef.
- A. D. Smolenkov, Chromatographic methods of determining hydrazine and its polar derivatives, Rev. J. Chem., 2012, 2(4), 329–354 CrossRef.
- G. Elias and W. F. Bauer, Hydrazine determination in sludge samples by high-performance liquid chromatography, J. Sep. Sci., 2006, 29(3), 460–464 CrossRef CAS PubMed.
- E. C. Olson, The coulometric determination of hydrazine and substituted hydrazines, Anal. Chem., 1960, 32(12), 1545–1547 CrossRef CAS.
- G. E. Collins and S. L. Rose-Pehrsson, Fluorescent detection of hydrazine, monomethylhydrazine, and 1,1-dimethylhydrazine by derivatization with aromatic dicarbaldehydes, Analyst, 1994, 119(8), 1907–1913 RSC.
- M. Sun, J. Guo, Q. Yang, N. Xiao and Y. Li, A new fluorescent and colorimetric sensor for hydrazine and its application in biological systems, J. Mater. Chem. B, 2014, 2(13), 1846–1851 RSC.
- L. Lauko, R. Hudec, K. Lenghartova, A. Manova, F. Cacho and E. Beinrohr, Simple electrochemical determination of hydrazine in water, Pol. J. Environ. Stud., 2015, 24(4), 1659–1666 CrossRef CAS.
- M. M. Rahman, M. M. Alam and A. M. Asiri, Detection of toxic choline based on Mn2O3/NiO nanomaterials by an electrochemical method, RSC Adv., 2019, 9(60), 35146–35157 RSC.
- M. M. Alam, A. M. Asiri, M. T. Uddin, M. A. Islam, M. R. Awual and M. M. Rahman, Detection of uric acid based on doped ZnO/Ag2O/Co3O4 nanoparticle loaded glassy carbon electrode, New J. Chem., 2019, 43(22), 8651–8659 RSC.
- M. A. Subhan, T. P. Rifat, P. C. Saha, M. M. Alam, A. M. Asiri, M. M. Rahman and J. Uddin, Enhanced visible light-mediated photocatalysis, antibacterial functions and fabrication of a 3-chlorophenol sensor based on ternary Ag2O·SrO·CaO, RSC Adv., 2020, 10(19), 11274–11291 RSC.
- M. A. Subhan, P. C. Saha, S. A. Sumon, J. Ahmed, A. M. Asiri, M. M. Rahman and M. AlMamun, Enhanced photocatalytic activity and ultrasensitive benzaldehyde sensing performance of a SnO2·ZnO·TiO2 nanomaterial, RSC Adv., 2018, 8, 33048–33058 RSC.
- V. Biju, N. Sugathan, V. Vrinda and S. L. Salini, Estimation of lattice strain in nanocrystalline silver from X-ray diffraction line broadening, J. Mater. Sci., 2008, 43(4), 1175–1179 CrossRef CAS.
- G. Geoprincy, P. Saravanan, N. N. Gandhi and S. Renganathan, A novel approach for studying the combined antimicrobial effects of silver nanoparticles and antibiotics through agar over layer method and disk diffusion method, Dig. J. Nanomater. Bios., 2011, 6(4), 1557–1565 Search PubMed.
- S. Maensiri, C. Masingboon, P. Laokul, W. Jareonboon, V. Promarak, P. L. Anderson and S. Seraphin, Egg white synthesis and photoluminescence of platelike clusters of CeO2 nanoparticles, Cryst. Growth Des., 2007, 7(5), 950–955 CrossRef CAS.
- S. Gnanam and V. Rajendran, Synthesis of CeO2 or α–Mn2O3 nanoparticles via sol–gel process and their optical properties, J. Sol-Gel Sci. Technol., 2011, 58(1), 62–69 CrossRef CAS.
- M. L. Yola, T. Eren, N. Atar and S. Wang, Adsorptive and photocatalytic removal of reactive dyes by silver nanoparticle-colemanite ore waste, Chem. Eng. J., 2014, 242, 333–340 CrossRef CAS.
- C. S. Turchi and D. F. Ollis, Photocatalytic degradation of organic water contaminants: mechanisms involving hydroxyl radical attack, J. Catal., 1990, 122(1), 178–192 CrossRef CAS.
- H. El-Ekabi and N. Serpone, Kinetic studies in heterogeneous photocatalysis. 1. Photocatalytic degradation of chlorinated phenols in aerated aqueous solutions over TiO2 supported on a glass matrix, J. Phys. Chem., 1988, 92, 5726 CrossRef.
- M. A. Subhan, S. S. Jhuma, P. C. Saha, M. M. Alam, A. M. Asiri, M. A. Mamun, S. A. Attia, T. H. Emon, A. K. Azad and M. M. Rahman, Efficient selective 4-aminophenol sensing and antibacterial activity of ternary Ag2O3·SnO2·Cr2O3 nanoparticles, New J. Chem., 2019, 43, 10352 RSC.
- M. A. Subhan, S. S. Jhuma, P. C. Saha, J. Ahmed, A. M. Asiri, T. P. Rifat, T. Raihan, A. K. Azad and M. M. Rahman, Photocatalysis, enhanced anti-bacterial performance and discerning thiourea sensing of Ag2O·SnO2·TiO2 hetero-structure, J. Environ. Chem. Eng., 2020, 8, 104051 CrossRef CAS.
- M. A. Subhan, P. C. Saha, M. M. Rahman, J. Ahmed, A. M. Asiri and M. A. Mamun, Fabrication of a 2,4-dinitrophenol sensor based on Fe3O4@Ag@Ni nanomaterials and studies on their antibacterial properties, New J. Chem., 2018, 42, 872 RSC.
- L. Zhang, Y. Jiang, Y. Ding, M. Povey and D. York, Investigation into the antibacterial behaviour of suspensions of ZnO nanoparticles (ZnO nanofluids), J. Nanopart. Res., 2007, 9(3), 479–489 CrossRef CAS.
- N. Talebian, S. M. Amininezhad and M. Doudi, Controllable synthesis of ZnO nanoparticles and their morphology-dependent antibacterial and optical properties, J. Photochem. Photobiol., B, 2013, 120, 66–73 CrossRef CAS PubMed.
- M. M. Rahman, M. M. Hussain, M. N. Arshad, M. R. Awual and A. M. Asiri, Arsenic sensor development based on modification with (E)-N′-(2-nitrobenzylidine)-benzenesulfonohydrazide: a real sample analysis, New J. Chem., 2019, 43(23), 9066–9075 RSC.
- M. M. Rahman, M. M. Alam and A. M. Asiri, Development of an efficient phenolic sensor based on facile Ag2O/Sb2O3 nanoparticles for environmental safety, Nanoscale Adv., 2019, 1(2), 696–705 RSC.
- M. M. Alam, A. M. Asiri, M. T. Uddin, M. A. Islam and M. M. Rahman, Wet-chemically prepared low-dimensional ZnO/Al2O3/Cr2O3 nanoparticles for xanthine sensor development using an electrochemical method, RSC Adv., 2018, 8(23), 12562–12572 RSC.
- M. M. Rahman, M. M. Alam, M. M. Hussain, A. M. Asiri and M. E. M. Zayed, Hydrothermally prepared Ag2O/CuO nanomaterial for an efficient chemical sensor development for environmental remediation, Environmental Nanotechnology, Monitoring and Management, 2018, 10, 1–9 CrossRef CAS.
- M. M. Rahman, M. M. Alam and A. M. Asiri, Selective hydrazine sensor fabrication with facile low-dimensional Fe2O3/CeO2 nanocubes, New J. Chem., 2018, 42(12), 10263–10270 RSC.
Footnote |
| † Electronic supplementary information (ESI) available. See DOI: 10.1039/d0ra05008c |
| This journal is © The Royal Society of Chemistry 2020 |

