 Open Access Article
Amplified piezoelectrically actuated on-chip flow switching for a rapid and stable microfluidic fluorescence activated cell sorter†
Kunpeng Cai *,
Shruti Mankar,
Anastasia Maslova
 ,
Taiga Ajiri and
Tasuku Yotoriyama
Central Research Laboratories, Sysmex Corporation, 4-4-4 Takatsukadai, Nishi-ku, Kobe 651-2271, Japan. E-mail: Cai.Kunpeng@sysmex.co.jp
First published on 5th November 2020
Abstract
With the potential to avoid cross-contamination, eliminate bio-aerosols, and minimize device footprints, microfluidic fluorescence-activated cell sorting (μ-FACS) devices could become the platform for the next generation cell sorter. Here, we report an on-chip flow switching based μ-FACS mechanism with piezoelectric actuation as a fast and robust sorting solution. A microfluidic chip with bifurcate configuration and displacement amplified piezoelectric microvalves has been developed to build the μ-FACS system. Rare fluorescent microparticles of different sizes have been significantly enriched from a purity of ∼0.5% to more than 90%. An enrichment of 150-fold from ∼0.6% to ∼91% has also been confirmed for fluorescently labeled MCF-7 breast cancer cells from Jurkat cells, while viability after sorting was maintained. Taking advantage of its simple structure, low cost, fast response, and reliable flow regulation, the proposed μ-FACS system delivers a new option that can meet the requirements of sorting performance, target selectivity, device lifetime, and cost-effectiveness of implementation.
1 Introduction
Purification and enrichment of well-defined cell populations from a heterogeneous complex mixture is becoming a critical task in areas of biology and medicine.1 The need for sorting rare cell populations is rapidly expanding, such as the enrichment of circulating tumor cells (CTCs),2 circulating fetal cells (CFCs),3 gene edited mammalian cells,4 hematopoietic stem cells (HSCs)5,6 and induced pluripotent stem cells from HSCs.7 Recently, the demand for high performance cell sorting has been further driven by theranostics and personalized medicine, where treatments are tailored to the prognosis of patients.8Offering numerous advantages over conventional FACS systems, μ-FACS devices could become the next generation cell sorters by reducing device footprints, eliminating bio-aerosols, and simplifying protocols.1,9–17 Unique approaches, including electric,18–21 magnetic,22,23 acoustic,9,24–34 pneumatic,35,36 piezoelectric,37–40 and thermal actuations,41–43 have been developed as actuation mechanisms for μ-FACS systems.44 Among them, due to the reliable flow regulation on the microscale, mechanical valving is considered to be one of the promising sorting technologies.45 A plurality of piezoelectric microvalves have been proposed as high-performance mechanical microvalves,46–49 displaying the advantages of large driving force, rapid response and high tolerance. The shortcoming of small strokes of piezoelectric microvalves has also been overcome by the hydraulic amplification.50 However, problems such as complex structure, high cost and leakage are still existing and preventing piezoelectric microvalves from being applied in μ-FACS systems.51
In this work, we demonstrate a new design of amplified piezoelectrically actuated microvalve and applied it to demonstrate an on-chip flow switching based sorting mechanism. A bifurcately configurated microfluidic chip and displacement amplifiers for piezoelectric actuators have been developed for the construction of the μ-FACS system. A throughput of ∼1800 events per second (eps) has been achieved as a proof-of-concept. Using the as-constructed μ-FACS system, rare fluorescent particles at diverse sizes have been significantly enriched from a purity of ∼0.5% to more than 90%. The μ-FACS system has also been applied to enrich 0.6% of fluorescently labeled MCF-7 breast cancer cells from Jurkat cells by 150-fold to a purity of ∼91%. With the characteristics of simple structure, fast response, low cost, and high reliability, our proposed system provides a new μ-FACS option that can meet the requirements of sorting performance, target selectivity, device lifetime, and cost-effectiveness of implementation.
2 Working principle and theory
2.1 Flow control by piezoelectrically actuated microvalves
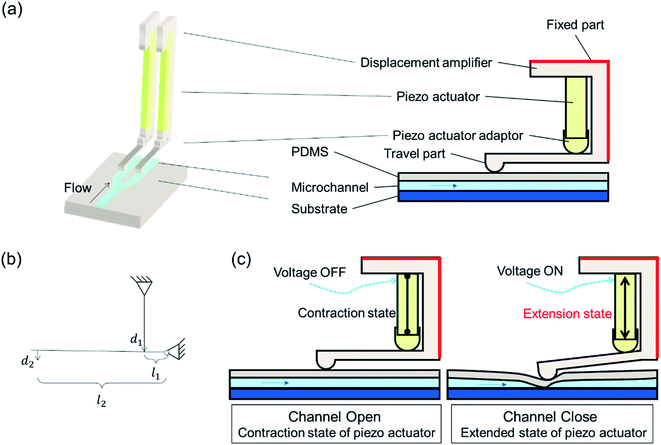
The simplified schematic of the microfluidic sorter, including a bifurcated microchannel configuration and amplified piezoelectrically actuated on-chip microvalves, is shown in Fig. 1(a). Piezoelectric actuators are housed in displacement amplifiers, which are composed of fixed parts and travel parts. The displacement amplifier is mounted in a way that the moving direction of its travel part is perpendicular to the microfluidic channel inside a dimethylpolysiloxane (PDMS) layer. An adapter was applied between the piezoelectric actuator and displacement amplifier to protect the piezoelectric actuator and prolong its lifetime. As shown in Fig. 1(b), the principle of leverage was used to augment a displacement input of the piezoelectric actuator to a displacement of the travel part of the amplifier. The following equation could be used for calibration.
 | (1) |
The design of the microfluidic sorting chip is given in Fig. 2(a), while the positioning of travel parts of displacement amplifiers on microfluidic channels are shown in a cross-section view in Fig. 2(b). The sample solution that is introduced into the microfluidic chip will be focused by the sheath fluid at a sample focusing site, as shown in Fig. 2(c). A detection spot is designed along the mainstream to collect signals. A bifurcated sorting site is designed on the downstream to isolate particles in a mixture into separated channels, namely sample channel and waste channel. Travel parts of the two displacement amplifiers, as given in Fig. 2(b), are placed at on-chip valve sites on the downstream to independently regulate the Open–Close status of each microchannel. The stroking area of the travel part of the displacement amplifier onto microchannel is marked in a green dotted circle at location 3 of Fig. 2(c). The width of the microchannel on the downstream of the stroking area is designed to be twice the width of the microchannel on the upstream to reduce backflow when the travel part closes the microchannel. The separated particles could be collected from downstream outlets after sorting.
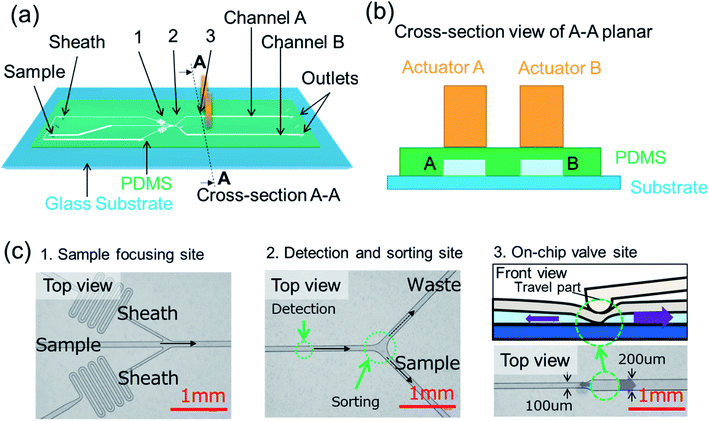 | ||
| Fig. 2 (a) Design of the microfluidic sorting chip. (b) Cross-section view of the microfluidic chip and piezoelectric actuators. (c) Photos of the microfluidic chip at location 1, 2 and 3 of Fig. 2(a). | ||
2.2 Sorting mechanism of flow switching
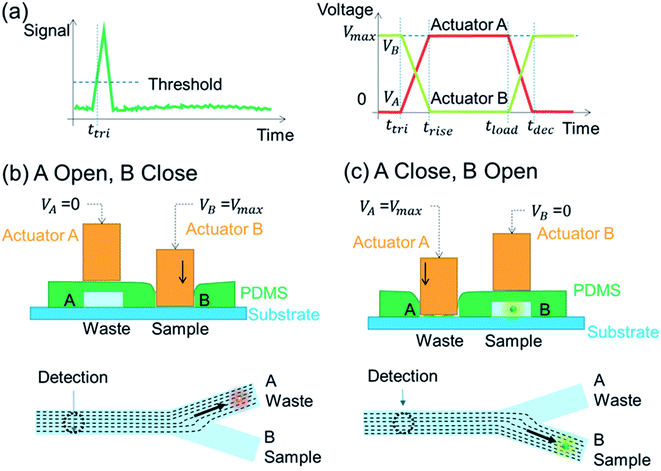
Fig. 3 shows an illustration of flow switching during a sorting action. The input voltage on the piezoelectric actuator for the sample channel (B) is kept as normal-on to keep the sample channel as normally closed, as shown in Fig. 3(b). Correspondingly, input voltage on the waste channel (A) is kept as normal-off to maintain the waste channel as normal-open and collect the non-target particles. When a target particle passes through the detection spot, a peak signal would be detected, as shown in Fig. 3(a). If the intensity of the signal exceeds a customer determined threshold, trigger signals would be simultaneously generated to switch the status of voltages on the two piezoelectric actuators and maintain for a user-determined sorting period. During the sorting period, the sample channel (B) will be open, while the waste channel (A) will be closed. As a result, the detected target particle would be collected into the sample channel (B), as shown in Fig. 3(c). After the sorting period, the voltage inputs on piezoelectric actuators would be reset to initial status to shift the successive flow back to the waste channel again.As shown in Fig. 3(a), the sorting period for a piezoelectric actuator valve could be determined by the following equation,
 | (2) |
The volume of liquid that is streamed into the sample channel during the sorting period, namely switching volume, could be defined as follows,
| υswt = tsort·Qsamp | (3) |
 | (4) |
3 Experimental
3.1 Manufacturing of microfluidic sorting chip
A two-layer microfluidic sorting chip was implemented for experiments, as shown in Fig. 2. Microfluidic channels with a depth of 40 μm were fabricated in a PDMS layer, the thickness of which is designed as 300 μm. The as-fabricated PMDS layer was then bonded onto a 1 mm thick rigid glass layer. Through holes were opened on the glass layer as inlets and outlets of microfluidic channels. The sorting chip was designed inhouse, while fabrication was outsourced to a domestic semiconductor manufacturer, where standard micro-electromechanical systems (MEMS) fabrication was carried out. A customized fluidics interface was also fabricated to accommodate the microfluidic sorting chip and to improve the user-friendship of sample handling (see ESI files† for more information).3.2 System of the microfluidic fluorescence-activated sorter
The as-constructed μ-FACS system is shown in Fig. 4(a). An inverted microscope was built to collect signals from the detection spot of the microfluidic sorting chip, which is mounted on the focal plane of an objective lens (PAL-5, Sigmakoki co.,ltd., Japan). A 488 nm and 100 mW laser (OBIS Galaxy Laser Beam Combiner, Coherent, CA, US) was adopted as a light source for excitation. The laser beam was reflected by a long-pass dichroic mirror (DMLP505R, Sigmakoki co.,ltd., Japan) into an objective lens to focus on the detection spot. The excited fluorescent emission signals from samples were then collected into optical lines through the same objective lens. After passing through the DMLP505R long-pass dichroic mirror, 20% of the emission light was split by an ND filter (ND501B, Thorlabs, Inc., US) to a highspeed camera (CHU30-B, Shodensha, Japan) for real-time observation in bright field. After passing through a long-pass dichroic mirror (DMLP550R, Sigmakoki co.,ltd., Japan) and a light filter (MF525-39, Sigmakoki co.,ltd., Japan), the left emission light was focused onto the detection surface of an MPPC module (C13366-1350GA, Hamamatsu Photonics K.K., Japan) for intensity detection of green fluorescence, as shown in Fig. 4(a).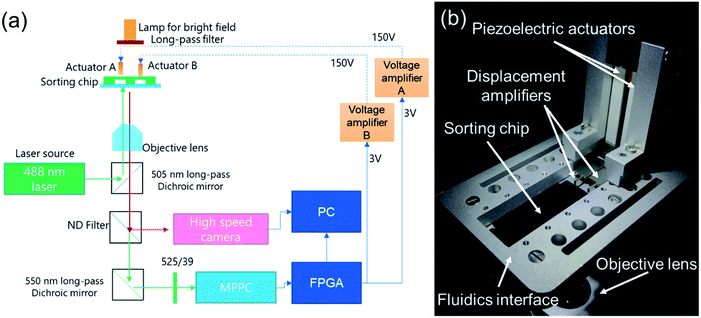 | ||
| Fig. 4 Overview of the constructed fluorescence-activated cell sorting system. (a) Schematic of the optical detection system. (b) Photograph of the experimental setup. | ||
To enable real-time monitoring and control, a high-performance controller (cRIO-9040, National Instruments Corp., US) was applied, with a combination of a data acquisition unit (NI9220, National Instruments Corp., US) and a digital output unit (NI9474, National Instruments Corp., US). A customized control software interface was correspondingly built using Labview (NI, US). A DC power supply of 3 V was used as the input for the NI9474 unit. To drive the piezoelectric actuators (AE0203D44H40DF, Tokin Corp., Japan), two high-voltage power amplifiers (MTAD3001, Mechano Transformer Corp., Japan) were used to amplify the output voltage of NI9474 from 3 V to 150 V. Fig. 4(b) shows a photo of the as-constructed on-chip microfluidic sorter, which is composed of a sorting chip, piezoelectrically actuated on-chip microvalves, fluidics interface, and optical detection system. Travel parts of the customized displacement amplifiers are positioned towards the PDMS layer, while fixed parts of displacement amplifiers are firmly settled on the fluidics interface.
3.3 Cell culture
MCF-7 (breast cancer cell) was purchased from the American Type Culture Collection (ATCC Cat. no. HTB-22) and cultured in Dulbecco's modified Eagle's medium (DMEM, MilliporeSigma, US) with 10% fetal bovine serum (FBS, MilliporeSigma, US) and 1% antibiotic antimycotic solution (MilliporeSigma, US).Jurkat cells (T lymphocyte) was purchased from the American Type Culture Collection (ATCC Cat. no. TIB-152) and cultured in RPMI 1640 medium (Thermo Scientific, US) with 10% fetal bovine serum (FBS, MilliporeSigma, US) and 1% antibiotic antimycotic solution (MilliporeSigma, US). The cells were sub-cultured every 2 to 3 days and maintained at 37 °C, 5% (v/v) CO2 in a humidified incubator.
3.4 Cell viability test
All cells were stained with Hoechst 33342 solution (Dojindo, Japan), while dead cells were stained with 7-AAD viability staining solution (BioLegend, US). A flow cytometer (FACSVerse, BD Biosciences, US) was used to quantify the number of cells after staining. The dead cell ratio was evaluated by means of the ratio of 7-AAD stained cell number to the total cell number. The cell viability was then obtained by subtracting the dead cell ratio from 1.3.5 Sorting performance evaluation method
Both microparticles and cells were used for performance evaluation. Green fluorescent beads (Fluoro-Max, 15 μm, Thermo Scientific, US) were used as target beads and intentionally spiked into non-target red fluorescent beads (Fluoro-Max, DIAM. 3.2 μm, Thermo Scientific, US) in deionized water at a target frequency of ∼0.5%. To investigate the relationship between purity and throughput, total concentration of samples was independently prepared as ∼2.3 × 10⁵, 6.5 × 10⁵, 1.1 × 10⁶, 1.7 × 10⁶, 3.3 × 10⁶ beads per mL. Additionally, green fluorescent beads of different size (Fluoro-Max, DIAM. 5 μm, 10 μm, 15 μm, 25 μm, Thermo Scientific, US) were separately used to study the size dependency of sorting performance, targeting a total concentration of ∼2.3 × 10⁵ beads per mL. For flow profiling during sorting, green fluorescent beads (Fluoro-Max, 10 μm, Thermo Scientific, US) were encapsulated into uniform ∼30 μm water droplets in oil (FC40, RAN Biotechnologies, US) using a commercial droplet generation chip (3200286, Dolomite Microfluidics, UK) at a target frequency of ∼0.01%.MCF-7 cells were stained with carboxyfluorescein diacetate succinimidyl ester (CFSE, Thermo Scientific, US) and spiked into Hoechst 33342 (Dojindo, Japan) stained Jurkat cells in RPMI medium at a target frequency of ∼0.5%. Total cell concentration was prepared as ∼3 × 10⁵ cells per mL.
Quantification before and after sorting was carried out on a flow cytometer, (Accuri C6, BD Biosciences, US), where 50 μL of samples were measured under customized slow flow rate mode. Experiments were repeated three times for each condition. Meanwhile, fluorescence images of samples were taken before and after sorting, using a fluorescence microscope (BZ-X710, Keyence, Japan).
400 μL of mixed beads solution or cell mixture solution was input into the sorting chip at a flow rate of ∼40 μL min−1, while the flow rate of the sheath solution was maintained as ∼120 μL min−1. Deionized water and RPMI medium are separately used as sheath solutions for the sorting of microparticles and cells. The sampling rate was set as 100 kHz for signal collection, while the threshold for triggering of sorting signals was adjusted to achieve an over 80% yield. The sorting duration to collect target beads was set as 0.2 ms. Both the total sorting time and volume of the collected sample were recorded for performance calculation.
4 Results and discussion
4.1 Calculation of sorting responsiveness using on-chip flow switching
To complete a rapid sorting action, a high operating frequency is demanded in all processes of the as-constructed sorting system, including signal sampling, digital trigger output, voltage amplification, piezoelectric actuation, valving, and recovery of the microchannel. The overall operating frequency is determined by the slowest step of the entire sorting process.Using the FPGA model, an action of receiving sample signal and outputting the 3 V digital trigger could be finished within microseconds, which qualifies an operation of over 100 kHz.
According to technical specifications, the unloaded resonant frequency (f0) of the applied piezoelectric actuator is 34 kHz. Applying a load to the actuator will reduce its resonant frequency. Giving the mass of the piezoelectric actuator (m, 2.14 g), and the mass of the load (M, 12.79 g), the loaded resonant frequency ( ) may be estimated using the following equation,
 | (5) |
As is known, the fastest displacement of a piezoelectric actuator can occur in 1/3 of the period of its resonant frequency, which indicates a theoretical operating frequency of ∼2.6 kHz for this setup. Meanwhile, to achieve a fast response, large peak current is required for charging the piezoelectric actuators. Upon loading of a pulsed voltage, the minimal rise time of voltage on piezoelectric actuators can be determined using the following equation,
 | (6) |
As passive deformation of PDMS microchannel induced by piezoelectric actuation was used as an on-chip microvalve, as shown in Fig. 1(c), rapid recovery of the same microchannel to its original status after deformation is also required. The recovery speed depends on the natural frequency of the PDMS channel, which could be determined by the following equation,39
 | (7) |
4.2 Profiling of on-chip flow switching
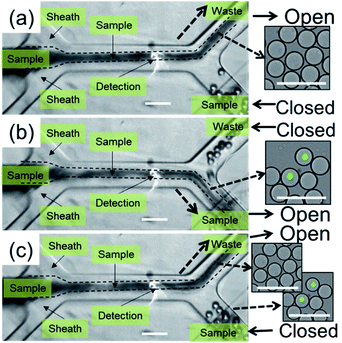
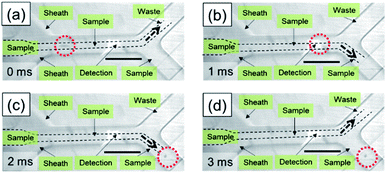
To illustrate the flow profile during a sorting actuation, sequential images were taken before, during, and after sorting, as shown in Fig. 5. Instead of microparticles, water-in-oil droplets with a uniform diameter of 30 μm were input as the sample to enhance light scattering. Moreover, the sample was injected into the microchannel in a bulky way instead of a one-by-one sequential manner. Fig. 5(a) shows an image at a moment before sorting, where the waste channel is open, and the sample channel is closed. On detection of a fluorescent signal, the intensity of which is higher than the preset threshold, the sample channel was opened promptly, while the waste channel was closed at the same time, causing fluid at the sorting site flowing into the sample channel, as shown in Fig. 5(b). As a result, target droplets will be guided into the sample channel during the sorting period. After sorting, the sample channel was subsequently closed, while the waste channel was simultaneously opened, setting streams back to the initial status. Due to the bulky sample injection, droplets with green fluorescent beads were only enriched from ∼0.008% to ∼1%. However, the sorting performance could be improved by lining up droplets and optimizing sorting conditions, in a similar way as we will discuss for sorting of microparticles and cells.Sequential images of the on-chip sorting of fluorescent microparticles are provided in Fig. 6. Although sample contrast was reduced, flow modulation during a sorting actuation was observed to follow the same manner as shown in Fig. 5. A target fluorescent bead was successfully detected and sorted into the sample channel, as marked in the red dotted circle in Fig. 6(b) and (c). Correspondingly, the following solution without target particles was flowed into the waste channel, as shown in Fig. 6(a) and (d). The fluorescence activated sorting of microparticles is also shown by a video in the ESI, where the positions of microparticles are marked by yellow arrows.†
4.3 Sorting performance of the microfluidic fluorescence-activated sorter
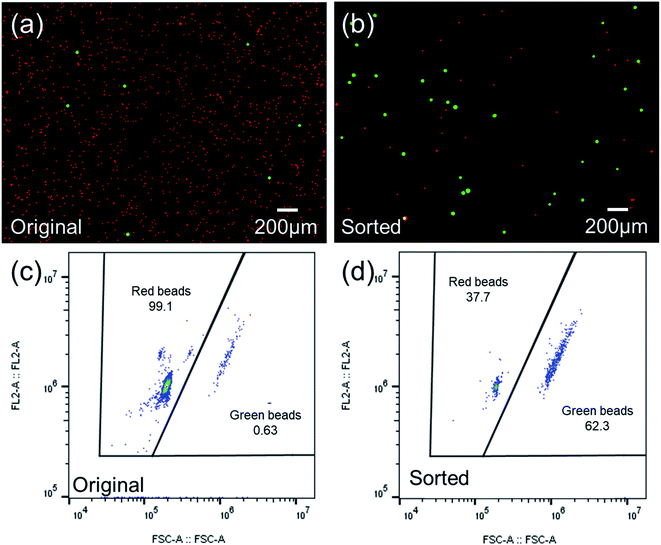
As a qualitative comparison, Fig. 7(a) and (b) show photos of the original sample and sorted sample for a fluorescent microparticles mixture, with 0.66% of 15 μm green target beads. It could be observed that the frequency of green fluorescent beads in the sorted sample has been increased significantly from that of the original sample. The enrichment was also confirmed by FCM scatters measured before and after sorting, as shown in Fig. 7(c) and (d).To quantitatively evaluate the performance of the as-constructed on-chip sorter, FCM results were utilized to calculate throughput, yield, and purity by the following equations,
 | (8) |
 | (9) |
 | (10) |
According to data from three repeated experiments, green fluorescent beads were found to be enriched from 0.66% (±0.02%) to 59.86% (±2.33%), which reveals a 90-fold enrichment for a sorting throughput of 1200 eps. Based on the obtained FCM results, yield (recovery rate) could be optimized to ∼98.5%, indicating no obvious sample loss during sorting.
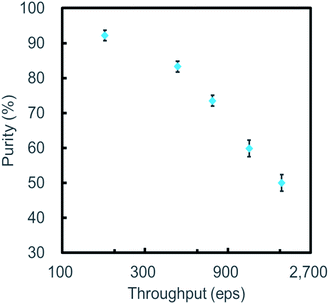
Similar to other microfluidic sorters,52 trade-offs among throughput, yield, and purity were also observed in this work. In our experiments, settings of the on-chip sort system were optimized to obtain a high yield in favor of purity. However, purity can also be improved in favor of the yield or throughput. Fig. 8 shows the plot of purity as a function of throughput where throughput was adjusted by changing sample concentration. The yield was maintained to be higher than 80% for all these experiments. The purity of the sorted sample is observed to decrease as throughput increases, following the prediction of Poisson distribution. The sampling rate of our data acquisition (DAQ) unit set a limitation on the flow rate of sample delivery. Hence, throughput was demonstrated up to ∼1800 eps in Fig. 8, resulting in purity between ∼92% and ∼50%. With an upgraded DAQ unit and a new chip design, a higher purity could be achieved near the theoretical operating frequency, by diluting the input sample, improving the sample flow rate, and reducing flow-switching time.
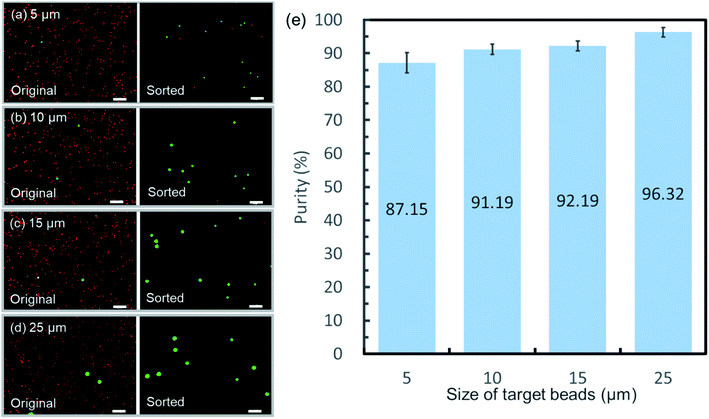
Another attractive characteristic of the as-demonstrated sorting mechanism is its high versatility in target material properties. Unlike other microfluidic sorting approaches, the flow switching sorting mechanism only allows one downstream microchannel to be open at the same time, guaranteeing a reliable control of flow direction. Hence, regardless of differences in physical properties, as long as the presence of the target could be accurately detected, reliable sorting actuation would be performed. Fig. 9(a)–(d) shows the fluorescent images of the original sample and sorted sample for solutions spiked with target beads of varied sizes (purity of 0.67% ± 0.05% for 5 μm-diameter beads; purity of 0.49% ± 0.08% for 10 μm-diameter beads; purity of 0.57% ± 0.03% for 15 μm-diameter beads; purity of 0.58% ± 0.09% for 25 μm-diameter beads). Significant enrichment was confirmed for all the samples by statistics in Fig. 9(e). This property shows the potential for recovery of precious rare cells without size bias53,54 and stable sorting of large-volume biological compartments,55 such as droplets as described in Section 4.2. Although not obvious, the purity is observed to decrease slightly as the target particle diameter decreases. The intensity reduction of signals from small target beads leads to a decrease in the signal-to-noise ratio, which would further reduce the detection resolution. Therefore, a small amount of false sorting actions caused by noise may be responsible for the decrease in purity.
To further demonstrate the sorting performance, fluorescently labeled MCF-7 breast cancer cells were spiked in Jurkat cells in RPMI medium, as shown in Fig. 10(a). The cell mixture was input as the sample for cell sorting experiments. The sorting conditions remained the same as the microparticle sorting experiments. Fig. 10(b) and (c) show fluorescent images of the original cell mixture and sorted sample. Significant enrichment of MCF-7 cells was observed. Typical FCM scatters before and after sorting of the cell mixture are given in Fig. 11(a) and (b). Most of the Jurkat cells are confirmed to be removed after sorting. Statistical results from three repeated experiments show that purity was improved from 0.61% (±0.01%) to 91.01% (±3.91%), indicating an enrichment of ∼150-fold. Meanwhile, no big difference in sorting performance was found when the target was switched from microparticles to cells. This indicates that the constructed μ-FACS system shows a high versatility on materials properties of targets. The viability of MCF-7 cells from the collection outlet was observed to be 89.4 ± 1.3%, the same as that of the inlet sample before sorting (89.7 ± 0.3%), indicating low cell damage during sorting.
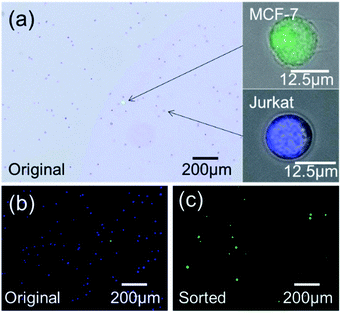 | ||
| Fig. 10 (a) Photo of a mixture of MCF-7 and Jurkat cells. (b) Fluorescent images of original cell mixture. (c) Fluorescent images of sorted sample. | ||
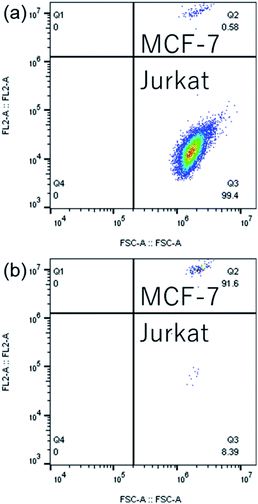 | ||
| Fig. 11 Typical FCM scatters of (a) original cell mixture and (b) sorted sample for a sorting throughput of ∼200 eps. | ||
It is worth mentioning that although signals from only one optical channel were used in this work, optical channels and filters could be easily expanded to collect signals from multiple channels. The sensitivity of the on-chip sorting system could also be improved by replacing the MPPC modules with photomultiplier (PMT) modules. Compared to many other μ-FACS systems, our flow switching based μ-FACS device takes advantage of a new fast valving mechanism, which is simple in structure, reliable in flow control, and cost-effective in fabrication and implementation (more than 1![[thin space (1/6-em)]](https://www.rsc.org/images/entities/char_2009.gif) 000
000![[thin space (1/6-em)]](https://www.rsc.org/images/entities/char_2009.gif) 000 times valving have been successfully performed so far, using single setup). Overcoming problems of many other microvalves,51 in addition to cell sorting, the proposed rapid valving principle could further expand its application to many other areas.
000 times valving have been successfully performed so far, using single setup). Overcoming problems of many other microvalves,51 in addition to cell sorting, the proposed rapid valving principle could further expand its application to many other areas.
5 Conclusions
In conclusion, the amplified displacements of piezoelectric actuators have been utilized to control flow resistances of channels in a bifurcately configurated microfluidic chip. The as-induced rapid and stable flow switching has been further applied to build a μ-FACS system. Rare microparticles at a frequency of ∼0.5% have been significantly enriched to more than 90%. Fluorescently labeled MCF-7 breast cancer cells in Jurkat cells were also enriched by 150-fold from 0.6% to ∼91%, while viability after sorting was maintained.As sample flow in the microchannel is switched by complete regulation of downstream flow resistances, the proposed sorting mechanism is believed to be both fast and robust. As long as sample signals could be accurately detected, reliable sorting could be conducted successfully without complicated optimization for sorting particles of different physical properties. Furthermore, it is easy to imagine that by expanding downstream microfluidic channels and setting up corresponding piezoelectrically actuated on-chip microvalves, a robust and highly flexible multiplex sorting platform could be realized, enabling the isolation of mixed objects with varied material properties into multiple separated outlets.
Conflicts of interest
There are no conflicts to declare.References
- C. Wyatt Shields Iv, C. D. Reyes and G. P. López, Lab Chip, 2015, 15, 1230–1249 RSC.
- A. J. Armstrong, M. S. Marengo, S. Oltean, G. Kemeny, R. L. Bitting, J. D. Turnbull, C. I. Herold, P. K. Marcom, D. J. George and M. A. Garcia-Blanco, Mol. Cancer Res., 2011, 9, 997–1007 CrossRef CAS.
- Y. Chen, P. Li, P.-H. Huang, Y. Xie, J. D. Mai, L. Wang, N.-T. Nguyen and T. J. Huang, Lab Chip, 2014, 14, 626–645 RSC.
- T. Weber, B. Wefers, W. Wurst, S. Sander, K. Rajewsky and R. Kühn, Nat. Biotechnol., 2015, 33, 543–548 CrossRef.
- M. J. Tomlinson, S. Tomlinson, X. B. Yang and J. Kirkham, J. Tissue Eng., 2013, 4, 2041731412472690 Search PubMed.
- A. W. Wognum, A. C. Eaves and T. E. Thomas, Arch. Med. Res., 2003, 34, 461–475 CrossRef CAS.
- S. Eminli, A. Foudi, M. Stadtfeld, N. Maherali, T. Ahfeldt, G. Mostoslavsky, H. Hock and K. Hochedlinger, Nat. Genet., 2009, 41, 968 CrossRef CAS.
- L. Chin, J. N. Andersen and P. A. Futreal, Nature Medicine, 2011, 17, 297–303 CrossRef CAS.
- Z. Ma, Y. Zhou, D. J. Collins and Y. Ai, Lab Chip, 2017, 17, 3176–3185 RSC.
- J. Guo, X. Huang and Y. Ai, Anal. Chem., 2015, 87, 6516–6519 CrossRef CAS.
- R. Gomez-Sjoeberg, A. A. Leyrat, D. M. Pirone, C. S. Chen and S. R. Quake, Anal. Chem., 2007, 79, 8557–8563 CrossRef CAS.
- V. Lecault, M. VanInsberghe, S. Sekulovic, D. J. H. F. Knapp, S. Wohrer, W. Bowden, F. Viel, T. McLaughlin, A. Jarandehei and M. Miller, Nat. Methods, 2011, 8, 581 CrossRef CAS.
- H. Van Phan, M. B. Coşkun, M. Şeşen, G. Pandraud, A. Neild and T. Alan, Lab Chip, 2015, 15, 4206–4216 RSC.
- D. P. Kise, D. Magana, M. J. Reddish and R. B. Dyer, Lab Chip, 2014, 14, 584–591 RSC.
- S. Ma, D. N. Loufakis, Z. Cao, Y. Chang, L. E. K. Achenie and C. Lu, Lab Chip, 2014, 14, 2905–2909 RSC.
- R. Zhang, X. Li, G. Ramaswami, K. S. Smith, G. Turecki, S. B. Montgomery and J. B. Li, Nat. Methods, 2014, 11, 51 CrossRef CAS.
- J. El-Ali, P. K. Sorger and K. F. Jensen, Nature, 2006, 442, 403–411 CrossRef CAS.
- D. R. Link, E. Grasland-Mongrain, A. Duri, F. Sarrazin, Z. Cheng, G. Cristobal, M. Marquez and D. A. Weitz, Angew. Chem., Int. Ed., 2006, 45, 2556–2560 CrossRef CAS.
- T. Beneyton, F. Coldren, J. C. Baret, A. D. Griffiths and V. Taly, Analyst, 2014, 139, 3314–3323 RSC.
- L. Mazutis, J. Gilbert, W. L. Ung, D. A. Weitz, A. D. Griffiths and J. A. Heyman, Nat. Protoc., 2013, 8, 870 CrossRef CAS.
- R. Pethig, Biomicrofluidics, 2010, 4, 1–35 Search PubMed.
- L. Chen and R. B. Fair, Microfluid. Nanofluid., 2015, 19, 1349–1361 CrossRef CAS.
- M. Kühnemund, D. Witters, M. Nilsson and J. Lammertyn, Lab Chip, 2014, 14, 2983–2992 RSC.
- B. Watson, J. Friend and L. Yeo, Sens. Actuators, A, 2009, 152, 219–233 CrossRef CAS.
- S. Li, X. Ding, F. Guo, Y. Chen, M. I. Lapsley, S.-C. S. Lin, L. Wang, J. P. McCoy, C. E. Cameron and T. J. Huang, Anal. Chem., 2013, 85, 5468–5474 CrossRef CAS.
- P. Li, Z. Ma, Y. Zhou, D. J. Collins, Z. Wang and Y. Ai, Anal. Chem., 2019, 91, 9970–9977 CrossRef CAS.
- Y. Zhou, Z. Ma and Y. Ai, RSC Adv., 2019, 9, 31186–31195 RSC.
- P. Li, M. Liang, X. Lu, J. J. M. Chow, C. J. A. Ramachandra and Y. Ai, Anal. Chem., 2019, 91, 15425–15435 CrossRef CAS.
- L. Schmid, D. A. Weitz and T. Franke, Lab Chip, 2014, 14, 3710–3718 RSC.
- J. Zhang, J. H. Hartman, C. Chen, S. Yang, Q. Li, Z. Tian, P. H. Huang, L. Wang, J. N. Meyer and T. J. Huang, Lab Chip, 2020, 20, 1729–1739 RSC.
- T. Franke, S. Braunmüller, L. Schmid, A. Wixforth and D. A. Weitz, Lab Chip, 2010, 10, 789–794 RSC.
- K. Mutafopulos, P. Spink, C. D. Lofstrom, P. J. Lu, H. Lu, J. C. Sharpe, T. Franke and D. A. Weitz, Lab Chip, 2019, 19, 2435–2443 RSC.
- Z. Ma, D. J. Collins, J. Guo and Y. Ai, Anal. Chem., 2016, 88, 11844–11851 CrossRef CAS.
- M. Sivaramakrishnan, R. Kothandan, D. K. Govindarajan, Y. Meganathan and K. Kandaswamy, Curr. Opin. Biomed. Eng., 2020, 13, 60–68 CrossRef.
- L. Wu, P. Chen, Y. Dong, X. Feng and B.-F. Liu, Biomed. Microdevices, 2013, 15, 553–560 CrossRef CAS.
- Z. Cao, F. Chen, N. Bao, H. He, P. Xu, S. Jana, S. Jung, H. Lian and C. Lu, Lab Chip, 2013, 13, 171–178 RSC.
- C. H. Chen, S. H. Cho, F. Tsai, A. Erten and Y. H. Lo, Biomed. Microdevices, 2009, 11, 1223–1231 CrossRef CAS.
- Z. Cheng, X. Wu, J. Cheng and P. Liu, Microfluid. Nanofluid., 2017, 21, 9 CrossRef.
- S. Sakuma, Y. Kasai, T. Hayakawa and F. Arai, Lab Chip, 2017, 17, 2760–2767 RSC.
- Y. Zhao, A. S. Abdelfattah, Y. Zhao, A. Ruangkittisakul, K. Ballanyi, R. E. Campbell and D. J. Harrison, Integr. Biol., 2014, 6, 714–725 CrossRef CAS.
- Z. Jiao, X. Huang, N. T. Nguyen and P. Abgrall, Microfluid. Nanofluidics, 2008, 5, 205–214 CrossRef CAS.
- Y.-F. Yap, S.-H. Tan, N.-T. Nguyen, S. M. S. Murshed, T.-N. Wong and L. Yobas, J. Phys. D: Appl. Phys., 2009, 42, 65503 CrossRef.
- M. Robert de Saint Vincent, R. Wunenburger and J.-P. Delville, Appl. Phys. Lett., 2008, 92, 154105 CrossRef.
- H. D. Xi, H. Zheng, W. Guo, A. M. Gañán-Calvo, Y. Ai, C. W. Tsao, J. Zhou, W. Li, Y. Huang, N. T. Nguyen and S. H. Tan, Lab Chip, 2017, 17, 751–771 RSC.
- A. Y. Fu, H. P. Chou, C. Spence, F. H. Arnold and S. R. Quake, Anal. Chem., 2002, 74, 2451–2457 CrossRef CAS.
- H. Q. Li, D. C. Roberts, J. L. Steyn, K. T. Turner, O. Yaglioglu, N. W. Hagood, S. M. Spearing and M. A. Schmidt, Sens. Actuators, A, 2004, 111, 51–56 CrossRef CAS.
- I. Fazal and M. C. Elwenspoek, J. Micromech. Microeng., 2007, 17, 2366–2379 CrossRef.
- J. M. Park, R. P. Taylor, A. T. Evans, T. R. Brosten, G. F. Nellis, S. A. Klein, J. R. Feller, L. Salerno and Y. B. Gianchandani, J. Micromech. Microeng., 2007, 18, 15023 CrossRef.
- D. Zhang, J. Lv, Y. Jiang, H. Chen and J. Fu, Mechatronics, 2014, 24, 511–518 CrossRef.
- S. Chen, S. Lu, Y. Liu, J. Wang, X. Tian, G. Liu and Z. Yang, AIP Adv., 2016, 6, 45112 CrossRef.
- J. Y. Qian, C. W. Hou, X. J. Li and Z. J. Jin, Actuation mechanism of microvalves: A review, 2020, vol. 11, pp. 172 Search PubMed.
- N. Nitta, T. Sugimura, A. Isozaki, H. Mikami, K. Hiraki, S. Sakuma, T. Iino, F. Arai, T. Endo, Y. Fujiwaki, H. Fukuzawa, M. Hase, T. Hayakawa, K. Hiramatsu, Y. Hoshino, M. Inaba, T. Ito, H. Karakawa, Y. Kasai, K. Koizumi, S. W. Lee, C. Lei, M. Li, T. Maeno, S. Matsusaka, D. Murakami, A. Nakagawa, Y. Oguchi, M. Oikawa, T. Ota, K. Shiba, H. Shintaku, Y. Shirasaki, K. Suga, Y. Suzuki, N. Suzuki, Y. Tanaka, H. Tezuka, C. Toyokawa, Y. Yalikun, M. Yamada, M. Yamagishi, T. Yamano, A. Yasumoto, Y. Yatomi, M. Yazawa, D. Di Carlo, Y. Hosokawa, S. Uemura, Y. Ozeki and K. Goda, Cell, 2018, 175, 266–276.e13 CrossRef CAS.
- W. Zhao, Y. Liu, B. D. Jenkins, R. Cheng, B. N. Harris, W. Zhang, J. Xie, J. R. Murrow, J. Hodgson, M. Egan, A. Bankey, P. G. Nikolinakos, H. Y. Ali, K. Meichner, L. A. Newman, M. B. Davis and L. Mao, Lab Chip, 2019, 19, 1860–1876 RSC.
- K. Alix-Panabières and C. Pantel, Nat. Rev. Cancer, 2014, 14, 623–631 CrossRef.
- A. Isozaki, Y. Nakagawa, M. H. Loo, Y. Shibata, N. Tanaka, D. L. Setyaningrum, J.-W. Park, Y. Shirasaki, H. Mikami, D. Huang, H. Tsoi, C. T. Riche, T. Ota, H. Miwa, Y. Kanda, T. Ito, K. Yamada, O. Iwata, K. Suzuki, S. Ohnuki, Y. Ohya, Y. Kato, T. Hasunuma, S. Matsusaka, M. Yamagishi, M. Yazawa, S. Uemura, K. Nagasawa, H. Watarai, D. Di Carlo and K. Goda, Sci. Adv., 2020, 6, eaba6712 CrossRef CAS.
Footnote |
| † Electronic supplementary information (ESI) available. See DOI: 10.1039/d0ra04919k |
| This journal is © The Royal Society of Chemistry 2020 |

