 Open Access Article
Nanocellulose–organic montmorillonite nanocomposite adsorbent for diuron removal from aqueous solution: optimization using response surface methodology†
Chengxiao Maa,
Lijuan Yi*b,
Jie Yanga,
Junhong Tao a and
Junfeng Li
 *a
*a
aCollege of Water Conservancy and Architecture Engineering, Shihezi University, Shihezi 832000, Xinjiang, PR China. E-mail: ljfshz@126.com
bKey Laboratory for Green Process of Chemical Engineering of Xinjiang Bingtuan, School of Chemistry and Chemical Engineering, Shihezi University, Shihezi 832000, Xinjiang, P. R. China
First published on 19th August 2020
Abstract
Herbicides have been ubiquitous in water environments in recent years, and so it is an appealing proposition to develop an efficient adsorbent for the adsorption of diuron. Therefore, the present study investigated a cellulose nanocrystal/organic montmorillonite nanocomposite adsorbent (CNC/CTM) and its adsorption properties towards diuron present in water. The structure and characteristics of the adsorbent used in this study were characterized by various characterization methods. The optimal diuron adsorption conditions for the CNC/CTM nanocomposite were analyzed based on the response surface methodology (RSM). The adsorption isotherms and kinetics of diuron adsorption were investigated. The results indicated that the adsorption process is the result of hydrogen bonding and the hydrophobicity of the alkyl chain. Under the optimal adsorption conditions, 0.07 g L−1 CNC/CTM adsorbed 5.86 mg L−1 diuron in less than 318.68 min and an efficiency of 82.32% could be achieved. The simulation results showed that the adsorption capacity of CNC/CTM for diuron removal followed the Sips model most closely. The maximum adsorption capacity was approximately 69.04 mg g−1 at 288 K. The experimental data was described best by a pseudo-second-order kinetic equation, signifying a chemical adsorption process. The adsorbent can be reused at least five times after simple solvent washing. This study provides a theoretical basis for understanding the adsorption process of diuron present in water.
Introduction
The issue of water environment pollution has raised significant concerns.1–3 Among the numerous wastewater pollutants, pesticides are common organic compounds.4–6 Organic pesticides, such as herbicides, insecticides, and germination inhibitors, are extensively used in modern agriculture to increase crop yields.7 In recent decades, herbicides have been increasingly employed, causing surface water and groundwater pollution. Among the several herbicides that lead to water pollution, diuron [3-(3,4-dichlorophenyl)-1,1-dimethylurea] (DUR) is a synthetic phenylurea herbicide, which is widely utilized in agriculture.8 DUR is soluble in water, with a solubility of 42 mg L−1 at 25 °C; it has strong persistence and has a half-life of approximately 300 days.9,10 Therefore, DUR is considered as a major pollutant in the environment,11 it is a highly toxic substance,11,12 and it is listed as a carcinogen by the International Cancer Research Agency and the US Environmental Protection Agency.13,14 DUR easily enters surface water and groundwater through runoff; therefore, it is frequently detected in water in numerous countries.15 The US Environmental Protection Agency has set the permissible level of DUR in drinking water as 0.10 g L−1.16 DUR is toxic and soluble. Therefore, it is necessary to remove it from water.The methods used to remove DUR from water include photocatalytic oxidation and photodegradation,17,18 ozone oxidation,7 electrochemical oxidation,19 biodegradation,20–22 and adsorption.23 However, these methods have certain limitations. For example, the cost of ozone oxidation is relatively high. In practical applications, the ozone oxidation method must be combined with other treatment technologies to improve its oxidation performance. In addition, although electrochemical oxidation exhibits a notable treatment effect and rapid reaction, it requires specific electrolytes, which increases the treatment cost.24 In comparison, the adsorption method has the advantages of simplicity, high efficiency, flexibility, and low cost, and it is currently the most feasible and the most environmentally friendly method. To date, activated carbon,25 ionic liquids,26 magnesite,27 and zeolite Y28 have been used to remove DUR from water. Although adsorbents have been extensively used in the remediation of herbicide pollutants, they still have numerous deficiencies in terms of the cost, adsorption capacity, and preparation conditions.29,30 Therefore, it is necessary to develop an adsorbent with high specific surface area, low cost, simple preparation conditions, and high adsorption capacity for removing DUR, which is important and extremely challenging. Cellulose is the most abundant biopolymer on Earth, and it can be obtained by hydrolysis with sulfuric acid. Cellulose nanocrystals (CNCs) have the advantages of low cost, renewability, high crystallinity, high aspect ratio, and biodegradability.31 However, CNCs have numerous hydroxyl groups on their crystalline surface. If the surface functional groups are not modified, they will easily agglomerate in water, which significantly limits the application potential of CNCs in water. Studies have exhibited that adding clay to the cellulose matrix can change its chemical properties to improve its adsorption capacity.32
Montmorillonite (NM) has a high cation exchange capacity and high specific surface area, and it has been extensively used to remove dyes and heavy metals from water.11,33 At present, although there are studies on combining CNCs and NM to remove dyes and heavy metals,34 there is no research on forming such composites to eliminate herbicides. Therefore, in this study, organic montmorillonite (CTM) was obtained by modifying montmorillonite with cetyltrimethylammonium bromide (CTAB), and it was subsequently combined with sulfuric acid-hydrolyzed CNCs. This led to the synthesis of an adsorbent, a high-adsorption-capacity CNC/CTM composite material, which was used to adsorb DUR from water.
Another feature of the present study is the employment of the response surface method (RSM) to optimize the design of the experiments. The RSM includes experimental design, modeling, testing the suitability of the model, and seeking the best combination conditions. By regression fitting the process and drawing the response surfaces and contours, the corresponding response value of each factor level can be found. Based on the response values of each factor level, the optimal predicted response value and the corresponding experimental conditions can be found.35 Until now, few studies have applied the RSM to the adsorption of DUR, therefore, this study utilized the RSM to model the experimental data to determine the optimal adsorption parameters of DUR.
Therefore, the main objectives of this study were: (1) preparation of a CNC/CTM composite adsorbent for the removal of DUR; (2) determination of the optimal DUR adsorption parameters; (3) to investigate the reasons for the high adsorption capacity for DUR; and (4) to determine the isothermal adsorption model and the adsorption kinetics model and clarify the process of adsorption of DUR by a adsorbent. This provides the scientific basis for the application of CNCs and montmorillonite for the treatment of DUR in wastewater.
Materials and methods
Chemical reagents
CNCs were provided by Guilin Qihong Technology Co., Ltd (China), and montmorillonite, CTAB (analytical grade), NaOH (99%), AgNO3, and DUR were purchased from Shanghai Macklin Biochemical Co., Ltd (China). The water used in this study was deionized water.Preparation of adsorbent
CTAB (16.65 g) was weighed and dissolved in 500 mL water and then stirred with a magnetic stirrer until it was completely dissolved. After adding 30.49 g NM (the NM was divided into three parts, and each part was added and stirred for 10 min), the solution was magnetically stirred at 25 °C. The rotor was removed after 12 h, and subsequently, centrifugation was performed at 6000 rpm for 5 min. The precipitate was repeatedly washed with deionized water, and the process was repeated multiple times until a precipitate was detected with 0.1 mol L−1 AgNO3 solution. Subsequently, it was dried at 105 °C, ground, and passed through a 200-mesh sieve to obtain CTM.CNCs (1 g) were added to 30 mL 10% NaOH solution, and then the mixture was magnetically stirred to form a suspension at 25 °C. Next, 1 g CTM was added to 30 mL distilled water (the distilled water was added during magnetic stirring), and the solution was stirred for 30 min followed by sonication at 50 Hz for 60 min to form a CTM suspension. Next, the two solutions were mixed and reacted at 50 °C for 6 h. The product was washed until a neutral pH was obtained, dried at 105 °C, ground, and passed through a 200-mesh sieve to obtain the CNC/CTM nanocomposite.
Characterization of adsorbent
The morphology and microstructure of the adsorbent were observed via scanning electron microscopy (SEM) (Shimadzu Quanta 650FEG, USA). The lattice morphology of CNC/CTM was observed by TEM (JEM-2100F, Japan), with an acceleration voltage of 200 kV and an enlargement factor of 50 nm to 100 nm. Energy-dispersive X-ray spectroscopy (EDS) analysis yielded the element distribution on the surface of the adsorbent. Fourier-transform infrared (FT-IR) spectroscopy (Thermo Fisher, Nicolet 6700, USA) was used to analyze the infrared spectrum of the adsorbent, and 32 scans were performed. The samples were freeze dried before preparing KBr films with spectral widths of 400–4000 cm−1 and a resolution of 4 cm−1. The specific surface areas (BET) and structures of the samples were analyzed using a specific surface and porosity analyzer (ASAP 2020, USA). An X-ray photoelectron spectrometer (XPS) (Thermo Scientific Escalab 250Xi, USA) with Al-Kα radiation (hν = 1486.6 eV) was used to determine the binding energy of each chemical bond in the adsorbent.Adsorption of diuron
Approximately 50 mL DUR solution of a particular concentration was taken in an Erlenmeyer flask, a certain amount of adsorbent was added, and the solution was adjusted to a specific pH with H2SO4 and NaOH. It was then placed in a constant-temperature shaker (160 rpm) for adsorption. By changing the experimental conditions and the parameters, including the initial solution concentration, pH, dosage of the adsorbent, temperature, and time, the effects of the adsorbent on DUR adsorption were examined under various conditions. After the reaction, an appropriate amount of sample was taken, and it was centrifuged at a speed of 10![[thin space (1/6-em)]](https://www.rsc.org/images/entities/char_2009.gif) 000 rpm. Then the supernatant was taken, and the absorbance of the solution at 254 nm was measured via High-Performance Liquid Chromatography (HPLC, LC1620A, China). The formula for the adsorption amount of DUR on the adsorbent is as follows (eqn (1) and (2)).36
000 rpm. Then the supernatant was taken, and the absorbance of the solution at 254 nm was measured via High-Performance Liquid Chromatography (HPLC, LC1620A, China). The formula for the adsorption amount of DUR on the adsorbent is as follows (eqn (1) and (2)).36
 | (1) |
 | (2) |
RSM design and statistical analysis
This study adopts a typical RSM method, Box–Behnken Design (BBD), to design the experiments, and the CNC/CTM dosage amount, reaction time, and pollutant concentration are selected as the investigated factors. They are denoted by X1, X2, and X3, respectively. In summary, three factors and three levels of experiments are designed. The three independent variables (X1 is the CNC/CTM dosage, X2 is the reaction time, and X3 is the initial pollutant concentration) and three different coding levels (−1, 0, 1) are listed in Table S1.†Results and discussion
Characterization of adsorbents
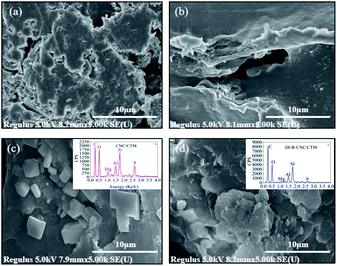
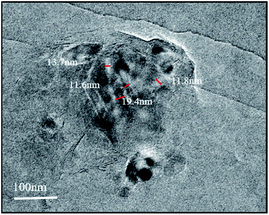
The SEM images of the CTM, CNC, CNC/CTM, and DUR-CNC/CTM systems are displayed in Fig. 1. The NM surface is an agglomerated and compact flat surface (Fig. S1†). The surface of CTM is rough and has numerous microporous structures. This is because quaternary ammonium cations are inserted between the NM layers.37 The structure of the CNC/CTM nanocomposite is different from those of the CTM and CNCs. The block structures on the CNC/CTM surface indicate that the CTM and CNCs are bonded. The irregular aggregation between the block structures and the lamellae produces slit holes, indicating the occurrence of chemical reactions, such as ion exchange, between the CTM and the CNCs. The SEM image of the DUR-CNC/CTM nanocomposite presents a massive structure and shows that the slit pores on the CNC/CTM surface are wrapped or filled with closely arranged molecules. This indicates that DUR is adsorbed by the adsorbent, CNC/CTM, which is consistent with the FT-IR characterization results. Energy-dispersive X-ray spectroscopy (EDS) analysis yields the element distribution on the surface of the adsorbent (Fig. 1). By comparing the contents of C and O in CNC/CTM and DUR-CNC/CTM, it was concluded that CNC/CTM adsorbed diuron due to the increase in C and O content after adsorption.The lattice morphology of CNC/CTM is observed by TEM, and the results are shown in Fig. 2. The white parts are CNCs, and the black regions are CTM. As a result of the intercalation of CNCs, the crystal structure of CTM is destroyed, and the interaction force between the lamellar structures is weakened. It can be concluded from the TEM micrographs that there are both intercalated and exfoliated structures in the CNC/CTM nanocomposite.38,39 The thickness of the CNC intercalation layer is 13.7 nm or 11.8 nm, and the thickness of the CTM sheet layer is 19.4 nm or 11.6 nm. At the nano-scale, this indicates that an intercalation–exfoliation type nanocomposite is formed between CNCs and CTM through ion exchange, which is consistent with the FT-IR characterization results.
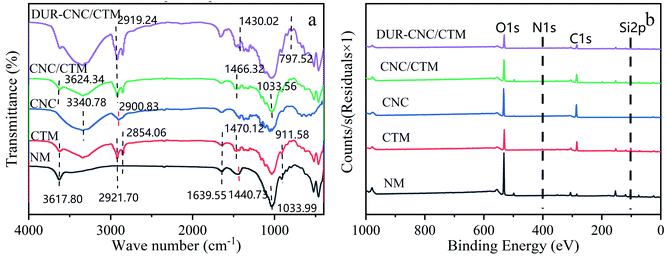
The FT-IR spectra of the NM, CTM, CNC, CNC/CTM, and DUR-CNC/CTM systems are displayed in Fig. 3a. It can be seen from the figure that the Si–O–Si anti-symmetric stretching vibration absorption peak and the Al–OH stretching vibration absorption peak of NM at 1033.99 cm−1 and 911.58 cm−1, respectively, appear for CTM. The –CH3 anti-symmetric deformation vibration and the –CH2 deformation vibration absorption peak, which appears at 1440.73 cm−1 for NM, is shifted to a higher wavenumber, 1470.12 cm−1, for CTM, which suggests that quaternary ammonium salt cations enter the CTM wafer layer.34 Simultaneously, for CTM, the –CH3 symmetric vibration peak and the –CH2 anti-symmetric stretching vibration peak at 2921.70 cm−1 and 2854.06 cm−1, respectively, are the absorption peaks of the quaternary ammonium organic groups. This indicates that the quaternary ammonium salt enters the interlayer structure of the CTM.40 H–O–H bending and stretching vibration peaks appear near 1639.55 cm−1 and 3617.80 cm−1, respectively, which suggests that water is adsorbed between the montmorillonite and CTM wafer layers and that there is water in the crystal lattice.
The CNCs present a strong –OH stretching vibration peak at 3340.78 cm−1 and –CH bending vibration peaks at 2900.83 cm−1 and 1428.98 cm−1. Simultaneously, C–O–C vibration peaks appear at 1164.51 cm−1 and 1058.36 cm−1. In the CNC/CTM nanocomposite, the –CH bending vibration peak at 2900.83 cm−1 and the C–O–C vibration peak at 1058.36 cm−1 disappear, whereas the characteristic anti-symmetric –CH3 absorption peak of CTM at −2921.70 cm−1 weakens and moves in the lower wavenumber direction (2919.24 cm−1). In addition, the Si–O stretching vibration absorption peak of CTM at 1033.31 cm−1 shifts in the higher wavenumber direction (1033.56 cm−1) in the composite. The –OH stretching vibration absorption peak and the –CH3 anti-symmetric deformation vibration and –CH2 deformation vibration absorption peak of CTM at 3626.75 cm−1 and 1470.12 cm−1, respectively, move in the smaller wavenumber direction (3624.34 cm−1 and 1466.32 cm−1). It can be seen that the composite materials contain both the CTM skeleton structure and CNCs macromolecules. The C–O–C, –OH, and other groups of the CNCs probably coordinate with the –CH2, Si–O, and –CH3 bonds in the CTM structure via ion exchange, forming the CNC/CTM nanocomposite adsorbent. The results indicate that CNC/CTM contains hydrophilic and hydrophobic functional groups. Furthermore, the structure of diuron consists of hydrophobic benzene rings and hydrophilic functional groups. Therefore, the compatibility between CNC/CTM and DUR may result in strong adsorption.
The characteristic peaks of the CNC/CTM nanocomposite are found in the DUR-CNC/CTM nanocomposite spectrum. The DUR-CNC/CTM system presents new peaks at 797.52 cm−1 and 1430.02 cm−1, which are the benzene absorption peak and the N–H anti-symmetric vibration, respectively. Therefore, the peaks at 797.52 cm−1 and 1430.02 cm−1 correspond to the adsorption of DUR by the CNC/CTM nanocomposite. Above all, the possible reasons for the adsorption of DUR by CNC/CTM are as follows: (i) hydrogen bonding through –OH groups on the CNC/CTM nanocomposite surface and nitrogen atoms in the diuron structure; (ii) the hydrophobic interactions between DUR and the alkyl chains of the CNC/CTM nanocomposite.41
Fig. 3b presents the full XPS spectra of NM, CTM, CNCs, CNC/CTM, and DUR-CNC/CTM. As can be seen from the figure, C and O are the main elements. Fig. S2(a) and (f)† show that in NM, carbon exists in several forms, including C![[double bond, length as m-dash]](https://www.rsc.org/images/entities/char_e001.gif) O, C–C, O
O, C–C, O![[double bond, length as m-dash]](https://www.rsc.org/images/entities/char_e001.gif) C–O, and C–O–C, and their binding energies are 287.0 eV, 284.29 eV, 286.23 eV, and 284.91 eV, respectively.42 Oxygen in NM mainly exists in two forms, C–O–C and C
C–O, and C–O–C, and their binding energies are 287.0 eV, 284.29 eV, 286.23 eV, and 284.91 eV, respectively.42 Oxygen in NM mainly exists in two forms, C–O–C and C![[double bond, length as m-dash]](https://www.rsc.org/images/entities/char_e001.gif) O, and their binding energies are 530.99 eV and 532.28 eV, respectively. After NM is modified with CTAB, Fig. S2(b) and (g)† indicate that the C–C and C–O–H functional groups in CTM appear at 284.37 eV and 284.99 eV, respectively. The functional group appearing at 286.29 eV is C–N, which represents a quaternary ammonium ion. Oxygen in CTM appears at 531.09 eV and 531.77 eV, corresponding to C
O, and their binding energies are 530.99 eV and 532.28 eV, respectively. After NM is modified with CTAB, Fig. S2(b) and (g)† indicate that the C–C and C–O–H functional groups in CTM appear at 284.37 eV and 284.99 eV, respectively. The functional group appearing at 286.29 eV is C–N, which represents a quaternary ammonium ion. Oxygen in CTM appears at 531.09 eV and 531.77 eV, corresponding to C![[double bond, length as m-dash]](https://www.rsc.org/images/entities/char_e001.gif) O and C–O–C, respectively. Fig. S2(c) and (h)† show that the carbon in the CNCs appears at 287.72 eV, 286.33 eV, 284.90 eV and 284.48 eV. These peaks correspond to C
O and C–O–C, respectively. Fig. S2(c) and (h)† show that the carbon in the CNCs appears at 287.72 eV, 286.33 eV, 284.90 eV and 284.48 eV. These peaks correspond to C![[double bond, length as m-dash]](https://www.rsc.org/images/entities/char_e001.gif) O, O
O, O![[double bond, length as m-dash]](https://www.rsc.org/images/entities/char_e001.gif) C–O, C–O–C, and C–H, respectively. The oxygen peak of the CNCs appears at 532.68 eV and corresponds to C–O–H. As shown in Fig. S2(d) and (i),† the carbon peaks of the CNC/CTM nanocomposite at 287.86 eV, 284.69 eV, 286.45 eV, and 285.03 eV arise from C
C–O, C–O–C, and C–H, respectively. The oxygen peak of the CNCs appears at 532.68 eV and corresponds to C–O–H. As shown in Fig. S2(d) and (i),† the carbon peaks of the CNC/CTM nanocomposite at 287.86 eV, 284.69 eV, 286.45 eV, and 285.03 eV arise from C![[double bond, length as m-dash]](https://www.rsc.org/images/entities/char_e001.gif) O, C–H, C–N, and C–O–H, respectively. The oxygen peaks of CNC/CTM at 531.63 eV and 532.8 eV are due to C
O, C–H, C–N, and C–O–H, respectively. The oxygen peaks of CNC/CTM at 531.63 eV and 532.8 eV are due to C![[double bond, length as m-dash]](https://www.rsc.org/images/entities/char_e001.gif) O and C–O–H, respectively. Both the C–N groups of the CTM and the C–H groups of the CNCs exist in the CNC/CTM nanocomposite.43 The results show that the CNCs and the CTM are successfully combined. Fig. S2(e) and (j)† show that the carbon peaks of the DUR-CNC/CTM system at 287.87 eV, 284.59 eV, 286.42 eV, and 285.17 eV correspond to C
O and C–O–H, respectively. Both the C–N groups of the CTM and the C–H groups of the CNCs exist in the CNC/CTM nanocomposite.43 The results show that the CNCs and the CTM are successfully combined. Fig. S2(e) and (j)† show that the carbon peaks of the DUR-CNC/CTM system at 287.87 eV, 284.59 eV, 286.42 eV, and 285.17 eV correspond to C![[double bond, length as m-dash]](https://www.rsc.org/images/entities/char_e001.gif) O, C–H, C–O–C, and C–O–H. The binding energy of C–O–C/C–O–H increases slightly, which indicates that DUR is adsorbed by the CNC/CTM nanocomposite, which is consistent with the FT-IR characterization results.
O, C–H, C–O–C, and C–O–H. The binding energy of C–O–C/C–O–H increases slightly, which indicates that DUR is adsorbed by the CNC/CTM nanocomposite, which is consistent with the FT-IR characterization results.
The nitrogen (N2) adsorption/desorption isotherms of the CTM, CNC, CNC/CTM, and DUR-CNC/CTM samples are displayed in Fig. 4. According to the IUPAC classification, the raw materials and the composite samples present type IV isotherms,44 and they also exhibit mesoporous characteristics. This demonstrates that the mesoporous structures of the CTM and CNCs are not damaged during the composite formation process. In the P/P0 < 0.05 region, a single-molecule adsorption layer is formed on the surface of the CNC/CTM nanocomposite. In the 0.05 < P/P0 < 0.4 region, a multi-molecular adsorption layer starts to form on the CNC/CTM surface. In the P/P0 > 0.4 region, capillary condensation occurs in all the pores. When P/P0 approaches 1, the curve rises rapidly. During the desorption process, the capillary condensation of the mesopores causes the desorption rate of the sample to be higher than the adsorption rate, forming an H3-type hysteresis loop, indicating that slit hole accumulation occurs in the DUR-CNC/CTM sample. The H3 hysteresis loop for the DUR-CNC/CTM sample is significantly smaller than that for the CNC/CTM nanocomposite, which indicates that the CNC/CTM nanocomposite adsorbs DUR which causes the slit pores to be filled with closely aligned molecules, which is consistent with the SEM characterization results.
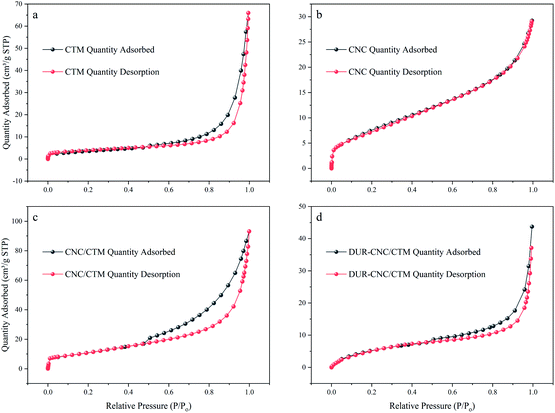 | ||
| Fig. 4 N2 adsorption/desorption isotherms of the (a) CTM, (b) CNC, (c) CNC/CTM, and (d) DUR-CNC/CTM samples. | ||
As shown in Table S2,† the specific surface area and pore structure parameters of the nanocomposite adsorption material can be determined. The specific surface area of the CNC/CTM nanocomposite was calculated by the Brunauer–Emmett–Teller (BET) formula, yielding 39.5160 m2 g−1. The average pore diameter was calculated by the Barrett–Joyner–Halenda (BJH) method as 12.39093 nm, the pore volume was 0.122410 cm3 g−1, and the pore width was 1.0305 nm. The specific surface area of the DUR-CNC/CTM sample was 22.5311 m2 g−1, the average pore diameter was 9.23431 nm, the pore volume was 0.052015 cm3 g−1, and the pore width was 1.3822 nm. The herbicide DUR was present between the intercalations in the DUR-CNC/CTM nanocomposite, resulting in a decrease in the specific surface area and an increase in the pore width. The above results show that the CNC/CTM nanocomposite can effectively adsorb DUR, which is consistent with the FT-IR and SEM characterization results.
Factors that affect adsorption of diuron by the adsorbent (CNC/CTM)
Fig. 5a shows the effect of the initial pollutant concentration on the CNC/CTM adsorption performance. The initial concentrations of the DUR solutions were 5, 10, 20, 30, and 40 mg L−1, and the other experimental parameters were not changed (adsorption time 630 min, pH 6.0, amount of adsorbent 0.05 g L−1, and temperature 288 K). It can be seen from the figure that after a reaction time of 630 min, when the initial concentrations of the pollutant are 5, 10, 20, 30, and 40 mg L−1, the corresponding removal rates are 76.64%, 70.59%, 69.06%, 65.93%, and 63.25%. As the concentration increases from 5 mg L−1 to 40 mg L−1, the removal rate of DUR for the CNC/CTM nanocomposite decreases from 76.64% to 63.25%. The adsorption performance indicates that the removal rate is dependent on the initial DUR concentration. The initial concentration supplies a driving force, which can overcome the mass transfer resistance of the DUR molecule between the liquid and solid phases.45 At low DUR concentrations, the ratio of CNC/CTM surface active sites to DUR molecules in solution may be high and hence all DUR molecules may be removed from the solution because there are sufficient active sites on the CNC/CTM.46 Fig. 5b shows the effect of the adsorbent dosage on the adsorption performance of the CNC/CTM nanocomposite. The adsorbent dosages are 0.025, 0.05, 0.075, and 0.1 g L−1, and the other experimental parameters are kept unchanged (adsorption time 630 min, pH 6.0, DUR concentration 5 mg L−1, and temperature 288 K). It can be seen from the figure that with the increase in dosage, the corresponding DUR removal rate increases. At 630 min, the diuron removal rates are 56.94%, 77.49%, 84.65%, and 89.57%. Simultaneously, when the dosages are 0.025 and 0.05 g L−1, the DUR concentration tends to maintain a balance after 110 min of reaction, and at the dosages of 0.075 and 0.1 g L−1, the DUR concentration tends to maintain a balance after 50 min of reaction. This signifies that the larger the amount of the CNC/CTM nanocomposite, the higher the DUR removal rate. When the dosage is increased from 0.025 to 0.075 g L−1, the DUR removal rate significantly increases from 56.94% to 84.65%. When the dosage is increased from 0.075 g L−1 to 0.1 g L−1, the removal rate of DUR insignificantly increases from 84.65% to 89.57%; therefore, 0.075 g L−1 is the optimal dosage. It can be seen that when the dosage of the adsorbent is low, the dosage is the main factor that affects the adsorption of DUR by the CNC/CTM nanocomposite. As the dosage increases, this effect gradually decreases. The reason is that as the dosage increases, the number of functional groups increases, which in turn attracts more DUR molecules.47 The DUR adsorption performance of CNC/CTM in the temperature range of 288 K–308 K is shown in Fig. 5c. The diuron removal rate of CNC/CTM decreased with increasing temperature and was faster during the first 150 minutes. As the temperature increased from 288 K to 308 K, the diuron removal rate of CNC/CTM decreased from 85.44% to 75.97%. The results show that low temperature is conducive to the adsorption of diuron on CNC/CTM. Fig. 5d displays the effect of pH on the adsorption performance of the CNC/CTM nanocomposite. It can be seen from the figure that the pH of the solution has no remarkable effect on the adsorption of DUR by the CNC/CTM nanocomposite, which is because of the strong buffering capacity of the CTM in the composite.48 At pH < 6, the removal rate of DUR for the CNC/CTM nanocomposite increases with an increase in the pH of the solution. Because DUR is positively charged under acidic conditions, a decrease in pH increases H+ generation which causes more intense competition for adsorption between H+ and DUR, causing the DUR adsorption to decrease.49 At pH > 8, the removal rate of DUR for the CNC/CTM nanocomposite tends to decrease as the pH of the solution increases, which may be because DUR, which is adsorbed on the adsorbent under alkaline conditions is re-dissolved. In summary, the pH of the solution has a slight effect on the adsorption of DUR by the CNC/CTM nanocomposite, and neutral solutions are beneficial for the adsorption process.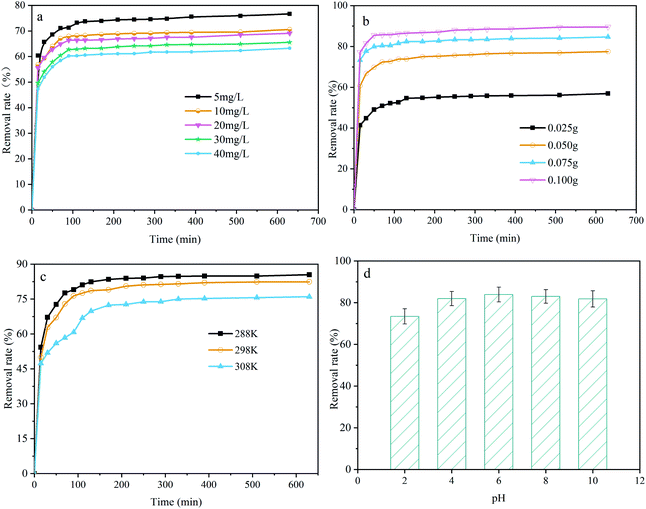 | ||
| Fig. 5 The effect of various factors on the diuron adsorption performance of the CNC/CTM nanocomposite: (a) the DUR concentration, (b) the CNC/CTM adsorbent dosage, (c) the temperature, (d) pH. | ||
Design and analysis of response surface experiments
Based on the above-mentioned single-factor experiments, in this study, the Box–Behnken design in the Design Expert 8.0.6 software was used to design the experiment. The DUR removal rate was the response variable, and the dosage of the CNC/CTM nanocomposite, the reaction time, and the concentration of the pollutant were the factors, which are denoted by X1, X2, and X3, respectively. A response surface experimental design with the above three factors and three levels was performed. The quadratic regression model equation for the encoding factor for the DUR removal rate (Y, %) is expressed in eqn (3). The experimental and predicted values of the combined design and the response of the response surface are summarized in Table S3.† The experimental and predicted values of the DUR removal rate in Table S3† are used for fitting curves, which are presented in Fig. S3.†The quadratic regression model is shown in eqn (3).
| Y = 68.23 − 4.77X1 + 14.42X2 + 1.48X3 + 0.99X1X2 − 0.22X1X3 − 0.048X2X3 + 0.73X12 − 6.42X22 + 0.33X32 | (3) |
Fig. S3† displays the fitted curves for the experimental and predicted diuron removal rates. As can be seen, the data for the experimental and predicted values are relatively densely distributed and exhibit a linear relationship. The fitted correlation coefficient R2 = 0.976, which shows that only 2.4% of the total change cannot be explained by the model. Regarding the removal of DUR, the adjusted R2 is 0.974, which is also large, indicating that the predicted values fit the actual values well. The model has a high accuracy, and there is good correlation between the actual and predicted values, which also shows that the RSM model and the experimental results are consistent.
In the model analysis in this study, an F-test for analysis of variance was conducted and the F value for each model was calculated. As the F value increases, the P value becomes smaller. If the P value is less than 0.05, the model is significant, indicating that it is suitable. As summarized in Table S4,† the F value of the experimental model is 31.18 and the P value is less than 0.0001, indicating that the model is significant.50 In general, if the model is logical, the calculated F value should be higher than the critical F value, as indicated in the table. In this study, the critical F value was calculated based on the equation F0.05, df, (n − df + 1). As can be seen from Table S4,† the first and second degrees of freedom of the critical F value are 9 and 7, respectively; therefore, this equation can be defined as F0.05, 9, 7, and the critical F value is 3.65, as observed from the table. Because F0.05, 9, 7 = 3.65 is lower than the calculated F value of 31.18, the model is significant. According to Table S4,† the R2 of the research model is 0.9757, between 0.90 and 1.00, indicating that 97.57% of the experimental data can be explained by the model. The Radj2 = 0.9444 is greater than 0.9, indicating that the model is significant.
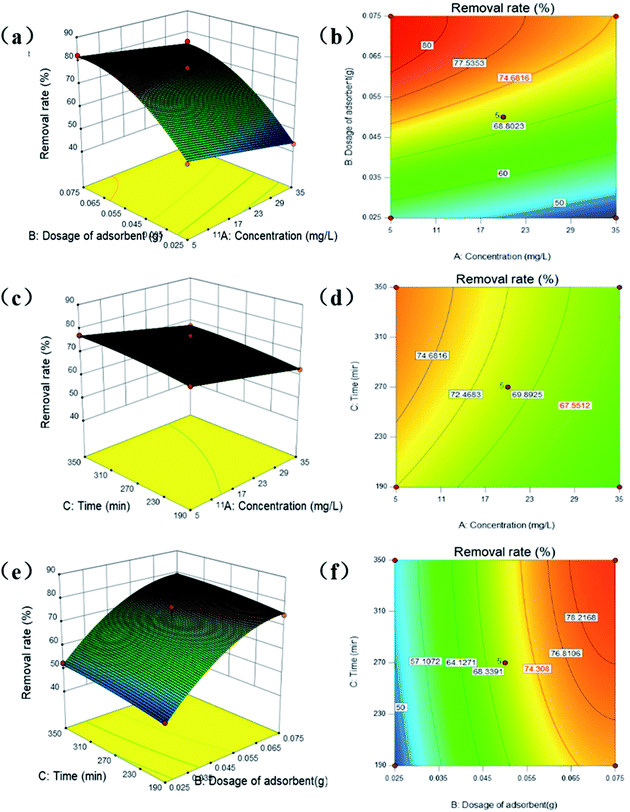
Fig. 6a and b show the interaction between the dosage of CNC/CTM and the DUR concentration for the same reaction time. As shown in Fig. 6a and b, the diuron removal rate of CNC/CTM increased from 43.51% to 82.26% on decreasing the DUR concentration from 35 mg L−1 to 5 mg L−1 and increasing the CNC/CTM dosage from 0.025 g to 0.075 g. When the DUR concentration is low, the CNC/CTM nanocomposite is in relative excess, and there are numerous reaction sites. However, when the concentration of DUR is high, the number of reaction sites is insufficient, and the removal of DUR is incomplete.45,51 In this process, the optimal adsorption point is observed when the removal rate of diuron is 77.04%. The code combination that produced the optimal adsorption point is (X1,X2,X3) = (−1,1,0). Fig. 6c and d show the interaction between time and the DUR concentration for the same CNC/CTM dosage. It can be seen that a similar trend occurs to that observed on increasing the DUR concentration. The adsorption occurs mainly in the initial stage, because the concentration of diuron is comparatively low at the beginning of the reaction, and the removal rate of DUR for CNC/CTM is relatively fast.52 The interaction between the dosage of CNC/CTM and time is shown in Fig. 6e and f. With increasing dosage of CNC/CTM and reaction time (with the other variables remaining unchanged), the DUR removal rate gradually increases. This is because after adding the CNC/CTM nanocomposite, DUR rapidly adsorbs on the surface of the material, allowing the concentration of DUR near the surface of the CNC/CTM nanocomposite to increase, subsequently causing the removal of the former by the latter.53,54 The entire process requires plenty of time, such that the longer the time, the better the diuron removal effect. In addition, when the amount of the CNC/CTM nanocomposite is increased, there are more active sites, so that all the DUR molecules have the opportunity to be adsorbed.
The removal rates of DUR in the 17 groups of experiments were calculated. The following optimal adsorption conditions were obtained using the Design Expert software: amount of adsorbent added (0.07 g) and initial concentration of the pollutant (5.86 mg L−1). When the reaction time is 318.68 min, the predicted removal rate of the optimized model is 82.32%. The model is experimentally verified using the optimized conditions. In three repeated experiments, the actual removal rate is 82.26% on average. The model was highly accurate and reliable for optimizing the conditions for the removal of DUR by CNC/CTM and the prediction of the removal rate. A reasonable combination of optimized conditions could result in the removal of high concentrations of diuron, thus saving time and experimental materials.
Adsorption isotherms
To further explore the effect of the initial concentration on the adsorption of DUR by the CNC/CTM nanocomposite and to determine the adsorption capacity and the mechanism of adsorption, adsorption isotherms were utilized in this study. The Langmuir and Freundlich adsorption isotherms, as two-parameter adsorption isotherms, are extensively used to describe the adsorption equilibria between liquid and solid phases. The Sips isotherm is a three-parameter isotherm model, which provides more information about an adsorption process than a two-parameter isotherm model. These isotherms are expressed in eqn (4)–(6), respectively.55
 | (4) |
| qe = KFCe1/n | (5) |
 | (6) |
Fig. S4† presents the Langmuir, Freundlich, and Sips adsorption isothermal models. The former two are the most commonly used adsorption isotherm models for DUR adsorption in aqueous solutions. Langmuir isotherms correspond to monolayer chemisorption.56 The Sips isotherm model is a combination of the Langmuir and Freundlich adsorption isotherm models. These three isotherms are concave, which demonstrates that the CNC/CTM nanocomposite adsorbent is beneficial for DUR removal.57 The isotherm curvature signifies that as the solute concentration increases, the active sites of the adsorbent are gradually filled with solute molecules, and it is difficult for the solute to find an effective adsorption site on the adsorbent. In the DUR adsorption isotherm, there is no complete plateau, i.e., there are still adsorption sites that are not filled with solute molecules during the adsorption process, which is consistent with the results reported in the literature.58
Non-linear curve regression analysis was conducted to calculate the isotherm constants. The results are summarized in Table 1. The R2 values indicate that within the concentration range studied, the adsorption of DUR by the CNC/CTM nanocomposite most suits the Sips isothermal model. The Sips isothermal model is a combination of the Langmuir and Freundlich adsorption isotherm models and has wider temperature and pressure ranges than them. Comparing the Langmuir, Freundlich, and Sips isotherm model fits to the adsorption of DUR by the CNC/CTM nanocomposite at different temperatures shows that the Qmax value of the Sips model is slightly higher than that of the Langmuir model. This is because at high concentrations, the Sips model exhibits the characteristics of a Langmuir isotherm with a saturated adsorption capacity. At low concentrations, it presents the characteristics of the Freundlich isotherm.59 The Sips isothermal adsorption model showed that the maximum adsorption capacity of diuron was 69.04 mg g−1. The R2 values of the three isotherm models are greater than 0.90, which indicates that they are applicable for explaining the adsorption mechanism.6 The results show that the b values were significantly below 1.0 at all three temperatures, which was conducive to DUR adsorption.60 Furthermore, all the 1/n values approached 0.7 L−1, which indicated a chemical process for DUR adsorption. This is in line with the above result. When 1/n = 1, the adsorption process corresponds to linear adsorption, for values <1, it corresponds to chemical adsorption, and values >1 correspond to physical adsorption.61 These data demonstrate the strong interaction between CNC/CTM and DUR, which shows the potential of CNC/CTM as an effective adsorbent for DUR removal.
| Isotherm model | Temperature | ||
|---|---|---|---|
| 288 K | 298 K | 308 K | |
| Langmuir | |||
| qmax (mg g−1) | 53.78 | 48.94 | 47.35 |
| b (L mg−1) | 0.071 | 0.077 | 0.079 |
| R2 | 0.997 | 0.996 | 0.994 |
| X2 | 0.13 | 0.14 | 0.19 |
![[thin space (1/6-em)]](https://www.rsc.org/images/entities/char_2009.gif) |
|||
| Freundlich | |||
| KF (mg g−1) | 4.058 | 4.04 | 3.99 |
| 1/n | 0.757 | 0.742 | 0.739 |
| R2 | 0.995 | 0.994 | 0.992 |
| X2 | 0.18 | 0.20 | 0.28 |
![[thin space (1/6-em)]](https://www.rsc.org/images/entities/char_2009.gif) |
|||
| Sips | |||
| QS (mg g−1) | 69.04 | 62.44 | 53.26 |
| KS (L mg−1) | 0.057 | 0.063 | 0.072 |
| 1/nS | 0.930 | 0.926 | 0.959 |
| R2 | 0.997 | 0.997 | 0.995 |
| X2 | 0.15 | 0.16 | 0.23 |
Table 2 compares the CNC/CTM nanocomposite with other adsorbents reported in the literature. It can be seen that the maximum adsorption capacity of the material used in this study is higher than that of the other adsorbents. Therefore, the CNC/CTM nanocomposite is a promising water treatment material.
Adsorption kinetics
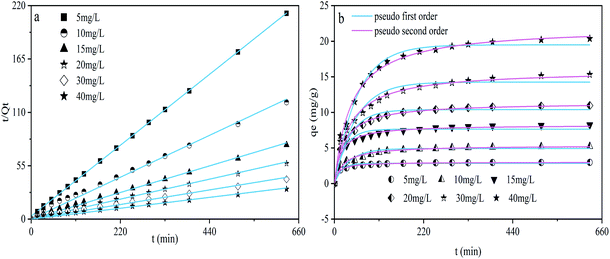
As the initial concentration of DUR was varied from 5 to 40 mg L−1, the effect of the contact time of the CNC/CTM nanocomposite and DUR on the adsorption was studied. The experimental results are presented in Fig. 7. The kinetic data were analyzed using pseudo-first-order and second-order equations. These equations are as follows (eqn (7) and (8)).9| qt = qe(1 − e−k1t) | (7) |
 | (8) |
The adsorption of organic pollutants from a liquid phase to a solid phase is a reversible process and, eventually, equilibrium is established between the two phases. In this study, an adsorption kinetic model was used to describe the adsorption rate of the herbicide, DUR, for the CNC/CTM nanocomposite, and pseudo-first-order and second-order kinetic equations were used to fit the experimental data. These two models are classic models for studying adsorption kinetics and have also been applied to numerous adsorption processes.64 The pseudo-first-order and pseudo-second-order kinetic models for DUR adsorbed on CNC/CTM are pictured in Fig. 7, and the related parameters are summarized in Table S5.† For each experimental concentration, the adsorption process was nearly completed during the first 110 minutes and remained comparatively steady after 250 minutes, which indicates that adsorption equilibrium was reached after about 250 minutes (Fig. 7b). In order to ensure the reaction was absolutely completed, 630 minutes was taken as the final sampling time in this experiment. The constant k for the adsorption kinetics can be used to determine the adsorption rate.65 As shown in Table S5,† the adsorption rate parameters were k1 and k2, which were inversely proportional to the initial concentration of DUR, indicating that the adsorption mainly occurred in the initial stage. This is because there were numerous adsorption sites when the concentration of DUR was low. The R2 value of the pseudo-second-order model (R2 = 0.997) was higher than that of the pseudo-first-order model (R2 = 0.961). Furthermore, the qe of the pseudo-second-order model was close to qe(exp), which was in line with previous studies.66,67 Above all, this illustrates that the pseudo-second-order model for the adsorption of DUR by CNC/CTM is more suitable than the pseudo-first-order model. The pseudo-second-order model describes chemical adsorption, which leads to electron separation or covalent interaction between the adsorbent and the adsorbate.68 Hence, the rate limiting step of diuron adsorption may be chemical adsorption through electron sharing or exchange between CNC and DUR.69
A schematic diagram of the preparation of the CNC/CTM nanocomposite and its interactions with DUR during adsorption is shown in Fig. 8. CTAB modification of NM resulted in alkyl chains being present in CTM, which was combined with CNC to obtain the CNC/CTM nanocomposite. This preparation process increased the surface area and porosity of CNC/CTM and introduced some functional groups that enhanced adsorption. The characterization, adsorption isotherms and adsorption kinetics demonstrated chemisorption of DUR on CNC/CTM, through hydrogen bonding, hydrophobic interactions and electron sharing or exchange, which shows that CNC/CTM has definite prospects as an effective adsorbent for removing DUR.
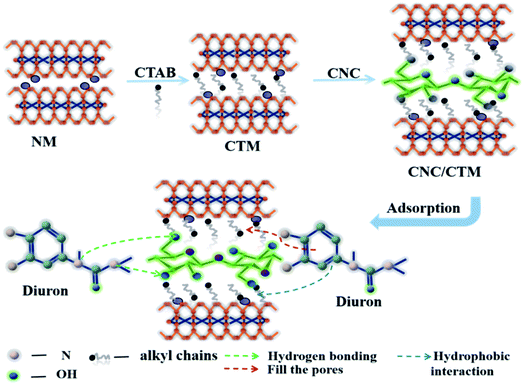 | ||
| Fig. 8 Schematic illustration of the preparation of the CNC/CTM nanocomposite and possible interactions during the adsorption of DUR by CNC/CTM. | ||
Regeneration of CNC/CTM
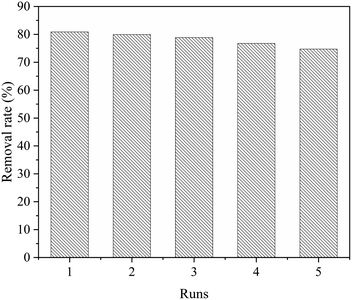
The practical application of adsorbents depends to a large extent on whether they can be reused after simple treatment.70 In this study, anhydrous ethanol is used as a desorption agent, and an experiment involving desorption and regeneration of CNC/CTM is carried out. As shown in Fig. 9, CNC/CTM can be recycled by simple anhydrous ethanol washing at least five times, with only a negligible decrease in removal rate, which demonstrates that it can be reused.Conclusion
In summary, the CNC/CTM nanocomposite has high potential for adsorbing DUR. Characterization of CNC/CTM by SEM, EDS, XPS, FT-IR, BET isotherms, and contact angle measurements confirmed that hydroxyl and alkyl groups were introduced successfully in CNC/CTM. Based on the single-factor experiments, through investigation of the RSM design optimization, the optimal conditions for adsorption were a CNC/CTM dosage of 0.07 g L−1, a DUR concentration of 5.86 mg L−1 and a reaction time of 318.68 min. The experimental data was best described by the Sips isotherm model and a pseudo-second-order kinetic model. The results suggested that the adsorption of DUR by CNC/CTM was mainly chemisorption, resulting in electron sharing or exchange, and the maximum adsorption capacity was 69.04 mg g−1. It can be concluded that multiple interactions were involved in the DUR adsorption process including hydrogen bonding, hydrophobic interactions, electron sharing or exchange, etc. This investigation demonstrated that CNC/CTM could be applied in the removal of DUR from aqueous solutions as a new type of highly efficient adsorbent. The adsorbent could be regenerated via simple solvent washing and reused at least five times. In future investigations, we will further take into consideration the impact of salts/organic solvents on the efficiency of the CNC/CTM nanocomposite in the removal of diuron.Author contribution statement
C. X. Ma, J. Yang, and J. H. Tao: conceptualization, methodology, software, writing – original draft preparation, visualization, investigation; J. F. Li: supervision, software, validation, writing – reviewing and editing, project administration and funding acquisition.Conflicts of interest
The authors declare that they have no conflict of interest.Acknowledgements
Financial support from the National Natural Science Foundation of China (U1803244) and the National Key R&D Program of China (2017YFC0404304) is gratefully acknowledged.Notes and references
- S. Aoudj, A. Khelifa, N. Drouiche and M. Hecini, Desalin. Water Treat., 2016, 57, 18398–18405 CrossRef CAS.
- D. Montes-Grajales, M. Fennix-Agudelo and W. Miranda-Castro, Sci. Total Environ., 2017, 595, 601–614 CrossRef CAS PubMed.
- F. Pietrini, D. Di Baccio, V. Iori, S. Veliksar, N. Lemanova, L. Juškaitė, A. Maruška and M. Zacchini, Sci. Total Environ., 2017, 592, 412–418 CrossRef CAS PubMed.
- Y. Zhang and K. Pagilla, Desalination, 2010, 263, 36–44 CrossRef CAS.
- M. Moeder, O. Carranza-Diaz, G. López-Angulo, R. Vega-Aviña, F. A. Chávez-Durán, S. Jomaa, U. Winkler, S. Schrader, T. Reemtsma and F. Delgado-Vargas, Sci. Total Environ., 2017, 598, 1106–1115 CrossRef CAS PubMed.
- C. Berberidou, V. Kitsiou, D. A. Lambropoulou, A. Antoniadis, E. Ntonou, G. C. Zalidis and I. Poulios, J. Environ. Manage., 2017, 195, 133–139 CrossRef CAS PubMed.
- P. Westlund, S. Isazadeh, A. Therrien and V. Yargeau, Bull. Environ. Contam. Toxicol., 2018, 100, 112–119 CrossRef CAS PubMed.
- M. A. Bahri, L. Calvo, J. Lemus, M. A. Gilarranz, J. Palomar and J. J. Rodriguez, Chem. Eng. J., 2012, 198–199, 346–354 CrossRef CAS.
- Y. El-Nahhal and N. Hamdona, SpringerPlus, 2015, 4, 367 CrossRef PubMed.
- W. Tayeb, A. Nakbi, M. Trabelsi, N. Attia, A. Miled and M. Hammami, J. Hazard. Mater., 2010, 180, 225–233 CrossRef CAS PubMed.
- J. Liu, E. Morales-Narváez, T. Vicent, A. Merkoçi and G.-H. Zhong, Chem. Eng. J., 2018, 354, 1083–1091 CrossRef CAS.
- M. Al Bahri, L. Calvo, M. A. Gilarranz and J. J. Rodriguez, Chem. Eng. Commun., 2016, 203, 103–113 CrossRef.
- C. Tan, N. Gao, Y. Deng, N. An and J. Deng, Chem. Eng. J., 2012, 203, 294–300 CrossRef CAS.
- A. Derylo-Marczewska, M. Blachnio, A. W. Marczewski, A. Swiatkowski and B. Tarasiuk, J. Therm. Anal. Calorim., 2010, 101, 785–794 CrossRef CAS.
- M. Pirsaheb, A. Dargahi, S. Hazrati and M. Fazlzadehdavil, Desalin. Water Treat., 2014, 52, 4350–4355 CrossRef CAS.
- M. Rasmussen and S. D. Minteer, Anal. Methods, 2013, 5, 1140–1144 RSC.
- M. V. López-Ramón, J. Rivera-Utrilla, M. Sánchez-Polo, A. M. S. Polo, A. J. Mota, F. Orellana-García and M. A. Álvarez, Sci. Total Environ., 2019, 650, 1207–1215 CrossRef PubMed.
- F. Eissa, N. E. H. Zidan and H. Sakugawa, Geochem. J., 2015, 49, 309–318 CrossRef CAS.
- J. F. Carneiro, F. L. Silva, A. S. Martins, R. M. P. Dias, G. M. Titato, A. J. Santos-Neto, R. Bertazzoli and M. R. V. Lanza, Chem. Eng. J., 2018, 351, 650–659 CrossRef CAS.
- A. Shareef, D. Page, J. Vanderzalm, M. Williams, V. V. S. R. Gupta, P. Dillon and R. Kookana, Clean: Soil, Air, Water, 2014, 42, 745–752 CAS.
- Y. H. Wang, H. H. Li, G. J. Feng, L. W. Du and D. Q. Zeng, PLoS One, 2017, 12, 18 Search PubMed.
- J. A. S. Moretto, J. P. R. Furlan, A. F. T. Fernandes, A. Bauermeister, N. P. Lopes and E. G. Stehling, Int. Biodeterior. Biodegrad., 2019, 143, 5 Search PubMed.
- Y. Li, R. Zhao, S. Chao, B. Sun, N. Zhang, J. Qiu, C. Wang and X. Li, New J. Chem., 2017, 41, 15601–15611 RSC.
- Z. Sun, S. Li, H. Ding, Y. Zhu, X. Wang, H. Liu, Q. Zhang and C. Zhao, Chemosphere, 2020, 241, 125125 CrossRef CAS PubMed.
- M. A. Fontecha-Cámara, M. V. López-Ramón, L. M. Pastrana-Martínez and C. Moreno-Castilla, J. Hazard. Mater., 2008, 156, 472–477 CrossRef PubMed.
- S. K. Deokar, G. S. Bajad, P. Bhonde, R. P. Vijayakumar and S. A. Mandavgane, J. Polym. Environ., 2017, 25, 165–175 CrossRef CAS.
- A. R. Nunes, A. O. Moura and A. G. S. Prado, J. Therm. Anal. Calorim., 2011, 106, 445–452 CrossRef CAS.
- S. Salvestrini, J. Jovanovic and B. Adnadjevic, Desalin. Water Treat., 2016, 57, 22868–22877 CrossRef CAS.
- Y.-Y. Jia, Y.-H. Zhang, J. Xu, R. Feng, M.-S. Zhang and X.-H. Bu, Chem. Commun., 2015, 51, 17439–17442 RSC.
- A. Naeimi, M. Honarmand and A. Sedri, Ultrason. Sonochem., 2019, 50, 331–338 CrossRef CAS PubMed.
- J. N. Putro, S. P. Santoso, S. Ismadji and Y.-H. Ju, Microporous Mesoporous Mater., 2017, 246, 166–177 CrossRef CAS.
- S. Olivera, H. B. Muralidhara, K. Venkatesh, V. K. Guna, K. Gopalakrishna and Y. Kumar K, Carbohydr. Polym., 2016, 153, 600–618 CrossRef CAS PubMed.
- Q. Zhang, R. Jing, S. Zhao, M. Wu, X. Liu, Y. Shao, F. Lv, A. Liu and Z. Meng, J. Porous Mater., 2019, 26, 1861–1867 CrossRef CAS.
- T. S. Anirudhan, J. R. Deepa and J. Christa, J. Colloid Interface Sci., 2016, 467, 307–320 CrossRef CAS PubMed.
- M. A. Rauf, N. Marzouki and B. K. Körbahti, J. Hazard. Mater., 2008, 159, 602–609 CrossRef CAS PubMed.
- C. Y. Soon, N. A. Rahman, Y. B. Tee, R. A. Talib, C. H. Tan, K. Abdan and E. W. C. Chan, J. Mater. Res. Technol., 2019, 8, 5091–5102 CrossRef CAS.
- O. Bouras, J.-C. Bollinger, M. Baudu and H. Khalaf, Appl. Clay Sci., 2007, 37, 240–250 CrossRef CAS.
- N. Madusanka, K. M. N. de Silva and G. Amaratunga, Carbohydr. Polym., 2015, 134, 695–699 CrossRef CAS PubMed.
- S. Tunc and O. Duman, Appl. Clay Sci., 2010, 48, 414–424 CrossRef CAS.
- N. Mosaleheh and M. N. Sarvi, Environ. Res., 2020, 182, 109056 CrossRef CAS PubMed.
- R. Celis, C. Trigo, G. Facenda, M. D. C. Hermosín and J. Cornejo, J. Agric. Food Chem., 2007, 55, 6650–6658 CrossRef CAS PubMed.
- P. Li, H. Zhang, M. Xia, F. Wang, S. Zhu and W. Lei, Ecotoxicol. Environ. Saf., 2019, 184, 109610 CrossRef CAS PubMed.
- S. Ren, Z. Meng, X. Sun, H. Lu, M. Zhang, A. H. Lahori and S. Bu, Chemosphere, 2020, 239, 124840 CrossRef CAS PubMed.
- P. Zhang, Y.-P. Chen, J.-S. Guo, Y. Shen, J.-X. Yang, F. Fang, C. Li, X. Gao and G.-X. Wang, Water Res., 2014, 57, 31–39 CrossRef CAS PubMed.
- M. Asif Tahir, H. N. Bhatti and M. Iqbal, J. Environ. Chem. Eng., 2016, 4, 2431–2439 CrossRef CAS.
- Q. Manzoor, R. Nadeem, M. Iqbal, R. Saeed and T. M. Ansari, Bioresour. Technol., 2013, 132, 446–452 CrossRef CAS PubMed.
- N. Das, Hydrometallurgy, 2010, 103, 180–189 CrossRef CAS.
- M. M. Hamed, I. M. Ahmed and S. S. Metwally, J. Ind. Eng. Chem., 2014, 20, 2370–2377 CrossRef CAS.
- N. Rajamohan, M. Rajasimman and M. Dilipkumar, J. Taiwan Inst. Chem. Eng., 2014, 45, 2622–2627 CrossRef CAS.
- R. Priya and S. Kanmani, Desalination, 2011, 276, 222–227 CrossRef CAS.
- R. Natarajan and R. Manivasagan, Environ. Sci. Pollut. Res., 2018, 25, 5071–5075 CrossRef CAS PubMed.
- A. E. Ofomaja and Y.-S. Ho, Dyes Pigm., 2007, 74, 60–66 CrossRef CAS.
- R. Natarajan and R. Manivasagan, Environ. Eng. Res., 2020, 25, 788–793 CrossRef.
- R. Gong, Y. Ding, H. Liu, Q. Chen and Z. Liu, Chemosphere, 2005, 58, 125–130 CrossRef CAS PubMed.
- T. S. Anirudhan, J. R. Deepa and F. Shainy, J. Polym. Environ., 2017, 25, 1147–1162 CrossRef CAS.
- F. M. de Souza and O. A. A. dos Santos, Environ. Technol., 2020, 41, 603–616 CrossRef CAS PubMed.
- S. Meephon, T. Rungrotmongkol, S. Puttamat, S. Praserthdam and V. Pavarajarn, J. Environ. Sci., 2019, 84, 97–111 CrossRef PubMed.
- F. Manzotti and O. A. A. dos Santos, Chem. Eng. Commun., 2019, 206, 1515–1532 CrossRef.
- M. J. Spuler, G. Briceño, F. Duprat, M. Jorquera, C. Céspedes and G. Palma, J. Soil Sci. Plant Nutr., 2019, 19, 313–320 CrossRef CAS.
- L. Qin, Z. Zhou, J. Dai, P. Ma, H. Zhao, J. He, A. Xie, C. Li and Y. Yan, J. Taiwan Inst. Chem. Eng., 2016, 62, 228–238 CrossRef CAS.
- H. Fan, Y. Ma, J. Wan, Y. Wang, Z. Li and Y. Chen, Sci. Total Environ., 2020, 708, 134630 CrossRef CAS PubMed.
- M. Quirantes, R. Nogales and E. Romero, J. Hazard. Mater., 2017, 331, 300–308 CrossRef CAS PubMed.
- J. Deng, Y. Shao, N. Gao, Y. Deng, C. Tan, S. Zhou and X. Hu, Chem. Eng. J., 2012, 193–194, 339–347 CrossRef CAS.
- B. Chaumet, S. Morin, S. Boutry and N. Mazzella, Sci. Total Environ., 2019, 651, 1219–1225 CrossRef CAS PubMed.
- X. Yang and B. Al-Duri, J. Colloid Interface Sci., 2005, 287, 25–34 CrossRef CAS.
- L. Aljerf, J. Environ. Manage., 2018, 225, 120–132 CrossRef CAS PubMed.
- J.-P. Simonin, Chem. Eng. J., 2016, 300, 254–263 CrossRef CAS.
- F. Zhao, W. Z. Tang, D. Zhao, Y. Meng, D. Yin and M. Sillanpää, J. Water Process Eng., 2014, 4, 47–57 CrossRef.
- T. S. Anirudhan, F. Shainy and A. Manasa Mohan, Sol. Energy, 2018, 171, 534–546 CrossRef CAS.
- N. A. Khan, H. J. An, D. K. Yoo and S. H. Jhung, J. Hazard. Mater., 2018, 360, 163–171 CrossRef CAS PubMed.
Footnote |
| † Electronic supplementary information (ESI) available. See DOI: 10.1039/d0ra04853d |
| This journal is © The Royal Society of Chemistry 2020 |

