 Open Access Article
Thermally-stable high energy storage performances and large electrocaloric effect over a broad temperature span in lead-free BCZT ceramic
Zouhair Hanani *ab,
Soukaina Merselmiz
 a,
Daoud Mezzane
 a,
M'barek Amjoud
 a,
Andraž Bradeškoc,
Brigita Rožič
 c,
Mohammed Lahcini
 ad,
Mimoun El Marssie,
Andrey V. Ragulyaf,
Igor A. Luk'yanchukeg,
Zdravko Kutnjakc and
Mohamed Gounéb
aIMED-Lab, Cadi Ayyad University, Marrakesh, 40000, Morocco. E-mail: Zouhair.hanani@edu.uca.ma
bICMCB, University of Bordeaux, Pessac, 33600, France
cJozef Stefan Institute, Ljubljana, 1000, Slovenia
dMohammed VI Polytechnic University, Ben Guerir, 43150, Morocco
eLPMC, University of Picardy Jules Verne, Amiens, 80039, France
fFrantsevich Institute for Problems of Materials Science of NASU, Kyiv, 03142, Ukraine
gPhysics Faculty, Southern Federal University, Rostov-on-Don, 344090, Russia
First published on 20th August 2020
Abstract
Ba0.85Ca0.15Zr0.10Ti0.90O3 (BCZT) relaxor ferroelectric ceramics exhibit enhanced energy storage and electrocaloric performances due to their excellent dielectric and ferroelectric properties. In this study, the temperature-dependence of the structural and dielectric properties, as well as the field and temperature-dependence of the energy storage and the electrocaloric properties in BCZT ceramics elaborated at low-temperature hydrothermal processing are investigated. X-ray diffraction and Raman spectroscopy results confirmed the ferroelectric–paraelectric phase transition in the BCZT ceramic. At room temperature and 1 kHz, the dielectric constant and dielectric loss reached 5000 and 0.029, respectively. The BCZT ceramic showed a large recovered energy density (Wrec) of 414.1 mJ cm−3 at 380 K, with an energy efficiency of 78.6%, and high thermal-stability of Wrec of 3.9% in the temperature range of 340–400 K. The electrocaloric effect in BCZT was explored via an indirect approach following the Maxwell relation at 60 kV cm−1. The significant electrocaloric temperature change of 1.479 K at 367 K, a broad temperature span of 87 K, an enhanced refrigerant capacity of 140.33 J kg−1, and a high coefficient of performance of 6.12 obtained at 60 kV cm−1 make BCZT ceramics potentially useful coolant materials in the development of future eco-friendly solid-state refrigeration technology.
1 Introduction
Barium titanate (BaTiO3 denoted as BT) is a bioceramic material without any toxic or volatile elements as compared to lead-based materials like PbZrxTi1−xO3 (PZT), and its properties can be easily tailored by diverse engineering.1–3 However, its high dielectric constant decreases sharply around the Curie temperature (TC) because of the tetragonal-cubic phase transition.4 Hence, the substantial dielectric, energy storage, and electrocaloric properties can only be observed in a narrow temperature range.5,6 To overcome this drawback, researchers have focused on systems with a diffuse ferroelectric transition like ferroelectric relaxors due to the broad operating temperature.7 The doping of BaTiO3 with Ca and Zr demonstrated notable improvements in the electrical and electrocaloric properties due to the enhanced relaxor behavior of BT-based ceramics.8–12In 2009, Liu and Ren13 reported a Pb-free ceramic with composition Ba0.85Ca0.15Zr0.10Ti0.90O3 (BCZT), having extremely high dielectric constant and piezoelectric properties at the Morphotropic Phase Boundary (MPB). This lead-free ceramic possesses a broad frequency-dependent peak corresponding to the temperature-dependent dielectric susceptibility, lower remnant polarization, and slimmer hysteresis loops due to the relaxor ferroelectric nanodomains, which are essential for realizing extremely high energy densities and efficiencies.14–17 Moreover, it was reported that BCZT ceramics possess low dielectric loss (tan![[thin space (1/6-em)]](https://www.rsc.org/images/entities/char_2009.gif) δ) (1–3%), which is encouraging for obtaining high-efficiency energy storage density.10,18–21
δ) (1–3%), which is encouraging for obtaining high-efficiency energy storage density.10,18–21
BCZT relaxor ferroelectric ceramics have been attracting much attention for energy storage applications and electrocaloric cooling devices owing to their outstanding dielectric and ferroelectric properties.22,23 Zhan et al.24 achieved an energy storage density of 590 mJ cm−3 and storage efficiency (η) of 72.8% in Ba0.95Ca0.05Zr0.30Ti0.70O3 ceramics at 160 kV cm−1. Puli et al.25 examined the energy density properties in the (1 − x)BaZr0.20Ti0.80O3–xBa0.70Ca0.30TiO3 (x = 0.10, 0.15, 0.20) system, and observed enhanced energy storage density and high energy storage efficiency of 680 mJ cm−3 and 72.8%, respectively, at x = 0.15, by using an electric field of 170 kV cm−1. The thermal-stability of the recovered energy density plays a crucial role in energy storage technologies. Hence, a wide operating temperature and stable Wrec are essential in this type of application.26
The electrocaloric effect (ECE) in BCZT relaxor ferroelectric ceramics has been widely investigated.15,27–31 Kaddoussi et al.12 studied the ECE in Ba0.85Ca0.15Zr0.10Ti0.90O3 indirectly using the Maxwell relation at 8 kV cm−1, and found a low electrocaloric temperature change (ΔT) of 0.152 K. Using the same approach, Ben Abdessalem et al.28 obtained ΔT = 0.565 K at 30 kV cm−1. Zhou et al.32 studied the compositional dependence of the electrocaloric effect in lead-free (1 − x)Ba(Zr0.20Ti0.80)O3–x(Ba0.70Ca0.30)TiO3 ceramics under a moderate electric field of 28 kV cm−1, and reported a high ECE response of 0.56 K at x = 0.6. For the advanced evaluation of the electrocaloric efficiency, it was highly recommended that the obtained EC properties like ΔT, ΔS (entropy change) be linked to the total energy density (Wtot) of the EC material in question to access the coefficient of performance (COP = input power/output cooling power).33 Nevertheless, few works have simultaneously studied the energy storage performances and electrocaloric effect (ECE) in BT-based ferroelectric materials. Srikanth et al.34 investigated the electrocaloric effect in BaxSr1−xTiO3 ferroelectric ceramics using an indirect approach. ΔT were found to be 0.67, 0.83, and 0.61 K and ΔS was 0.9, 1, and 0.7 J kg−1 K−1 for x = 0.7, 0.8, and 0.9, respectively, under an electric field of 33 kV cm−1. Besides, energy-storage densities of 90, 142, 144 mJ cm−3 were observed for x = 0.7, 0.8, and 0.9, respectively, which correspond to the estimated COP of 17, 5.47, and 5.68 for x = 0.7, 0.8, and 0.9, respectively.34 We previously reported the synthesis of the BCZT ceramic by surfactant-assisted solvothermal processing.15 However, only a small total and recovered energy density and electrocaloric response were obtained due to the low applied electric field of 6.6 kV cm−1. It was stated before that the low-temperature hydrothermal processing allowed the possibility to synthesize BCZT ceramics with enhanced dielectric and ferroelectric properties.35 In this work, the ferroelectric-paraelectric phase transition in the BCZT ceramic was investigated via temperature-dependent X-ray diffraction, Raman spectroscopy and dielectric measurements. Field-dependence and the temperature stability of the energy storage performances of the BCZT ceramic were also investigated at 60 kV cm−1. Moreover, the electrocaloric effect in BCZT ceramic was explored via an indirect approach following the Maxwell relation, and the ECE performances like the refrigerant capacity (RC)33 and COP of the BCZT ceramic were examined and compared to lead-free and lead-based materials.
2 Experimental section
Ba0.85Ca0.15Zr0.10Ti0.90O3 (BCZT) powder was elaborated by low-temperature hydrothermal processing at 160 °C for 24 h, followed by sintering at 1250 °C for 10 h. Details about the elaboration and additional characterization of BCZT powder and ceramic can be found in previous reports.35,36 A transmission electron microscope (TEM, JEOL – ARM 200F Cold FEG TEM/STEM) operating at 200 kV, equipped with a spherical aberration (Cs) probe and image correctors with point resolution 0.12 nm, was used to observe the morphology of the BCZT powder. Thermogravimetric analysis (TGA, Discovery Series TGA 55, TA instruments) was used to characterize the transformations occurring in the BCZT powder from 300 to 1100 K at a heating rate of 10 °C min−1 and a nitrogen flow of 40 ml min−1. The crystalline structure and structural change in the BCZT ceramic were examined by X-ray diffraction (XRD, Rigaku SmartLab). The measurements were done in the temperature range 300–400 K at a step angle of 0.02° in the 2θ range from 10 to 80° using Cu-Kα radiation (λ ∼ 1.540593 Å). Raman spectroscopy was also employed to determine the structural property changes in the BCZT ceramic from 300 to 400 K. For this purpose, the BCZT sample was excited using the polarized radiation of an argon laser (λ = 514.5 nm) and the Raman spectra were recorded using a Renishaw inVia Reflex spectrometer. A well-calibrated Linkam heating–cooling stage with temperature stability of 0.1 K was utilized to control the sample temperature. To compare the spectra obtained at various temperatures, a Bose–Einstein correction was performed. The surface morphology was analyzed using a scanning electron microscope (SEM, Tescan VEGA-3) at a voltage of 10 kV. The dielectric properties of gold-sputtered BCZT pellets in the frequency range of 20 Hz to 1 MHz were measured using a precision LCR meter (HP 4284A, 20 Hz to 1 MHz). The ferroelectric hysteresis loops of the BCZT sample, with a thickness of 340 μm, were measured using a ferroelectric test system (AiXACCT, TF Analyzer 2000) equipped with a high-voltage amplifier (TREK model 609E-6) in a silicone oil bath. The hysteresis loops were obtained by using triangular voltage waveforms at a frequency of 10 Hz at room temperature in different electric fields (10–60 kV cm−1), and in the temperature range of 300–400 K with a 5 K step for heating cycles at 60 kV cm−1. The ECE response was calculated from the recorded P–E hysteresis loops at 10 Hz by using the indirect Maxwell approach.3 Results and discussion
3.1. Structural properties
A TEM image of the BCZT powder and the particle size distribution are depicted in Fig. 1a and b, respectively. Near-spherical BCZT nanoparticles with an average particle size of 94 nm were formed, as seen in the inset of Fig. 1b. The growth mechanism of the BCZT powder was reported in ref. 37 The thermal evolution of the as-prepared BCZT powder via low-temperature hydrothermal processing is shown in Fig. 1c. Two consecutive weight losses at temperatures in the 300–520 K range are due to dehydration and dehydroxylation phenomena. The weight loss in the range 520–770 K is associated with the thermal decomposition of different organic compounds, and after 770 K, the weight loss remained constant. More interestingly, the absence of weight loss above 770 K was attributed to the formation and crystallization of BCZT perovskite phase, as reported previously,27,38–42 and the low total weight loss (6.12%) in the BCZT powder indicates that the BCZT perovskite phase was formed at low-temperature (160 °C).37 Therefore, the synthesis temperature of BCZT powders can be decreased to a low temperature of 160 °C, which is about 1200 °C lower when compared with the solid-state reaction, and 840 °C lower when compared with sol–gel methods.35 This temperature decrease is important in the large-scale industrial production of ferroelectric materials. Fig. 1d provides a typical SEM image of the microstructure of BCZT sintered ceramic at 1250 °C for 10 h. Coarse and flattened grains with an average grain size of 22.1 μm (determined by the intercept method) and well-defined grain boundaries, were observed in the BCZT ceramic. Interestingly, as highlighted with dashed circles, the domain patterns of parallel stripes with average domain sizes (150–600 nm) were seen inside the grains.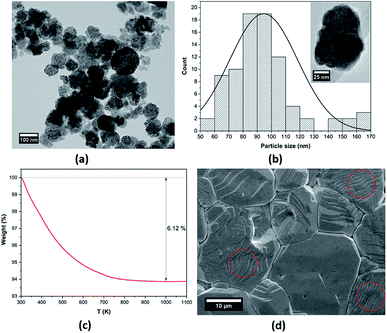 | ||
| Fig. 1 (a) TEM image, (b) grain size distribution (a single BCZT nanoparticle is shown in the inset), (c) TGA curve of the BCZT powder, and (d) SEM micrograph of the BCZT sintered ceramic. | ||
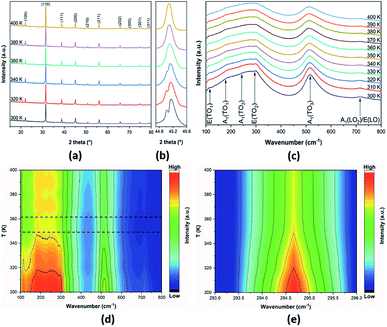
The structural changes in the BCZT sintered ceramic were examined via the temperature dependence of XRD and Raman spectroscopy. Fig. 2a displays the temperature-dependent XRD patterns of the BCZT ceramic in the temperature range between 300 and 400 K. Pure perovskite structures were formed without any secondary phases, and all peaks were indexed based on the standard BaTiO3 pattern (JCPDS card no. 96-901-4669). At 300 K, the BCZT ceramic exhibited tetragonal symmetry with space group P4mm, due to the peak splitting at around 2θ ∼ 45° (Fig. 2b).13,43
To gain insight into the structural changes in the BCZT ceramic with increasing temperature, the thermal evolution of the peak around 2θ ∼ 45° was followed by in situ XRD (Fig. 2b). On increasing the temperature, the peak at around 2θ ∼ 45° tends to merge into a single peak between 340 and 360 K due to the tetragonal-cubic phase transition,43 and with a further increase in temperature, this peak became sharper. It is worth mentioning that with increasing temperature, all peaks shifted toward lower 2θ, due to the unit cell expansion and the decreasing of the tetragonal phase.12 Besides, Raman spectroscopy is used to have an idea about this structural change in BCZT sintered ceramic in the temperature range 300–400 K (Fig. 2c). The observed Raman peaks around 115, 180, 245, 294, 517, and 716 cm−1 correspond to E(TO1), A1(TO1), A1(TO2), E(TO2), A1(TO3), and A1(LO2)/E(LO), respectively. These peaks are characteristics of perovskite oxides.44,45 With increasing temperature, the peak position and the intensity of the Raman modes present a decreasing trend, alongside with Raman modes broadening, which is similar to other ferroelectric materials.44,46 A 2D colour map of Raman spectra of BCZT ceramic is illustrated in Fig. 2d.
It was observed that the low-temperature data had a much greater signal and lower background as compared to the high-temperature data. Note that the changes in the contour plots between 349 and 361 K (marked by the dashed rectangles) can be attributed to structural changes in the BCZT ceramic. It was stated that the E(TO2) mode is associated with the tetragonal phase transition.47 In order to reveal the origin of the detected structural change in the BCZT ceramic, the wavenumbers around 292–296 cm−1 and temperature between 300 and 400 K were plotted using a 2D colour map as shown in Fig. 2e. It was observed that the intensity of the E(TO2) mode decreased with increasing temperature, and an abrupt intensity change in this mode occurred at 355 K due to the structural change from ferroelectric (tetragonal) to paraelectric (cubic).15,48
3.2. Dielectric properties
The room-temperature dielectric properties of the BCZT ceramic sintered at 1250 °C for 10 h are depicted in Fig. 3a. The dielectric constant (εr) and the dielectric loss (tan![[thin space (1/6-em)]](https://www.rsc.org/images/entities/char_2009.gif) δ) of the BCZT ceramic decreased with the increasing frequency. At 1 kHz, εr and tan
δ) of the BCZT ceramic decreased with the increasing frequency. At 1 kHz, εr and tan![[thin space (1/6-em)]](https://www.rsc.org/images/entities/char_2009.gif) δ were found to be 5000 and 0.029, respectively, these properties were enhanced as compared to some reported works in the literature using BCZT ceramics with the same composition.49–52 Fig. 3b displays the temperature dependence of εr and tan
δ were found to be 5000 and 0.029, respectively, these properties were enhanced as compared to some reported works in the literature using BCZT ceramics with the same composition.49–52 Fig. 3b displays the temperature dependence of εr and tan![[thin space (1/6-em)]](https://www.rsc.org/images/entities/char_2009.gif) δ of the BCZT ceramic at different frequencies in the temperature range of 300–400 K. The broad peak at around 340 K is associated with the tetragonal-cubic phase transition.10,53,54 The low TC observed in the BCZT ceramic is related to the elaboration method, calcination, sintering temperature and dwell time.55 Hunpratub et al.56 elaborated a BCZT ceramic with the same composition using the hydrothermal reaction at different sintering temperatures and found TC ranging between 333 and 343 K. These results corroborate those obtained by XRD and Raman analyses, assuming the structural change from ferroelectric (tetragonal) to paraelectric (cubic) in the BCZT ceramic.
δ of the BCZT ceramic at different frequencies in the temperature range of 300–400 K. The broad peak at around 340 K is associated with the tetragonal-cubic phase transition.10,53,54 The low TC observed in the BCZT ceramic is related to the elaboration method, calcination, sintering temperature and dwell time.55 Hunpratub et al.56 elaborated a BCZT ceramic with the same composition using the hydrothermal reaction at different sintering temperatures and found TC ranging between 333 and 343 K. These results corroborate those obtained by XRD and Raman analyses, assuming the structural change from ferroelectric (tetragonal) to paraelectric (cubic) in the BCZT ceramic.
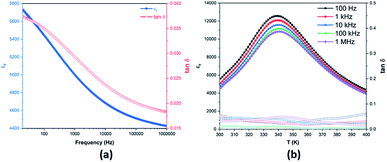 | ||
| Fig. 3 (a) Room-temperature frequency dependence and (b) temperature-dependence of the dielectric properties of the BCZT ceramic. | ||
3.3. Energy storage in the BCZT ceramic
 | (1) |
 | (2) |
 | (3) |
Room-temperature P–E hysteresis loops of the BCZT ceramic at various electric fields from 10 to 60 kV cm−1 are shown in Fig. 5a. It was observed that the BCZT ceramic exhibited enhanced ferroelectric properties. The maximal polarization (Pmax), remnant polarization (Pr), and coercive field (Ec) increased on increasing the applied electric field. At 60 kV cm−1, the values of Pmax, Pr, and Ec reached 27.21 μC cm−2, 8.59 μC cm−2 and 4.10 kV cm−1, respectively. It should be noted that the hysteresis loops were not fully saturated at 60 kV cm−1; however, the thickness of the sample prevented us from further increasing the electric field.
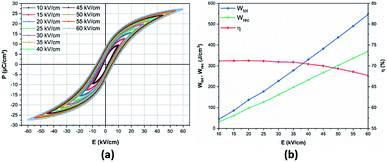 | ||
| Fig. 5 (a) Room-temperature electric field-dependence of P–E loops; (b) energy storage performances in the BCZT ceramic. | ||
From the first two equations, the increasing applied electric field boosted the obtained energy storage density. The room-temperature electric field-dependence of the energy storage properties of the BCZT ceramic is shown in Fig. 5b. As desired, after increasing the applied electric field from 10 to 60 kV cm−1, the linear behavior of the Wtot and Wrec was observed, where, Wtot and Wrec increased from 44.1 and 31.4 mJ cm−3 to 546.1 and 367.2 mJ cm−3, respectively. However, η dropped from 71.2% to 67.2%, respectively. At 60 kV cm−1, Xu et al.26 and Puli et al.57 obtained Wrec of 121.6 mJ cm−3 (η = 51.3%) and 280 mJ cm−3 (η = 58.3%), respectively. These values are lower than those obtained in the BCZT ceramic (Wrec = 367.2 mJ cm−3, η = 67.2%).
Table 1 compares the energy storage properties of the BCZT ceramic with other lead-free ceramics reported in the literature. Under the high electric field of 160 kV cm−1, Zhan et al.24 achieved a recovered energy density of 590 mJ cm−3 and storage efficiency of 72.8% in the Ba0.95Ca0.05Zr0.3Ti0.7O3 ceramic. Meanwhile, using an electric field of 170 kV cm−1, Puli et al.25 observed a recovered energy density and energy storage efficiency of 680 mJ cm−3 and 72%, respectively, in the 0.85BaZr0.2Ti0.8O3–0.15Ba0.7Ca0.3TiO3 system. In a recent study, Puli et al.57 observed an energy storage density of 1.33 J cm−3 at 106 kV cm−1 but with a reduced energy efficiency of 52.3% in the Ba0.85Ca0.15Zr0.10Ti0.90O3 ceramic. It was stated before that the non-saturated P–E loops in the BCZT ceramic could help to further increase the applied electric field, hence, enhancing the energy density. However, to avoid the electric breakdown at high temperature, the electric field was kept at 60 kV cm−1.
| Ceramic | Wtot (mJ cm−3) | Wrec (mJ cm−3) | η (%) | E (kV cm−1) | T (K) | Ref. |
|---|---|---|---|---|---|---|
| Ba0.85Ca0.15Zr0.10Ti0.90O3 | 546.1 | 367.2 | 67.2 | 60 | 300 | This work |
| Ba0.85Ca0.15Zr0.10Ti0.90O3 | 535.3 | 398.5 | 74.4 | 60 | 340 | This work |
| Ba0.85Ca0.15Zr0.10Ti0.90O3 | 526.6 | 414.1 | 78.6 | 60 | 380 | This work |
| Ba0.85Ca0.15Zr0.10Ti0.90O3 | 436.3 | 302.4 | 69.3 | 50 | 300 | This work |
| Ba0.85Ca0.15Zr0.10Ti0.90O3 | 278.3 | 197.3 | 70.9 | 35 | 300 | This work |
| Ba0.85Ca0.15Zr0.10Ti0.90O3 | 136.7 | 97.4 | 71.3 | 20 | 300 | This work |
| Ba0.85Ca0.15Zr0.10Ti0.90O3 | 44.1 | 31.4 | 71.2 | 10 | 300 | This work |
| Ba0.85Ca0.15Zr0.10Ti0.90O3 | 236.4 | 121.6 | 51.3 | 60 | RT | 26 |
| Ba0.85Ca0.15Zr0.10Ti0.90O3 | 480.3 | 280 | 58.3 | 60 | RT | 57 |
| Ba0.85Ca0.15Zr0.10Ti0.90O3 | 1330 | 695.6 | 52.3 | 106 | RT | 57 |
| 0.6BaZr0.20Ti0.80O3–0.4Ba0.70Ca0.30TiO3 | 207 | 149 | 72 | 35 | 303 | 63 |
| Ba0.85Ca0.15Zr0.10Ti0.90O3 (32.84 μm) | 113.8 | 38.6 | 33.9 | 20 | 298 | 64 |
| Ba0.85Ca0.15Zr0.10Ti0.90O3 (32.84 μm) | 90.2 | 71.2 | 78.9 | 20 | 373 | 64 |
| Ba0.85Ca0.15Zr0.10Ti0.90O3 (44.37 μm) | 98.1 | 36.4 | 37.1 | 20 | 298 | 64 |
| Ba0.85Ca0.15Zr0.10Ti0.90O3 (44.37 μm) | 81.1 | 69.6 | 85.8 | 20 | 373 | 64 |
| Ba0.95Ca0.05Zr0.30Ti0.70O3 | 810.4 | 590 | 72.8 | 160 | RT | 24 |
| Ba0.95Ca0.05Zr0.20Ti0.80O3 | 569.4 | 410 | 72 | 120 | RT | 65 |
| 0.85BaZr0.20Ti0.80O3–0.15Ba0.70Ca0.30TiO3 | 940 | 680 | 72 | 170 | RT | 25 |
| Ba0.975La0.017(Zr0.05Ti0.90)Sn0.05O3 | 108.3 | 65 | 60 | 12 | 300 | 66 |
| BaTi0.89Sn0.11O3 | 92.7 | 84.4 | 91.04 | 25 | 333 | 67 |
| BaTiO3 | 1594 | 450 | 28.23 | 110 | RT | 68 |
| BaZr0.05Ti0.95O3 | 302 | 218 | 72 | 50 | RT | 69 |
| 0.90(0.92Bi0.50Na0.50TiO3–0.08BaTiO3)–0.10NaNbO3 | 1082 | 710 | 65.6 | 70 | 298 | 61 |
| 0.90(0.92Bi0.50Na0.50TiO3–0.08BaTiO3)–0.10NaNbO3 | 954.1 | 790 | 82.8 | 70 | 373 | 61 |
| Bi0.48La0.02Na0.40K0.10Ti0.98Zr0.02O3 | 1033 | 630 | 61 | 60 | 298 | 62 |
| Bi0.48La0.02Na0.40K0.10Ti0.98Zr0.02O3 | 783.1 | 650 | 83 | 60 | 348 | 62 |
| Bi0.48La0.02Na0.40K0.10Ti0.98Zr0.02O3 | 755.5 | 680 | 90 | 60 | 298 | 62 |
 | (4) |
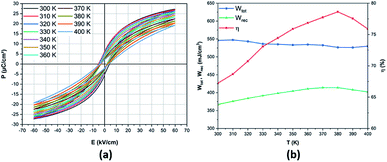 | ||
| Fig. 6 Temperature-dependence of (a) P–E loops; (b) energy storage performances of the BCZT ceramic at 60 kV cm−1. | ||
The temperature-dependence of ΔWrec,T/Wrec,300 K values in BCZT ceramics is depicted in Fig. 7. It was observed that ΔWrec,T/Wrec,300 K of BCZT ceramics is always less than 12.7% (Wrec ∼ 367.2–414.1 mJ cm−3) in the temperature range from 300 to 400 K, indicating the excellent energy storage capabilities in a wide temperature range. The energy-storage variation in BCZT ceramics is lower than that reported by Jayakrishnan et al.63 in 0.6BaZr0.20Ti0.80O3–0.4Ba0.70Ca0.30TiO3, where Wrec at 25 kV cm−1 dropped from 121, 115 to 65 mJ cm−3, at 303, 323 and 363 K, respectively, corresponding to ΔWrec,T/Wrec,300 K of 46.3%. Furthermore, the obtained value of the variation in the recovered energy density was also lower than that found by Xu et al.26 in the BCZT–0.5 wt% MgO ceramic (14.18%). Despite the enhanced energy efficiency in BCZT ceramics with different grain sizes found by Cai et al.64 at 20 kV cm−1, the high variation in the recovered energy density was observed in the temperature range of 298 to 393 K (84.4% and 91.2 for BCZT with grain sizes of 32.84 and 44.37 μm, respectively). Besides, Liu et al.70 obtained an ESV value of 15% in the temperature range of 298–373 K in the lead-based Pb0.97La0.02(Zr0.58Sn0.335Ti0.085)O3 ceramic, which is higher than that obtained in the BCZT ceramic. A similar energy-storage variation was obtained by Xu et al.61 in the 0.90(0.92Bi0.50Na0.50TiO3–0.08BaTiO3)–0.10NaNbO3 ceramic at 70 kV cm−1 in the temperature range of 298–423 K.
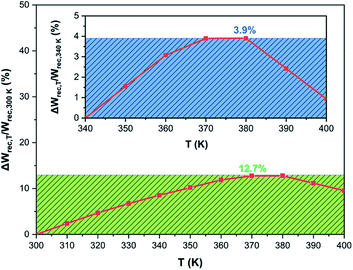 | ||
| Fig. 7 The thermal stability of ΔWrec,T/Wrec,300 K and ΔWrec,T/Wrec,340 K (inset) of the BCZT ceramic at 60 kV cm−1. | ||
In the case of a high-temperature range, the temperature variation in Wrec values was estimated within the temperature range of 340–400 K by eqn (5), according to Malik et al.,71
 | (5) |
A plot of ΔWrec,T/Wrec,340 K values as a function of temperature in the BCZT ceramic is displayed in the inset of Fig. 7. The temperature variation in the energy storage density values of the BCZT ceramic was estimated to be 3.9% (398.5–414.1 mJ cm−3). These values are considered to be excellent as compared with many lead-free ferroelectric ceramics.26,62,63,71,72
For instance, Butnoi et al.62 found an ESV ratio of 4.6% in Bi0.48La0.02Na0.40K0.10Ti0.98Zr0.02O3 ceramics in the temperature range of 348–423 K. The high energy storage density in relaxor ferroelectric ceramics is due to the diffuse phase transition.73 Consequently, ferroelectricity can be detected in a wide temperature range in relaxor ferroelectrics, which significantly reduces ESV, thus keeping energy storage enhanced in a wide temperature range.15 It is worth recalling that the BCZT powder was elaborated at 160 °C for 24 h in contrast to other lead-free-based powders reported in the literature, including BCZT, which request an inevitable calcination step at high temperature.25,26,57,61–65,69 Hence, the hydrothermal method has better advantages in the elaboration of BCZT ceramics at lower sintering temperatures and with outstanding and thermally-stable energy storage performances.
3.4. The electrocaloric effect in BCZT ceramics
The electrocaloric effect (ECE) under higher electric fields in BCZT relaxor ferroelectric ceramics was evaluated by using the indirect approach based on the Maxwell relation.33 The indirect method is based on calculating the ECE from the measured ferroelectric order parameter P (T, E) obtained from the temperature-dependence of the P–E hysteresis loops, as shown in Fig. 8a. A fifth-order polynomial fitting of the upper polarization branches was performed at every fixed applied electric field. It can be seen that P gradually diminished with increasing the temperature. The isothermal entropy change (ΔS) and the electrocaloric temperature change (ΔT) were calculated from eqn (7) and (8),
 | (6) |
 | (7) |
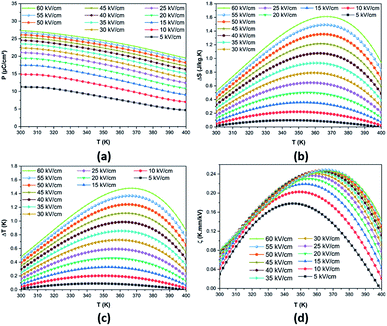 | ||
| Fig. 8 Temperature-dependence of (a) P, (b) ΔS, (c) ΔT and (d) ζ at various applied electric fields in the BCZT ceramic. | ||
The thermal evolution of the reversible electrocaloric temperature change (ΔT) and the corresponding entropy change (ΔS) under different applied electric fields in the BCZT ceramic are shown in Fig. 8b and c, respectively. ΔT and ΔS increased with increasing the applied electric field, and the temperature at which the maximum was obtained shifted toward higher temperatures. This indicates that the TC of BCZT ceramic shifted to higher temperatures under a higher electric field.74 At 60 kV cm−1, a large ΔT and ΔS of 1.479 K and 1.613 J kg−1 K−1 were found in the BCZT ceramic in the vicinity of the tetragonal-cubic phase transition at 367 K, respectively. Comparable values of ΔS = 1.78 and 1.53 J kg−1 K−1 were reported by Xin et al.6 at 70 kV cm−1 in Ba0.9Ca0.1Zr0.05Ti0.95O3 and Ba0.9Ca0.1Zr0.1Ti0.9O3 ceramics, respectively. Fig. 8d plots the electrocaloric responsivity ζ = ΔT/ΔE as a function of temperature and applied electric field. It was observed that the temperature of the ECE responsivity peak and its magnitude initially increased with increasing the applied electric field then gradually became stable at higher fields. The ECE responsivity saturation could be ascribed to the diffused phase transition and the relaxor behavior in the BCZT ceramic, as observed by Xin et al.6
Table 2 compares the EC responses (ΔT and ζ) in BCZT ceramics with previously published results on lead-free ceramics obtained via the indirect approach under different applied electric fields. At a low electric field of 8 kV cm−1, our ceramics exhibited comparable ECE properties (ΔT = 0.155 K and ζ = 0.194 K mm kV−1 at 347 K) to those found in Ba0.85Ca0.15Zr0.10Ti0.90O3 ceramics synthesized via the solid-state method (ΔT = 0.152 K and ζ = 0.19 K mm kV−1 at 343 K) by Kaddoussi et al.12 Hanani et al.27 reported ECE properties (ΔT = 0.492 K and ζ = 0.289 K mm kV−1 at 360 K) at a low electric field of 17 kV cm−1 in the rod-like Ba0.85Ca0.15Zr0.10Ti0.90O3 ceramic, elaborated by a surfactant-assisted solvothermal route, which are just slightly higher than the present results (ΔT = 0.38 K and ζ = 0.223 K mm kV−1 at 353 K). Nevertheless, the ECE of our sample at 40 kV cm−1 (ΔT = 0.986 K and ζ = 0.245 K mm kV−1 at 363 K) is larger than that obtained for the Ba0.65Sr0.35TiO3 ceramic by a spark plasma sintering process (ΔT = 0.328 K and ζ = 0.164 K mm kV−1 at 303 K) as stated by Liu et al.75 Furthermore, Patel et al.76 elaborated the Ba0.85Ca0.075Sr0.075Ti0.90Zr0.10O3 ceramic by the conventional solid-state method, revealing that the ECE response reached high values of 1.6 K and 0.405 K mm kV−1 for ΔT and ζ, respectively, under 39.5 kV cm−1 at room temperature. Smail et al.66 reported ECE properties (ΔT = 0.24 K and ζ = 0.20 K mm kV−1 at 338 K) at a low electric field of 12 kV cm−1 in Ba0.975La0.017(Zr0.05Ti0.90)Sn0.05O3 ceramics synthesized by solid-state reaction. These differences can be attributed to the synthesis conditions (such as calcination and sintering), chemical doping, grain shape, the number of the coexisting phases as well as the applied external electric field.
| Ceramic | ΔT (K) | ΔE (kV cm−1) | T (K) | ζ (K mm kV−1) | Ref. |
|---|---|---|---|---|---|
| Ba0.85Ca0.15Zr0.10Ti0.90O3 | 1.479 | 60 | 367 | 0.246 | This study |
| Ba0.85Ca0.15Zr0.10Ti0.90O3 | 0.986 | 40 | 363 | 0.246 | This study |
| Ba0.85Ca0.15Zr0.10Ti0.90O3 | 0.459 | 20 | 355 | 0.229 | This study |
| Ba0.85Ca0.15Zr0.10Ti0.90O3 | 0.380 | 17 | 353 | 0.223 | This study |
| Ba0.85Ca0.15Zr0.10Ti0.90O3 | 0.328 | 15 | 353 | 0.218 | This study |
| Ba0.85Ca0.15Zr0.10Ti0.90O3 | 0.155 | 8 | 347 | 0.194 | This study |
| Ba0.85Ca0.15Zr0.10Ti0.90O3 | 0.492 | 17 | 360 | 0.289 | 27 |
| Ba0.85Ca0.15Zr0.10Ti0.90O3 | 0.4 | 21.5 | 370 | 0.186 | 3 |
| Ba0.85Ca0.15Zr0.10Ti0.90O3 | 0.152 | 8 | 373 | 0.19 | 12 |
| Ba0.90Ca0.10Zr0.05Ti0.95O3 | 0.465 | 25 | 392 | 0.186 | 28 |
| Ba0.91Ca0.09Zr0.14Ti0.86O3 | 0.3 | 20 | 328 | 0.150 | 79 |
| Ba0.92Ca0.08Zr0.05Ti0.95O3 | 0.38 | 15 | 410 | 0.253 | 80 |
| 0.6BZT–0.4BCT | 0.58 | 28 | 398 | 0.21 | 32 |
| BZT–30BCT | 0.30 | 20 | 333 | 0.15 | 79 |
| Ba0.975La0.017(Zr0.05Ti0.90)Sn0.05O3 | 0.24 | 12 | 338 | 0.20 | 66 |
| BaTi0.89Sn0.11O3 | 0.71 | 25 | 325 | 0.284 | 67 |
| Ba0.65Sr0.35TiO3 | 0.83 | 40 | 303 | 0.21 | 75 |
| Ba0.85Sr0.15Ti0.9Zr0.1O3 | 2.4 | 37 | 303 | 0.65 | 81 |
| Ba0.85Ca0.075Sr0.075Ti0.90Zr0.10O3 | 1.60 | 39.5 | 303 | 0.405 | 76 |
The applied electric field-dependence of ΔT and the EC responsivity ζ at the peak temperature are presented in Fig. 9a. ΔT increased with the increasing electric field. In contrast, ζ increased rapidly at low electric fields, then became nearly saturated above 40 kV cm−1, and finally started decreasing above 55 kV cm−1. The EC responsivity ζ, therefore, exhibited a maximum as predicted by theory and confirmed by experimental results in relaxor ferroelectrics.77,78
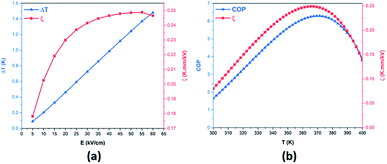 | ||
| Fig. 9 (a) Electric field-dependence of ΔT and ζ at the temperature of peak response; (b) thermal evolution of the COP and ζ in the BCZT ceramic at 55 kV cm−1. | ||
For practical applications, the temperature range (Tspan) in which a large ECE can be maintained is also critical. Here, Tspan was introduced as the full width at half maximum (FWHM) of the ECE peak at 60 kV cm−1.82,83 The Tspan value of 87 K was found in the BCZT ceramic, indicating that the BCZT ceramic can maintain a high EC response over a relatively broad temperature range as compared to other materials.82,84–86 The suitability of the electrocaloric material for application in new cooling technologies is typically evaluated by a parameter similar to refrigerant capacity, RC = ΔS × δTFWHM = ΔS × Tspan.33,83,87,88 This parameter was estimated to be 140.33 J kg−1 at 60 kV cm−1 in the BCZT ceramic. The obtained value is higher as compared to many other lead-free ceramics.74,84 Another important criterion in evaluating the efficiency of an electrocaloric material is the coefficient of performance (COP) as defined by eqn (8),89,90 where Q is the isothermal heat.
 | (8) |
It was established before that ζ exhibited a maximum at 55 kV cm−1 (Fig. 9a); hence, the COP value was determined at 55 kV cm−1. The COP of the BCZT ceramic reached a maximum of 6.29 at 365 K and 55 kV cm−1 as shown in Fig. 9b. The obtained value is higher than those reported in several works in lead-free materials89,91–94 and some lead-based materials.90,95–98 For instance, Hao et al.97 found a COP value of 2.9 in Pb0.97La0.02Zr0.87Sn0.08Ti0.07O3 thick film.97 The obtained high values of ΔT, ΔS, ζ, RC and COP, and the wide operating temperature range make BCZT ceramics, elaborated by the low-temperature hydrothermal method, a promising candidate for eco-friendly electrocaloric cooling technologies.
4 Conclusions
In conclusion, the temperature-dependent structural, dielectric, energy storage and EC properties in the lead-free BCZT ceramic were elaborated by low-temperature hydrothermal processing and systematically studied. Enhanced dielectric properties were found (at room temperature, εr = 5000 and tan![[thin space (1/6-em)]](https://www.rsc.org/images/entities/char_2009.gif) δ = 0.029). The BCZT ceramic exhibited a large Wrec of 414.1 mJ cm−3 at 380 K, with an energy efficiency of 78.6%. In contrast to other BaTiO3-based lead-free ceramics, the BCZT ceramic exhibits the lower temperature variation of the recovered energy density of 12.7% and 3.9% in the temperature ranges of 300–400 K and 340–400 K, respectively. Besides, the existence of the large electrocaloric effect in the BCZT ceramic was demonstrated. At 60 kV cm−1, a maximum ΔT and ΔS of 1.479 K and 1.613 J kg−1 K−1 were observed at 367 K, whereas, the maximum value of the EC responsivity ζ = 0.25 K mm kV−1 was found at 55 kV cm−1. The corresponding COP maximum value of 6.29 was calculated at 55 kV cm−1. The temperature range (Tspan) in which a large ECE was maintained, and refrigerant capacity RC, were estimated to be 87 K and 140.33 J kg−1, respectively, at 60 kV cm−1. Therefore, the obtained excellent electrocaloric properties make the BCZT ceramic a potential candidate for solid-state electrocaloric cooling technologies.
δ = 0.029). The BCZT ceramic exhibited a large Wrec of 414.1 mJ cm−3 at 380 K, with an energy efficiency of 78.6%. In contrast to other BaTiO3-based lead-free ceramics, the BCZT ceramic exhibits the lower temperature variation of the recovered energy density of 12.7% and 3.9% in the temperature ranges of 300–400 K and 340–400 K, respectively. Besides, the existence of the large electrocaloric effect in the BCZT ceramic was demonstrated. At 60 kV cm−1, a maximum ΔT and ΔS of 1.479 K and 1.613 J kg−1 K−1 were observed at 367 K, whereas, the maximum value of the EC responsivity ζ = 0.25 K mm kV−1 was found at 55 kV cm−1. The corresponding COP maximum value of 6.29 was calculated at 55 kV cm−1. The temperature range (Tspan) in which a large ECE was maintained, and refrigerant capacity RC, were estimated to be 87 K and 140.33 J kg−1, respectively, at 60 kV cm−1. Therefore, the obtained excellent electrocaloric properties make the BCZT ceramic a potential candidate for solid-state electrocaloric cooling technologies.
Statement of contributions
Z. H., D. M. and M. A. designed the research. Z. H. and S. M. performed the experiments, analyzed the results and drafted the manuscript. A. B. carried out the temperature dependence of the P–E measurements. L. M. provided facilities for TGA analyses; M. M. provided facilities for Raman spectroscopy; B. R., A. V. R., I. A. L., and Z. K. reviewed and edited the drafted manuscript and provided discussion of the energy storage and electrocaloric properties sections; M. M., I. A. L., B. R., Z. K. and M. G. coordinated and financed the project. D. M., M. A. and M. G. supervised the overall project. The manuscript was written through contributions of all the authors.Conflicts of interest
There are no conflicts to declare.Acknowledgements
The authors gratefully acknowledge the generous financial support of CNRST Priority Program PPR 15/2015 and the European Union Horizon 2020 Research and Innovation actions MSCA-RISE-ENGIMA (No. 778072) and MSCA-RISE-MELON (No. 872631). Z. K. and B. R. acknowledge Slovenian Research Agency grant J1-9147 and program P1-0125.References
- I. Coondoo, N. Panwar, H. Amorín, M. Alguero and A. L. Kholkin, J. Appl. Phys., 2013, 113, 214107 CrossRef.
- J. Gao, X. Hu, Y. Wang, Y. Liu, L. Zhang, X. Ke, L. Zhong, H. Zhao and X. Ren, Acta Mater., 2017, 125, 177–186 CrossRef CAS.
- S. Patel, P. Sharma and R. Vaish, Phase Transitions, 2016, 89, 1062–1073 CrossRef CAS.
- F. Wang, W. Li, H. Jiang, M. Xue, J. Lu and J. Yao, J. Appl. Phys., 2010, 107, 043528 CrossRef.
- K. Uchino and S. Nomura, Ferroelectr., Lett. Sect., 1982, 44, 55–61 CrossRef CAS.
- X. Nie, S. Yan, S. Guo, F. Cao, C. Yao, C. Mao, X. Dong and G. Wang, J. Am. Ceram. Soc., 2017, 100, 5202–5210 CrossRef CAS.
- J. Wu, in Advances in Lead-Free Piezoelectric Materials, Springer Singapore, Singapore, 2018, pp. 247–299 Search PubMed.
- M. A. Rafiq, M. N. Rafiq and K. Venkata Saravanan, Ceram. Int., 2015, 41, 11436–11444 CrossRef CAS.
- S. Liu, S. Xue, W. Zhang and J. Zhai, Ceram. Int., 2014, 40, 15633–15640 CrossRef CAS.
- Z. Hanani, D. Mezzane, M. Amjoud, S. Fourcade, A. G. Razumnaya, I. A. Luk'yanchuk and M. Gouné, Superlattices Microstruct., 2019, 127, 109–117 CrossRef CAS.
- H. Kaddoussi, A. Lahmar, Y. Gagou, B. Asbani, J. L. Dellis, G. Cordoyiannis, B. Allouche, H. Khemakhem, Z. Kutnjak and M. El Marssi, J. Alloys Compd., 2016, 667, 198–203 CrossRef CAS.
- H. Kaddoussi, A. Lahmar, Y. Gagou, B. Manoun, J. N. Chotard, J. L. Dellis, Z. Kutnjak, H. Khemakhem, B. Elouadi and M. El Marssi, J. Alloys Compd., 2017, 713, 164–179 CrossRef CAS.
- W. Liu and X. Ren, Phys. Rev. Lett., 2009, 103, 257602 CrossRef PubMed.
- M. D. Nguyen, E. P. Houwman, M. Dekkers, C. T. Q. Nguyen, H. N. Vu and G. Rijnders, APL Mater., 2016, 4, 080701 CrossRef.
- Z. Hanani, D. Mezzane, M. Amjoud, A. G. Razumnaya, S. Fourcade, Y. Gagou, K. Hoummada, M. El Marssi and M. Gouné, J. Mater. Sci.: Mater. Electron., 2019, 30, 6430–6438 CrossRef CAS.
- S. Patel, A. Chauhan and R. Vaish, Mater. Res. Express, 2015, 1, 045502 CrossRef.
- B. Gong, F. Huang, Y. Shao, L. Lei, L. Liu, J. Wang, S. Yan, X. Lu and J. Zhu, Phys. Status Solidi A, 2020, 217, 1900826 CrossRef CAS.
- Y. Tian, X. Chao, L. Wei, P. Liang and Z. Yang, J. Appl. Phys., 2013, 113, 184107 CrossRef.
- Z. Wang, X. Chen, X. Chao, J. Wang, P. Liang and Z. Yang, Ceram. Int., 2016, 42, 18037–18044 CrossRef CAS.
- H. Palneedi, M. Peddigari, G. T. Hwang, D. Y. Jeong and J. Ryu, Adv. Funct. Mater., 2018, 28, 1803665 CrossRef.
- S. Patel, D. Sharma, A. Singh and R. Vaish, J. Materiomics, 2016, 2, 75–86 CrossRef.
- T. M. Correia, M. McMillen, M. K. Rokosz, P. M. Weaver, J. M. Gregg, G. Viola and M. G. Cain, J. Am. Ceram. Soc., 2013, 96, 2699–2702 CrossRef CAS.
- M. Maraj, W. Wei, B. Peng and W. Sun, Materials, 2019, 12, 3641 CrossRef CAS PubMed.
- D. Zhan, Q. Xu, D. P. Huang, H. X. Liu, W. Chen and F. Zhang, J. Alloys Compd., 2016, 682, 594–600 CrossRef CAS.
- V. S. Puli, D. K. Pradhan, D. B. Chrisey, M. Tomozawa, G. L. Sharma, J. F. Scott and R. S. Katiyar, J. Mater. Sci., 2013, 48, 2151–2157 CrossRef CAS.
- K. Xu, P. Yang, W. Peng and L. Li, J. Alloys Compd., 2020, 829, 154516 CrossRef CAS.
- Z. Hanani, S. Merselmiz, A. Danine, N. Stein, D. Mezzane, M. Amjoud, M. Lahcini, Y. Gagou, M. Spreitzer, D. Vengust, Z. Kutnjak, M. El Marssi, I. A. Luk'yanchuk and M. Gouné, J. Adv. Ceram., 2020, 9, 210–219 CrossRef CAS.
- M. Ben Abdessalem, I. Kriaa, A. Aydi and N. Abdelmoula, Ceram. Int., 2018, 44, 13595–13601 CrossRef CAS.
- J. Shi, R. Zhu, X. Liu, B. Fang, N. Yuan, J. Ding and H. Luo, Materials, 2017, 10, 1093 CrossRef PubMed.
- J. Wang, T. Yang, S. Chen, G. Li, Q. Zhang and X. Yao, J. Alloys Compd., 2013, 550, 561–563 CrossRef CAS.
- M. Sanlialp, V. V. Shvartsman, M. Acosta, B. Dkhil and D. C. Lupascu, Appl. Phys. Lett., 2015, 106, 5 CrossRef.
- Y. Zhou, Q. Lin, W. Liu and D. Wang, RSC Adv., 2016, 6, 14084–14089 RSC.
- Z. Kutnjak, B. Rožič and R. Pirc, in Wiley Encyclopedia of Electrical and Electronics Engineering, John Wiley & Sons, Inc., Hoboken, NJ, USA, 2015, pp. 1–19 Search PubMed.
- K. S. Srikanth, S. Patel and R. Vaish, J. Aust. Ceram. Soc., 2018, 54, 439–450 CrossRef CAS.
- Z. Hanani, D. Mezzane, M. Amjoud, Y. Gagou, K. Hoummada, C. Perrin, A. G. Razumnaya, Z. Kutnjak, A. Bouzina, M. El Marssi, M. Gouné and B. Rožič, J. Mater. Sci.: Mater. Electron., 2020, 31, 10096–10104 CrossRef CAS.
- Z. Hanani, E.-H. Ablouh, M. Amjoud, D. Mezzane, S. Fourcade and M. Gouné, Ceram. Int., 2018, 44, 10997–11000 CrossRef CAS.
- Z. Hanani, E. H. Ablouh, M. 'barek Amjoud, D. Mezzane, S. Fourcade and M. Gouné, Ceram. Int., 2018, 44, 10997–11000 CrossRef CAS.
- J. P. Praveen, T. Karthik, A. R. James, E. Chandrakala, S. Asthana and D. Das, J. Eur. Ceram. Soc., 2015, 35, 1785–1798 CrossRef CAS.
- P. Mishra, Sonia and P. Kumar, J. Alloys Compd., 2012, 545, 210–215 CrossRef CAS.
- A. Frattini, A. Di Loreto, O. de Sanctis and E. Benavidez, Procedia Mater. Sci., 2012, 1, 359–365 CrossRef CAS.
- Z. M. Wang, K. Zhao, X. L. Guo, W. Sun, H. L. Jiang, X. Q. Han, X. T. Tao, Z. X. Cheng, H. Y. Zhao, H. Kimura, G. L. Yuan, J. Yin and Z. G. Liu, J. Mater. Chem. C, 2013, 1, 522–530 RSC.
- P. Mishra, Sonia and P. Kumar, Ceram. Int., 2014, 40, 14149–14157 CrossRef CAS.
- B. Li, M. C. Ehmke, J. E. Blendell and K. J. Bowman, J. Eur. Ceram. Soc., 2013, 33, 3037–3044 CrossRef CAS.
- L. Zhang, M. Zhang, L. Wang, C. Zhou, Z. Zhang, Y. Yao, L. Zhang, D. Xue, X. Lou and X. Ren, Appl. Phys. Lett., 2014, 105, 162908 CrossRef.
- C. H. Perry and D. B. Hall, Phys. Rev. Lett., 1965, 15, 700–702 CrossRef CAS.
- K. Jiang, P. Zhang, J. Zhang, G. Xu, W. Li, Z. Hu and J. Chu, RSC Adv., 2016, 6, 3159–3164 RSC.
- B. D. Begg, K. S. Finnie and E. R. Vance, J. Am. Ceram. Soc., 1996, 79, 2666–2672 CrossRef CAS.
- W. Y. Zeng and A. Anderson, J. Raman Spectrosc., 2001, 32, 69–71 CrossRef.
- X. Liu, M. Zhu, Z. Chen, B. Fang, J. Ding, X. Zhao, H. Xu and H. Luo, J. Alloys Compd., 2014, 613, 219–225 CrossRef CAS.
- N. Chaiyo, D. P. Cann and N. Vittayakorn, J. Mater. Sci., 2015, 50, 6171–6179 CrossRef CAS.
- W. Bai, D. Chen, P. Li, B. Shen, J. Zhai and Z. Ji, Ceram. Int., 2016, 42, 3429–3436 CrossRef CAS.
- X. W. Wang, B. H. Zhang, Y. C. Shi, Y. Y. Li, M. Manikandan, S. Y. Shang, J. Shang, Y. C. Hu and S. Q. Yin, J. Appl. Phys., 2020, 127, 074103 CrossRef CAS.
- Z. Wang, J. Wang, X. Chao, L. Wei, B. Yang, D. Wang and Z. Yang, J. Mater. Sci.: Mater. Electron., 2016, 27, 5047–5058 CrossRef CAS.
- W. Bai, D. Chen, J. Zhang, J. Zhong, M. Ding, B. Shen, J. Zhai and Z. Ji, Ceram. Int., 2016, 42, 3598–3608 CrossRef CAS.
- Y. Zhang, H. Sun and W. Chen, J. Phys. Chem. Solids, 2018, 114, 207–219 CrossRef CAS.
- S. Hunpratub, S. Maensiri and P. Chindaprasirt, Ceram. Int., 2014, 40, 13025–13031 CrossRef CAS.
- V. S. Puli, D. K. Pradhan, I. Coondoo, N. Panwar, S. Adireddy, S. Luo, R. S. Katiyar and D. B. Chrisey, J. Phys. D: Appl. Phys., 2019, 52, 255304 CrossRef CAS.
- G. Ramesh, M. S. Ramachandra Rao, V. Sivasubramanian and V. Subramanian, J. Alloys Compd., 2016, 663, 444–448 CrossRef CAS.
- L. Eric Cross, Ferroelectrics, 1987, 76, 241–267 CrossRef.
- S. Tsukada, Y. Akishige, T. H. Kim and S. Kojima, IOP Conf. Ser.: Mater. Sci. Eng., 2014, 54, 012005 Search PubMed.
- Q. Xu, T. Li, H. Hao, S. Zhang, Z. Wang, M. Cao, Z. Yao and H. Liu, J. Eur. Ceram. Soc., 2015, 35, 545–553 CrossRef CAS.
- P. Butnoi, S. Manotham, P. Jaita, C. Randorn and G. Rujijanagul, J. Eur. Ceram. Soc., 2018, 38, 3822–3832 CrossRef CAS.
- A. R. Jayakrishnan, K. V. Alex, A. Thomas, J. P. B. Silva, K. Kamakshi, N. Dabra, K. C. Sekhar, J. Agostinho Moreira and M. J. M. Gomes, Ceram. Int., 2019, 45, 5808–5818 CrossRef CAS.
- W. Cai, Q. Zhang, C. Zhou, R. Gao, S. Zhang, Z. Li, R. Xu, G. Chen, X. Deng, Z. Wang and C. Fu, J. Mater. Sci.: Mater. Electron., 2020, 31(12), 9167–9175 CrossRef CAS.
- D. Zhan, Q. Xu, D. P. Huang, H. X. Liu, W. Chen and F. Zhang, J. Phys. Chem. Solids, 2018, 114, 220–227 CrossRef CAS.
- S. Smail, M. Benyoussef, K. Taïbi, N. Bensemma, B. Manoun, M. El Marssi and A. Lahmar, Mater. Chem. Phys., 2020, 252, 123462 CrossRef CAS.
- S. Merselmiz, Z. Hanani, D. Mezzane, M. Spreitzer, A. Bradeško, D. Fabijan, D. Vengust, M. B. Amjoud, L. Hajji, Z. Abkhar, A. G. Razumnaya, B. Rožič, I. A. Luk’yanchuk and Z. Kutnjak, Ceram. Int., 2020, 46(15), 23867–23876 CrossRef.
- Y. Lin, D. Li, M. Zhang, S. Zhan, Y. Yang, H. Yang and Q. Yuan, ACS Appl. Mater. Interfaces, 2019, 11, 36824–36830 CrossRef CAS PubMed.
- T. Badapanda, S. Chaterjee, A. Mishra, R. Ranjan and S. Anwar, Phys. B, 2017, 521, 264–269 CrossRef CAS.
- Z. Liu, X. Chen, W. Peng, C. Xu, X. Dong, F. Cao and G. Wang, Appl. Phys. Lett., 2015, 106, 262901 CrossRef.
- R. A. Malik, A. Hussain, A. Maqbool, A. Zaman, T. K. Song, W. J. Kim and M. H. Kim, J. Alloys Compd., 2016, 682, 302–310 CrossRef CAS.
- B. Wang, L. Luo, X. Jiang, W. Li and H. Chen, J. Alloys Compd., 2014, 585, 14–18 CrossRef CAS.
- Z. Sun, Z. Wang, Y. Tian, G. Wang, W. Wang, M. Yang, X. Wang, F. Zhang and Y. Pu, Adv. Electron. Mater., 2020, 6, 1900698 CrossRef CAS.
- X. Wang, J. Wu, B. Dkhil, C. Zhao, T. Li, W. Li and X. Lou, RSC Adv., 2017, 7, 5813–5820 RSC.
- X. Q. Liu, T. T. Chen, Y. J. Wu and X. M. Chen, J. Am. Ceram. Soc., 2013, 96, 1021–1023 CrossRef CAS.
- S. Patel, A. Chauhan and R. Vaish, Phase Transitions, 2016, 89, 1019–1028 CrossRef CAS.
- R. Pirc, Z. Kutnjak, R. Blinc and Q. M. Zhang, J. Appl. Phys., 2011, 110, 074113 CrossRef.
- B. Rožič, M. Kosec, H. Uršič, J. Holc, B. Malič, Q. M. Zhang, R. Blinc, R. Pirc and Z. Kutnjak, J. Appl. Phys., 2011, 110, 064118 CrossRef.
- Y. Bai, X. Han and L. Qiao, Appl. Phys. Lett., 2013, 102, 1–5 Search PubMed.
- G. Singh, V. S. Tiwari and P. K. Gupta, Appl. Phys. Lett., 2013, 103, 202903 CrossRef.
- S. Patel and R. Vaish, Phase Transitions, 2017, 90, 465–474 CrossRef CAS.
- X. Zhang, L. Wu, S. Gao, J. Q. Liu, B. Xu, Y. D. Xia, J. Yin and Z. G. Liu, AIP Adv., 2015, 5, 047134 CrossRef.
- G. Suchaneck, O. Pakhomov and G. Gerlach, in Refrigeration, InTech, 2017 Search PubMed.
- Y. Zhao, X. Q. Liu, S. Y. Wu and X. M. Chen, J. Electroceram., 2019, 43, 106–116 CrossRef CAS.
- W. P. Cao, W. L. Li, X. F. Dai, T. D. Zhang, J. Sheng, Y. F. Hou and W. D. Fei, J. Eur. Ceram. Soc., 2016, 36, 593–600 CrossRef CAS.
- X. S. Qian, H. J. Ye, Y. T. Zhang, H. Gu, X. Li, C. A. Randall and Q. M. Zhang, Adv. Funct. Mater., 2014, 24, 1300–1305 CrossRef CAS.
- S. G. Lu and Q. Zhang, Adv. Mater., 2009, 21, 1983–1987 CrossRef CAS.
- A. Kumar, A. Thakre, D. Y. Jeong and J. Ryu, J. Mater. Chem. C, 2019, 7, 6836–6859 RSC.
- R. Kumar and S. Singh, J. Alloys Compd., 2018, 764, 289–294 CrossRef CAS.
- Y. Zhao, X. Hao and Q. Zhang, Ceram. Int., 2016, 42, 1679–1687 CrossRef CAS.
- R. Kumar, A. Kumar and S. Singh, Sustainable Energy Fuels, 2018, 2, 2698–2704 RSC.
- R. Kumar and S. Singh, Sci. Rep., 2018, 8, 3186 CrossRef PubMed.
- R. Kumar, D. Khurana, A. kumar and S. Singh, Ceram. Int., 2018, 44, 20845–20850 CrossRef CAS.
- B. Peng, Q. Zhang, B. Gang, G. J. T. Leighton, C. Shaw, S. J. Milne, B. Zou, W. Sun, H. Huang and Z. Wang, Energy Environ. Sci., 2019, 12, 1708–1717 RSC.
- E. Defay, S. Crossley, S. Kar-Narayan, X. Moya and N. D. Mathur, Adv. Mater., 2013, 25, 3337–3342 CrossRef CAS PubMed.
- Y. Zhao, X. Hao and Q. Zhang, ACS Appl. Mater. Interfaces, 2014, 6, 11633–11639 CrossRef CAS PubMed.
- X. Hao, Y. Zhao and Q. Zhang, J. Phys. Chem. C, 2015, 119, 18877–18885 CrossRef CAS.
- H. Gao, X. Hao, Q. Zhang, S. An and L. B. Kong, J. Mater. Sci.: Mater. Electron., 2016, 27, 10309–10319 CrossRef CAS.
| This journal is © The Royal Society of Chemistry 2020 |

