 Open Access Article
New nanosized Gd–Ho–Sm doped M-type strontium hexaferrite for water treatment application: experimental and theoretical investigations
M. Elansary a,
M. Belaiche
 *a,
C. Ahmani Ferdia,
E. Iffer
 a and
I. Bsoulb
aNanomaterials and Nanotechnology Unit, E. N. S Rabat, Energy Research Centre, Faculty of Sciences, Mohammed V University, B. P. 5118 Takaddoum Rabat, Morocco. E-mail: med.belaiche@um5.ac.ma
bPhysics Department, Al al-Bayt University, Mafraq 13040, Jordan
First published on 2nd July 2020
Abstract
In this paper, rare-earth doped M-type strontium hexaferrite magnetic nanoparticles SrHoxGdySmzFe(12−(x+z+y))O19 (x = y = z = 0.01) have been prepared by the sol–gel combustion method for the first time. The properties of the material were investigated using XRD, FTIR spectroscopy, Raman spectroscopy, SEM, UV-Vis spectroscopy, and VSM. X-ray analysis revealed that a magnetic single-phase was formed with a crystallite average size of 49 nm. FTIR spectra confirmed the formation of the structure of the hexaferrite phase. Raman analysis confirmed the formation of all crystallographic hexaferrite sites. A shift in the octahedral site frequencies and a significant shift were observed at site 12k and 2a, indicating that the doping elements occupied these sites. The SEM analysis showed that the particles were different in shape and slightly agglomerated. The EDS result confirmed the purity of the sample. The calculated band gap from the UV-Vis NIR spectroscopy spectra of the sample was 1.62 eV. The magnetic analysis of the sample material at room temperature revealed a coercivity of 5257.63 Oe, saturation magnetization of 67.72 emu g−1, remanence ratio of 0.52, a maximum magnetic energy product of 1.06 MGOe and Curie temperature of Tc = 765 K. First-principles calculations were conducted on multiple configurations of SrFe12−xXxO19 with x = 0, 0.5 and X = Sm, Gd, Ho. The site preference of each doping element was determined, and the effect of the doping on the structural, electronic, and magnetic properties of the compound was studied. The magnetic properties of this rare earth (Gd, Ho, Sm) doped strontium hexaferrite indicated that this compound could be used in both permanent magnets and water treatment application.
1. Introduction
Nanoscience has been a challenge in past years. It has allowed the design and prediction of the construction of sophisticated materials and devices by controlling and optimizing the functionality of matter at the nanometer scale. At this scale, new properties (physical, chemical and biological) can emerge that are fundamentally different from the properties in the bulk state. The field of nanoscience consists of innovating, modulating, shaping, and creating new nanostructures, and also discovering, determining, and understanding their new properties with a view to develop new, more useful, and complex functional devices. The challenge is to create a synergy between properties to have multifunctional devices. This is the introduction to a larger extent of the modern integrated interdisciplinary science currently known as nanotechnology, which is constantly developing.Hexaferrite is still by far the most relevant material for practical applications, and currently constitutes the vast majority of hard ferrite production. They are extremely interesting materials for innumerable applications. Of particular interest is the strontium hexaferrite, which has attracted the interest of many researchers owing to their new electromagnetic properties, and their use in a wide range of applications. This is because it is characterized by a high saturation magnetization, a large coercive force, high Curie temperature, large magnetocrystalline anisotropy, high corrosion resistance and chemical stability.1–3 Due to the qualities listed previously and its low cost, strontium hexaferrite is considered to be a favorite candidate for permanent magnets used for industrial applications that are environmentally friendly, such as generator rotors used in electric vehicles4 or wind energy.5 Such specific properties of these Sr-hexaferrite nanomaterials give them new physical and chemical functionalities for magnetic water treatment.6,7 Scientists are more interested in the benefits of magnetically treated water in ensuring the quantity of seeds needed for planting, shortening the growth phase, reducing plant diseases, and providing water for irrigation. The current studies in this field are focused on understanding this phenomenon since the physical pathways are efficient and increase efficiency with respect to the environment.8 In addition, strontium hexaferrite is also used in bonded magnets, in various microwave devices (isolator, circulators, filters, phase shifters) and magnetic and magneto-optic recorders of information with high density.9–12
Ferrite magnets may not be as powerful as rare earth magnets (SmCo and NdFeB) and rare earth alloys due to their desired magnetic properties. However, due to the price volatility and supply-chain vulnerability of rare earth materials, researchers all over the world are making an effort to overcome the problem of producing novel magnetic materials with free rare-earth content akin to rare earth magnets.13 Strontium hexaferrite (SrM) has the advantage of a high Curie temperature of 733 K, compared to commercial NdFeB (583 K).14 They also remain the most widely used magnets due to their low production cost.
For application in magnetic water treatment, a high remanence, high coercivity, and large energy product (BH)max are required. To obtain these properties, a small grain size, growth anisotropy, and high-density ferrite are imperative. The upgrading of the energy product (BH)max is more delicate than the improvement of coercivity. A higher density ferrite with uniform grain distribution can improve the magnetic properties. However, researchers are now attempting to explore the magnetic properties by changing the stoichiometry, chemical purity, and the processing conditions of the material. Substitutions of the Sr2+ and Fe3+ cations are the best way to find productive compositions for various applications. Previous works have studied the substitution of Fe3+ ions of strontium hexaferrite by different cations, such as Ho3+, Ti4+, Al3+, Cr3+, and Ga3+.15–19 Some are substituted by other elements, such as La3+, Nd3+, Sm3+, Pr3+, and Gd3+.20–24 They have been carried out to obtain the appropriate magnetic properties. Afterward, the combined substitution (such as Mn–Sn–Ti, Zn–Nb, La–Cu25–27) has been achieved successfully in M-type hexagonal ferrites using different synthesis methods. The main techniques of preparing strontium hexaferrite include the sol–gel process,28 co-precipitation method,29 self-propagation,30 the mechanical alloying methods,31 microwave,32 hydrothermal,33 and ultrasound-assisted synthesis.34 In this study, the sol–gel method was used to synthesize Sr hexaferrite. It is an effective process to produce ferrites due to its low cost, and the ability to produce fine and homogeneous crystalline powders without any risk of contamination.35
The aim of this work is focused on the enhancement of the magnetic properties of SrFe12O19, especially the energy product (BH)max, to be applied in magnetic water treatment. In this work, Sr(HoxGdySmz)Fe(12−(x+z+y))O19 (x = y = z = 0.01) was prepared by doping with small amounts of Sm3+, Gd3+, and Ho3+ ions simultaneously into SrFe12O19, using the sol–gel method. To our knowledge, no similar work has been reported.
The magnetic properties of Sr(HoxGdySmz)Fe(12−(x+z+y))O19 (x = y = z = 0.01) (labeled RE.SrM) were investigated and the substitution mechanism of Sm3+, Gd3+ and Ho3+ ions were discussed in detail. First-principles calculations were conducted on the different configurations of SrFe12−xXxO19 with x = 0, 0.5 and X = Sm, Gd, Ho to shed light on the effects of doping the M-type strontium hexaferrite with the rare-earth elements Sm, Gd, and Ho on its structural, electronic and magnetic properties. This work aims to provide new ideas on the elaboration of magnetic samples suitable for specific applications, and to explain the effect of rare-earth doping on the magnetic properties of SrFe12O19.
2. Experimental and computational details
2.1. Computational details
The calculations for the structural optimization were performed using density functional theory with projector-augmented wave (PAW) potentials, as implemented in the Quantum Espresso plane-waves density functional theory package.36 The exchange–correlation potential was approximated by the Perdew–Burke–Ernzerhof Generalized Gradient Approximation (GGA).37 A 5 × 5 × 1 Monkhorst–Pack k-mesh and a 612 eV energy cut-off were used.38 The atomic positions, cell shape and cell volume of all compounds were fully relaxed using the Broyden–Fletcher–Goldfarb–Shanno (BFGS) algorithm until the forces were below 1 mRy per bohr (Ry: Rydberg). The obtained cell parameters and atomic positions were used to calculate their total energies, as well as their electronic and magnetic properties, using the Wien2k package.39 The ion-electron interaction was described with the Full-Potential Linear Augmented Plane Wave (FP-LAPW) method. The exchange–correlation potential was approximated by the Perdew–Burke–Ernzerhof Generalized Gradient Approximation (GGA).37 Fe has been assigned a Ueff parameter (Ueff = U − J) to correct for the self-interaction error present in GGA.40 The Ueff parameter was applied on the Fe 3d electrons in all of the GGA+U calculations, and the used values for the Ueff parameter were 3, 4 and 6 eV. The Muffin Tin Radii (MTR) were chosen to ensure a nearly touching sphere, and to minimize the interstitial space. The plane-wave cut-off was defined by Rkmax = 6.5. The Brillouin zone (BZ) was sampled with at least 1900 k-points/(number of atoms in the unit cell). The Fermi energy was calculated using a temperature-broadening scheme, with a broadening parameter of 0.002 Ry. The energy threshold between the core and the valence states was set at −6.81 eV. The convergence criteria for energy were chosen to be 10−5 Ry. All calculations were spin-polarized according to the following ground state ferrimagnetic ordering of the Fe spins: [12k(↑), 2a(↑), 2b(↑), 4f1(↓), 4f2(↓)]. ((↑) indicates spin up and (↓) indicates spin down).2.2. Experimental details
The series of M-type Sr hexaferrite Sr(HoxGdySmz)Fe(12−(x+z+y))O19 (x = y = z = 0.01) (RE.SrM) were prepared by the sol–gel combustion method. The chemicals strontium nitrate, Sr(NO3)2 (≥98.0% pure, Sigma-Aldrich), ferric nitrate nonahydrate Fe(NO3)3·9H2O, samarium nitrate hexahydrate Sm(NO3)3·6H2O (≥99.0% pure, Sigma-Aldrich), gadolinium nitrate hexahydrate Gd(NO3)3·6H2O (≥99.0% pure, Sigma-Aldrich), holmium nitrate pentahydrate Ho(NO3)3·5H2O (≥99.0% pure, Sigma-Aldrich) and citric acid (C6H8O7) were used as raw materials to prepare the (RE.SrM) nanoparticles. The appropriate amounts of nitrates were dissolved in distilled water under magnetic stirring for 30 minutes, and then citric acid was dissolved in it with a molar ratio of nitrates to citric acid of 1![[thin space (1/6-em)]](https://www.rsc.org/images/entities/char_2009.gif) :
:![[thin space (1/6-em)]](https://www.rsc.org/images/entities/char_2009.gif) 2. Ammonia solution was added drop-wise into the solution to adjust the pH values at 1.5, 4 and 7, while stirring at 70 °C continuously until the solution changed into the gel. When the gel formation started, we heated the gel at 200 °C until we acquired a fluffy powder. Then, the powder was ground using an agate mortar and pestle. After grinding, the powder was placed overnight in an oven to dry it completely at 100 °C. Then, the powder was ground once again. Finally, the homogenized powder was then calcined at 700 °C, 800 °C, 900 °C and 1000 °C.
2. Ammonia solution was added drop-wise into the solution to adjust the pH values at 1.5, 4 and 7, while stirring at 70 °C continuously until the solution changed into the gel. When the gel formation started, we heated the gel at 200 °C until we acquired a fluffy powder. Then, the powder was ground using an agate mortar and pestle. After grinding, the powder was placed overnight in an oven to dry it completely at 100 °C. Then, the powder was ground once again. Finally, the homogenized powder was then calcined at 700 °C, 800 °C, 900 °C and 1000 °C.
3. Results and discussion
3.1. Phase identification analysis
Fig. 1 shows the XRD pattern of the samples sintered at different temperatures and pH values. The XRD patterns reveal single-phase M-type Sr hexaferrite, which is matched with the ICDD file number 96-100-8857 and confirm the formation of crystalline structures. The diffraction peaks are mainly indexed to the M-type Sr hexaferrite phase. Furthermore, a small additional secondary phase (Fe2O3) was detected at pH = 1.5 (700 °C, 800 °C, 900 °C), pH = 4 (700 °C) and pH = 7 (700 °C). The XRD patterns clearly show that the peak intensities of Fe2O3 disappear at 1000 °C for all different pH values. This can be explained by the nucleation, growth of grains and a complete crystallization of the M-type Sr hexaferrite. No diffraction peaks from any second impurity phases were observed at 1000 °C for the different pH values. This indicates that the M-type Sr hexaferrite formation is promoted by increasing the temperature and pH. Therefore, the temperature value of 1000 °C and pH = 7 were selected as the optimum conditions.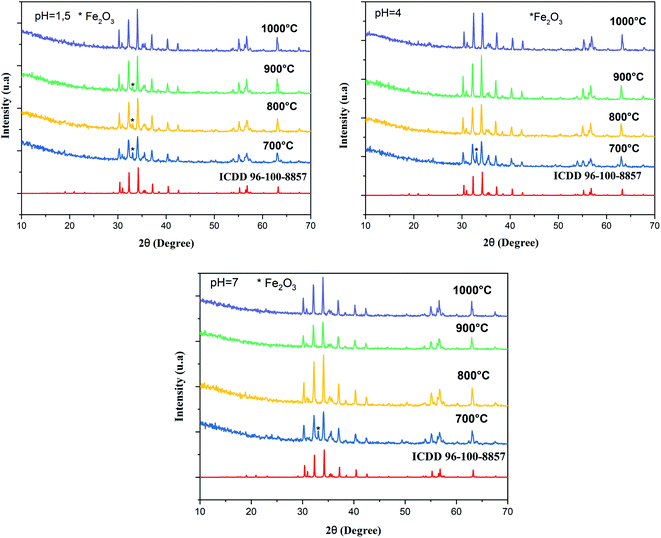 | ||
| Fig. 1 Indexed X-ray diffraction pattern of SrFe12O19 particles at different pH values and different calcination temperatures. | ||
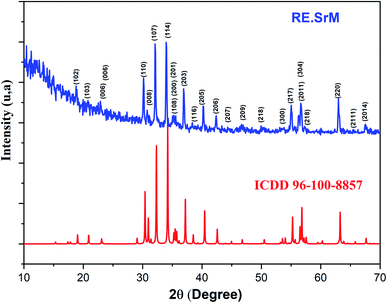
Fig. 2 shows the XRD patterns of the (RE.SrM) nanoparticles calcined at 1000 °C and with a pH value of 7. The main peaks of the M-type Sr hexaferrite were at 2θ = 30.40, 31.04, 32.38, 34.24, 37.20, 38.57, 40.48, 42.66, 55.32 and 63.28, revealing the typical hexagonal planes of (110), (008), (107), (114), (203), (116), (205), (206), (214), and (220), respectively. The spectrum confirms the high crystallization of the sample, and reveals that the Sm3+, Gd3+ and Ho3+ ions go into the lattice of the type M hexaferrite.
All XRD patterns of all samples have been analyzed employing Rietveld refinement with the help of the FullProf Suite software. During the refinement, the zero correction, scale factor, atomic position, lattice parameters, line widths, and thermal parameters were refined simultaneously. The shape of the peaks was described by the pseudo-Voigt function, and the background was expressed by a linear interpolation between a set of selected background points. The fitting was judged by the goodness of fit, along with the low values of reliable factors (χ2) as included in Table 1. It could be seen that the profiles for the observed and calculated ones are perfectly matched with each other and all the experimental peaks.
| pH | Calcination temperature (°C) | a (Å) | c (Å) | Cell volume (Å3) | c/a | Crystallite size (nm) | Density (g cm−3) | χ2 | |
|---|---|---|---|---|---|---|---|---|---|
| SrFe12O19 | 1.5 | 700 | 5.880 | 23.065 | 690.82 | 3.922 | 33 | 5.104 | 1.19 |
| 800 | 5.878 | 23.058 | 690.13 | 3.921 | 43 | 5.105 | 1.29 | ||
| 900 | 5.875 | 23.042 | 689.08 | 3.921 | 54 | 5.117 | 1.43 | ||
| 1000 | 5.877 | 23.038 | 689.02 | 3.920 | 62 | 5.117 | 1.29 | ||
| 4 | 700 | 5.879 | 23.057 | 690.12 | 3.921 | 33 | 5.109 | 1.38 | |
| 800 | 5.879 | 23.052 | 690.13 | 3.920 | 42 | 5.109 | 1.29 | ||
| 900 | 5.878 | 23.039 | 689.38 | 3.919 | 47 | 5.115 | 1.33 | ||
| 1000 | 5.883 | 23.053 | 690.97 | 3.918 | 48 | 5.103 | 1.43 | ||
| 7 | 700 | 5.878 | 23.047 | 689.57 | 3.921 | 35 | 5.113 | 1.29 | |
| 800 | 5.877 | 23.035 | 688.98 | 3.919 | 45 | 5.117 | 1.28 | ||
| 900 | 5.866 | 22.998 | 685.47 | 3.920 | 44 | 5.144 | 1.33 | ||
| SrM | 7 | 1000 | 5.876 | 23.035 | 688.89 | 3.920 | 53 | 5.118 | 1.29 |
| RE.SrM | 1000 | 5.872 | 23.023 | 687.84 | 3.91 | 49 | 5.126 | 1.26 |
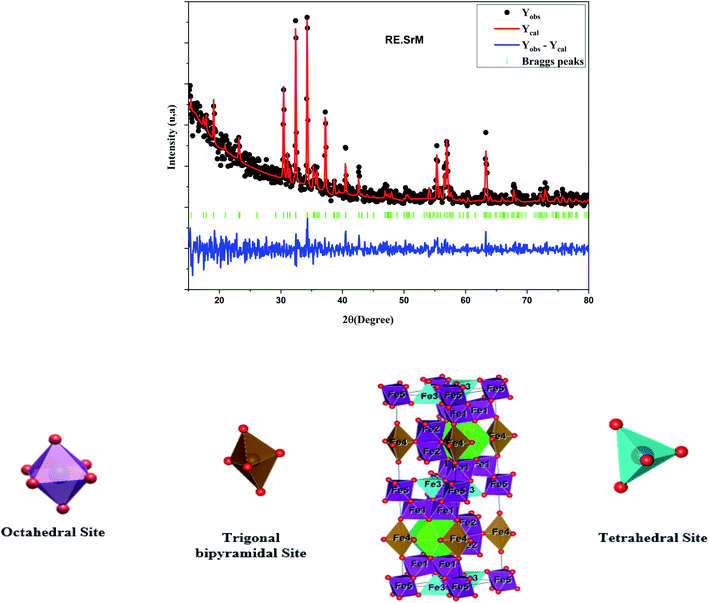
The Rietveld refinement of the room temperature powder XRD patterns of all hexaferrite samples is shown in Fig. 3, all peaks in the XRD patterns were indexed to M-type hexagonal structure with space group P63/mmc. The refined lattice parameter values and cell volume (v) of the intrinsic M-type Sr hexaferrite are given in Table 1. The lattice constant values (a) and (c) are found in the range of (a = 5.8665–5.8807 Å) and (c = 22.9985–23.0657 Å), respectively. These values are comparable to the standard values (a = b = 5.8862 Å) (c = 23.1370 Å),41 and in good agreement with the values found by Azis et al.42 The volume of the cells was found in the range of (V = 688.9894–690.8272 Å3) for all sintered samples. The c/a values vary from 3.9188 to 3.9222. These values are comparable to the standard value (3.9800) of the M-type hexagonal structure.43
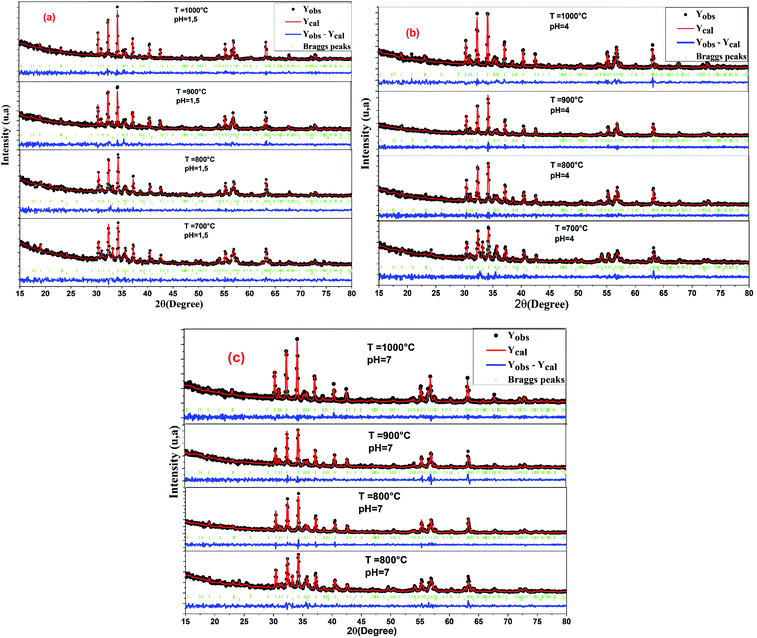 | ||
| Fig. 3 Rietveld refinement patterns of all un-doped samples of SrFe12O19, (a) pH = 1.5, (b) pH = 4, and (c) pH = 7. | ||
As shown in Fig. 4 of the Rietveld refined XRD pattern of (RE.SrM), narrow and well-defined peaks corresponding to the M-type Sr hexaferrite were observed in the samples, indicating the formation of the highly crystalline M-type Sr hexaferrite phase.
The structural parameters obtained from the Rietveld refinement of (RE.SrM) are given in Table 1. The obtained (a) and (c) lattice constants are 5.8734 Å and 23.0236 Å for (RE.SrM), respectively. These results confirm that no structural change occurs in the M-type Sr hexaferrite upon doping with Sm3+, Gd3+, and Ho3+ ions. On the other hand, from Table 1, it can be noticed that the lattice parameter remains almost constant and c has been decreased compared to the undoped M-type Sr hexaferrite. Generally, the insertion of higher ionic radii elements in the host lattice swells the crystal lattice. However, the opposite behavior has been observed in the present work. Such behaviour can be attributed to many factors. In particular, the low solubility of the rare earth substitution in strontium hexaferrite can induce the formation of secondary phases. But, in the present case, no secondary phase has been observed, and the case to be excluded as a pure single phase was obtained. Otherwise, this anomaly can only be attributed to the bonding energy and exchange interaction. In fact, the introduction of small quantities of larger rare earth elements can induce strong interactions between neighboring atoms, which leads to a stress of the crystal lattice resulting from a cationic redistribution of ions in the host lattice. Consequently, the crystal lattice reduces in size and the lattice parameters decrease. A similar behavior has been observed in the literature.44,45 The presence of 4f electrons with 5d electrons in the lanthanides leads to stronger Colombian attractions that form a strong oxygen–lanthanide (R–O) bond in the crystal structure. Transition metal ions have only 5d electrons. Therefore, they have weaker transition metal–oxygen (M–O) bonds in the crystal structure. In the RE-doped hexaferrite, the binding energy of the oxygen–lanthanide octahedron (RO6) is higher than the oxygen-cation octahedron of the transition metal (MO6).46,47 As a result, the crystal lattice of the RE-substituted strontium hexaferrite can contract so that the values of a, c and the V-cell decrease as observed.
Indeed, the refined ionic positions in the doped sample exhibited shifts relative to the undoped sample at the sites (12k) for Fe3+, and also in the (6h) and (12k) sites for O2− as shown for both in Table 2. These displacements are due to the Gd3+, Ho3+, and Sm3+ ions that are forced to occupy the octahedral sites, owing to their preferred site energy. In addition, the length of the Fe–O bond at the octahedral and tetrahedral sites is reduced relative to the average length of the bond at the bipyramidal sites. This indicates that the bond length at the sites is decreased due to the introduction of small quantities of rare-earth materials into the hexaferrite. This decrease is due to the improvement in the exchange interactions. It should also be noted that a significant deviation of the binding angles was observed in the doped sample compared to the undoped sample (Table 3). The details of this deviation will be discussed in the magnetic discussion section.
| Atom | Site | x/a | y/b | z/c | |||
|---|---|---|---|---|---|---|---|
| SrM | RE.SrM | SrM | RE.SrM | SrM | RE.SrM | ||
| Sr | 2d | 0.66667 | 0.66667 | 0.33333 | 0.33333 | 0.25000 | 0.25000 |
| Fe1 | 2a | 0.00000 | 0.00000 | 0.00000 | 0.00000 | 0.00000 | 0.00000 |
| Fe2 | 2b | 0.00000 | 0.00000 | 0.00000 | 0.00000 | 0.25000 | 0.25000 |
| Fe3 | 4f1 | 0.33333 | 0.33333 | 0.66667 | 0.66667 | 0.02710 | 0.02000 |
| Fe4 | 4f2 | 0.33333 | 0.33333 | 0.66667 | 0.66667 | 0.30890 | 0.30770 |
| Fe5 | 12k | 0.17200 | 0.16667 | 0.34400 | 0.33333 | 0.88950 | 0.89014 |
| O1 | 4e | 0.00000 | 0.00000 | 0.00000 | 0.00000 | 0.16500 | 0.15350 |
| O2 | 4f | 0.33333 | 0.33333 | 0.66667 | 0.66667 | 0.93500 | 0.94000 |
| O3 | 6h | 0.18600 | 0.21198 | 0.37100 | 0.42389 | 0.25000 | 0.25000 |
| O4 | 12k | 0.16000 | 0.18650 | 0.84000 | 0.81350 | 0.05600 | 0.05339 |
| O5 | 12k | 0.48900 | 1.43274 | −0.02200 | 1.86548 | 0.15350 | 0.15000 |
| Site | Bond type | Bond length (Å) | |
|---|---|---|---|
| SrM | RE.SrM | ||
| Fe1 (2a) | Fe1–O4 | 2.14 | 2.26 |
| Fe2 (2b) | Fe2–O1 | 1.93 | 2.22 |
| Fe2–O3 | 1.19 | 2.17 | |
| Fe3 (4f1) | Fe3–O2 | 2.23 | 1.84 |
| Fe3–O4 | 1.84 | 1.68 | |
| Fe4 (4f2) | Fe4–O3 | 2.00 | 1.80 |
| Fe4–O5 | 1.87 | 1.40 | |
| Fe5 (12k) | Fe5–O1 | 2.16 | 1.96 |
| Fe5–O2 | 1.90 | 2.04 | |
| Fe5–O4 | 2.11 | 2.22 | |
| Fe5–O5 | 1.97 | 1.93 | |
| Sr–O3 | 2.91 | 2.97 | |
| Fe4–Fe4 | 2.59 | 2.66 | |
| Fe5–Fe5 | 2.83 | 2.93 | |
| Bond type | Bond angles | |
|---|---|---|
| SrM | RE.SrM | |
| Fe1–O4–Fe3 | 120.19 | 119.83 |
| Fe1–O4–Fe5 | 93.88 | 85.51 |
| Fe2–O1–Fe5 | 126.00 | 120.65 |
| Fe2–O3–Fe4 | 139.48 | 132.91 |
| Fe3–O2–Fe5 | 120.84 | 124.09 |
| Fe4–O3–Fe4 | 81.04 | 94.19 |
| Fe4–O5–Fe5 | 132.18 | 138.91 |
| Fe5–O2–Fe5 | 96.06 | 91.63 |
| Fe5–O5–Fe5 | 92.34 | 87.75 |
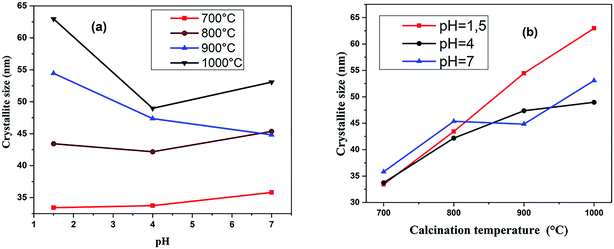
The effect of the pH value and calcination temperature on the crystallite sizes was studied. The crystallite sizes of the samples were calculated using the Debye–Scherrer formula:48
 | (1) |
The crystallite sizes of (RE.SrM) decreased compared to that of the (SrM). This decrease in crystallite size can be explained by the high bond energy of Sm3+–O2−, Gd3+–O2− and Ho3+–O2− as compared to that of Fe3+–O2−. Therefore, more energy is required for the formation of the bonds of rare earth elements in the M-type Sr hexaferrite. This required energy was obtained at the expense of crystallization, and consequently caused a hindrance in the growth of the crystallite of the M-type Sr hexaferrite.50 This may be explained on the basis of ionic radii or lattice contraction. The reduction in the crystallite size probably decreases the crystal axis ratio. These results also suggest that the Sm3+, Gd3+, and Ho3+ have systematically entered the host lattice in place of Fe3+.
3.2. FT-IR spectrum
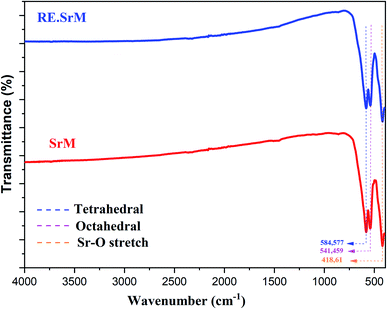
FTIR spectroscopy makes it possible to predict the presence of the different bonds in a crystal. FTIR analysis was performed at room temperature in the range of 400–4000 cm−1, and is represented in Fig. 6. The frequency absorption bands at 584.82 cm−1 and 422.71 cm−1 correspond to the tetrahedral and octahedral Fe3+–O stretching vibrations, respectively, and the characteristic peaks at 539.86 cm−1 are associated with the Sr–O stretching vibration band.51 FTIR analysis of the samples confirmed the formation of the M-type Sr hexaferrite. No parasitic bands in all samples were observed. Thus, we can make a preliminary deduction that the added low concentration of Sm3+, Gd3+ and Ho3+ ions did not alter the intrinsic structure of the M-type Sr hexaferrite, which is in good agreement with the XRD results.3.3. Raman analysis
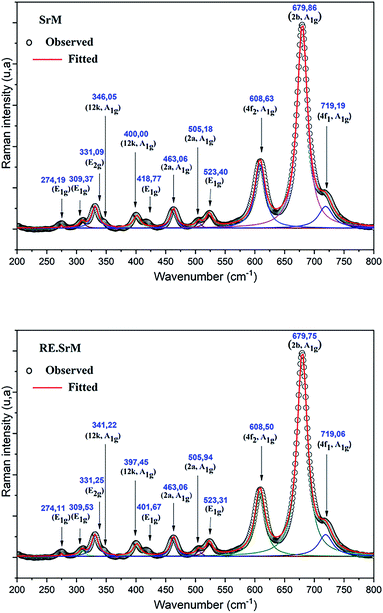
The Raman spectra can give us more information on the dynamics of the crystal structure. The peaks in the Raman spectra are mainly related to the vibration of the atomic bond. Therefore, a small amount of impurities can be detected. In parallel, Raman spectroscopy was used to study the composition and homogeneity of the phases in the pure and rare-earth doped SrFe12O19 system. The Raman spectra are shown in Fig. 7. Raman spectral analysis of the pure and rare-earth doped strontium hexaferrite were carried out by comparing the observed results with the selection rules and mode assignments discussed by Kreisel et al.52 From the literature, it was reported that 42 Raman-active modes (11A1g + 14E1g + 17E2g) and 30 IR active modes (13A2u + 17E1u) are expected for the hexaferrite system. The Raman spectra were determined at room temperature. The hexagonal structure of the M-type strontium hexaferrite was built up of five layers: 3 cubic blocks of S and S* with a spinel structure, and 2 hexagonal blocks R and R* containing the Sr2+ ion. These five layers form one molecule, and two molecules form one unit cell. The 24 Fe3+ ions are distributed over five different crystallographic sites, three octahedral positions (12k, 2a and 4f2), one tetrahedral position (4f1) and one trigonal-bipyramidal (2b) position, respectively. The Raman spectra of the doped and undoped samples are shown in Fig. 7, and all have the strongest peak at approximately 679 cm−1, which is attributed to the motions (A1g) of the bipyramidal group of the Fe–O ions (site 2b).52 A weak peak was observed at the frequency of 719 cm−1, which can be attributed to the movement (A1g) of the Fe–O ions at the 4f1 tetrahedral sites. The 608 cm−1 and 523 cm−1 bands are due to the (A1g) and (E2g) vibration modes of the Fe–O bonds at the 4f2 octahedral site. The 505 cm−1 and 463 cm−1 bands are due to the A1g vibration modes of the Fe–O bonds at the 2a octahedral site. In addition to the above peaks, several distinct peaks are observed for the two samples corresponding to the frequencies of 317, 336, 415, 466 and 529 cm−1. They are comparable to the Raman spectra reported by Zhao et al., in samples of BaFe12+xO19+1.5x.53 The bands in the 211 to 529 cm−1 regions can be attributed to the vibration of all M–O (M = Fe, Gd, Ho, Sm) bonds in various octahedral positions, such as 12k, 2a, and 4f2 sites. The measured Raman spectra of the two samples show that, other than the broadening of various bands, no new band was observed. This confirms that the samples are in a single-phase form.In order to better correlate the Raman measurements with the cationic structure and distribution, the volumes of the different sites in the hexagonal lattice were determined. From the data refined by Rietveld, the available site volumes were calculated for both compounds. Table 4 shows the volumes available for the corresponding sites. From the volume values, it can be concluded as a first approximation that in the case of substitution, it seems that the 4f2, 4f1 and 2b sites are the most improbable to be substituted with Gd, Ho, and Sm. These results are in very good agreement with the Raman measurements. In fact, the sites undergoing a significant shift are the two sites 12k and 2a (see table: Raman shift). So the most probable sites to be substituted by Gd3+, Ho3+, and Sm3+ are the two sites 12k and 2a. The larger volume of available sites certainly plays a major role in site preference. However, the substitution energy may also contribute to site preference. In this context, using the present ab initio calculations with the GGA+U method (ample details of the calculations are elucidated in the last paragraph), the substitution energies in the 12k, 2a and 4f2 sites of the rare-earth elements Gd, Ho, Sm were calculated for Ueff = 3, 4, 6. From the obtained results, it can be seen that the minimum energy required for an Sm atom is to substitute Fe atoms in a 2a site, and the 12k site is the preferable site to be substituted with Gd and Ho atoms.
| Octahedral sites | Tetrahedral site | Tirgonal bipyramodal site | ||||
|---|---|---|---|---|---|---|
| 12k | 2a | 4f2 | 4f1 | 2b | ||
| SrM | Volume (Å)3 | 11.3865 | 11.8511 | 9.197 | 3.7566 | 6.9056 |
| Average bond length (Å) | 1.9864 | 2.0775 | 1.9500 | 1.9446 | 1.9056 | |
| (RE.SrM) | Volume (Å)3 | 10.5585 | 9.9155 | 8.5612 | 3.9322 | 8.9451 |
| Average bond length (Å) | 2.0051 | 1.9595 | 1.8612 | 1.9734 | 2.1824 | |
| M–Sr theory | Volume (Å)3 | 10.9145 | 9.6653 | 9.9599 | 3.5058 | 6.5139 |
| Average bond length (Å) | 2.0215 | 1.9375 | 1.9709 | 1.8983 | 1.9874 | |
In order to analyze the polarization dependence of the Raman signals, the Raman bands were fitted with the Lorentzian line shape using the Raman bands. The results are shown in Fig. 7. The observed Raman spectra have been indexed, and the comparative state of the observed vibration modes has been listed in Table 5. These results show a shift of the (RE.SrM) bands that occurs towards the highest frequency value (400 to 397 cm−1) or lower (346.05 to 341 cm−1), while the other bands were practically unaffected by doping. These differences are related to the chemical bond length. This behavior could be explained by the fact that the introduction of small quantities of larger rare earth elements results in the displacement of oxygen atoms. Effectively, the smaller Fe3+ ions (which are in the octahedral site) are replaced by larger Gd3+, Ho3+ and Sm3+ ions, and are responsible for such variation in the lattice of the M-type strontium hexaferrite. Therefore, the shift to a higher wavenumber for the A1g vibration in the site 12k could be explained by force constant changes, which provide further proof that rare earth elements reside in the 12k site.54 The peak frequency values observed in the spectra were compared with those in the literature for single crystals,52 nanoparticles55 and polycrystalline.56 It has been noted that they are in very good agreement with those associated with single crystals and nanoparticles. All of these results are in perfect agreement with those found in the case of XRD and FTIR.
| Site | Wavenumber | Symmetry | Assignment | |||
|---|---|---|---|---|---|---|
| M–Sr | (RE.SrM) | |ΔRaman|a | Kreisel et al.52 | |||
| a Raman shift. | ||||||
| 4f1(↓) | 719.1920 | 719.0674 | 0.1245 | 713 | A1g | Tetrahedral Fe(3)–O4 |
| 2b(↑) | 679.8629 | 679.7555 | 0.1074 | 684 | A1g | Bipyramid Fe(2)–O5 |
| 4f2(↓) | 608.6377 | 608.5030 | 0.1347 | 614 | A1g | Octahedral Fe(4)–O6 |
| 523.4077 | 523.3130 | 0.0946 | 527 | E2g | ||
| 2a(↑) | 505.1866 | 505.9428 | 0.7562 | 512 | A1g | Octahedral Fe(1)–O6 and Fe(5)–O6 |
| 463.0669 | 463.0624 | 0.0045 | 467 | A1g | ||
| 12k(↑) | 418.7701 | 401.6707 | 17.0994 | 417 | E1g | Octahedral dominated Fe(5)–O6 |
| 400.0034 | 397.4566 | 2.5468 | 409 | A1g | ||
| 346.0538 | 341.2250 | 4.8288 | 340 | A1g | Octahedral (mixed) | |
| 331.09216 | 331.2500 | 0.15784 | 335 | E2g | ||
| 309.3766 | 309.5371 | 0.1604 | 317 | E1g | ||
| 274.1963 | 274.1141 | 0.0822 | 285 | E1g | ||
3.4. Morphological study
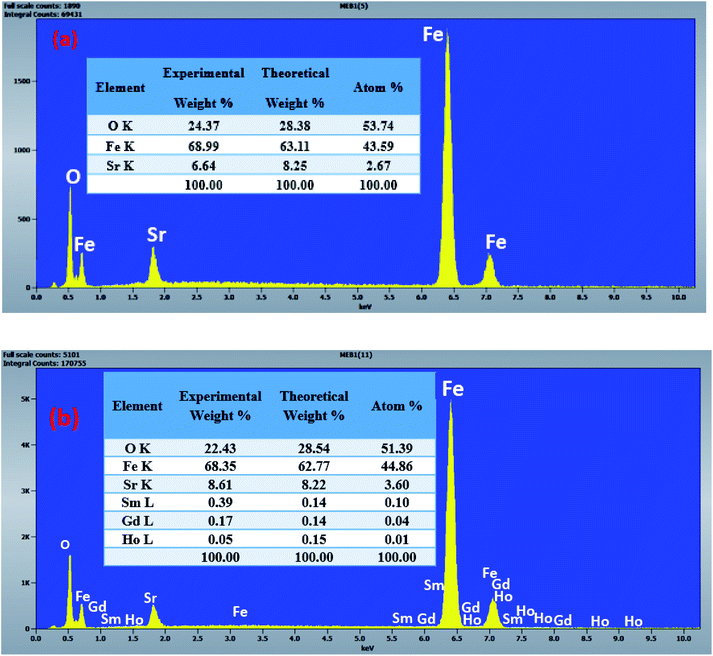
The morphology of the undoped and doped M-type Sr hexaferrite samples were observed by scanning electron microscopy (SEM), as shown in Fig. 8. The SEM analysis of (SrM) and (RE.SrM) indicates that the morphology is characterized by the largest grains with irregular grain shape. The configuration is almost platelet-shaped and agglomerated due to the magnetic interaction. The analysis of EDX is given in Fig. 9, and shows the presence of Sr, Fe, O, Gd, Ho and Sm in the samples. No other traceable impurities are found within the resolution limit of EDX. The small amount of carbon is related to the sample carrier of the equipment. The theoretical composition percentages of the elements were calculated using the following formula:
 | (2) |
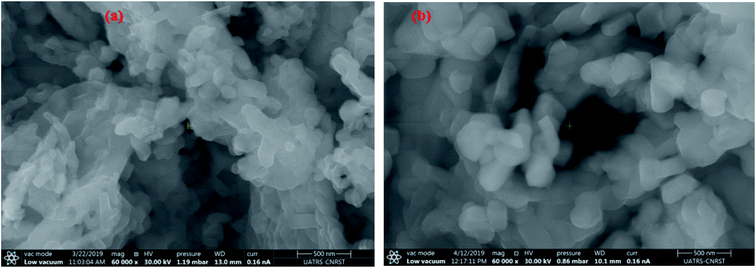 | ||
| Fig. 8 SEM images and particle size distribution analysis for M-type Sr hexaferrite: (a) (SrM), (b) (RE.SrM). | ||
3.5. Optical measurements
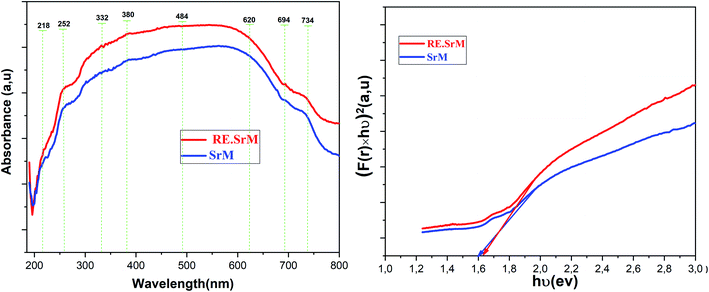
The UV-Vis spectra of (SrM) and (RE.SrM) are shown in Fig. 10. UV-Vis analysis was performed at room temperature in the range of 190–800 nm. The absorption spectra of two samples were divided into three portions as one having the wavelength (λ) region of 190 nm < λ < 332 nm, the second region being 332 nm < λ < 620 nm, and the last region being 620 nm < λ < 800 nm. Less absorbance was observed when the value of Eg was larger than the photon energy because photons having less energy could not excite the valence electrons to move into the conduction band. Conversely, the photons having enough energy equivalent to Eg can enhance the absorbance trend. The majority of the electrons close to the valence band are absorbed by the photons within the energy range of 332 nm < λ < 620 nm. These electrons achieve enough energy from the photons, and then jump into the conduction band, causing an increase in the absorbance of photons. It implies that the absorbance occurs in the visible regime. In the case of the interval 620 nm < λ < 800 nm, the photonic energy is greater than the band gap. The absorption tends to the state of saturation, and consequently, no increase in the absorbance will take place.The optical band gap (Eg) may be evaluated based on the optical absorption spectrum using the Kubelka–Munk (K–M) method.57 According to the Kubelka–Munk (K–M) theory, the [F(R) × hν]n versus (hν) curves (where F(R) = α is the Kubelka–Munk (K–M) function, (hν) is the photon energy) can be used to calculate the absorbed band gap energy using the following relation:
| (αhν) = A(hν − Eg)1/2 | (3) |
3.6. Magnetic measurements
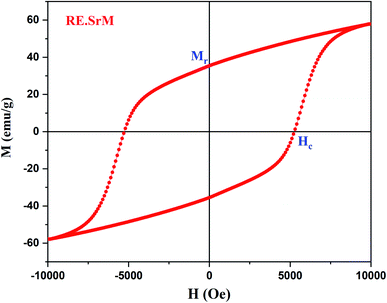
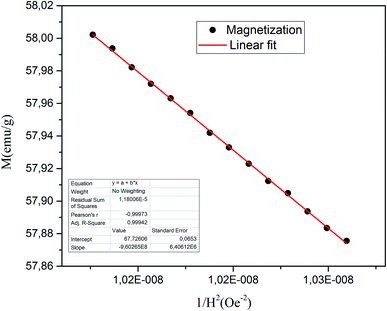
In this section, we attempt to elucidate the effect of doping the M-type strontium hexaferrite nanoparticles, with Sm3+, Gd3+ and Ho3+ ions, on the saturation magnetization Ms, coercive field Hc, remanent magnetization Mr and the energy product (BH)max.Fig. 11 shows the hysteresis loops of the RE.SrM sample at room temperature (300 K), and the applied magnetic field is ±10 kOe. Due to the absence of magnetic saturation, the saturation magnetization (Ms) of the sample could be determined using the law of approach to saturation (LAS)62 by the following eqn (4):
 | (4) |
 | (5) |
 | (6) |
To calculate Ms and K1, the M–H curve data (Fig. 13) at the high external field were fitted with eqn (6). The fitted curve for the (RE.SrM) sample is depicted in Fig. 12. Using the values of Ms and K1, the anisotropy field Ha can be calculated using eqn (7):
 | (7) |
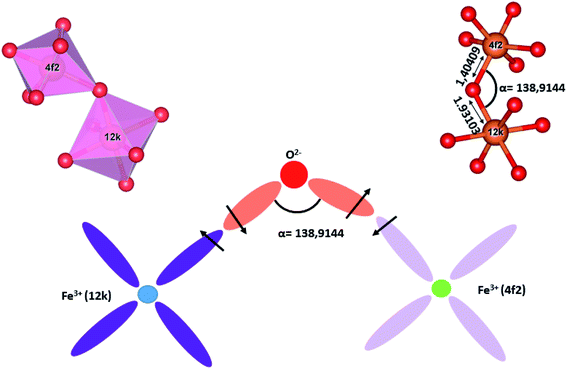 | ||
| Fig. 13 Schematic diagram of the magnetic super-exchange interactions between the 12k and the 4f2 sites. | ||
The values of Ms and Mr for the (RE.SrM) sample are respectively 67.72 emu g−1 and 35.65 emu g−1. These values are significantly greater than those of the undoped strontium hexaferrite, as well as some doped strontium hexaferrites reported in the literature, as shown in Table 7. This can be explained by the following: according to Raman analysis, Gd3+ and Ho3+ ions prefer to occupy the 12k(↑) site, whereas Sm3+ ions prefer to occupy the 2a(↑) site. The substitution of Fe3+ ions in the 12k(↑) and 2a(↑) octahedral sites with Sm3+, Gd3+, and Ho3+ ions, is responsible for the increased values of Ms and Mr of the (RE.SrM) sample. Indeed, the theoretical magnetic moments of Gd3+ and Ho3+ ions are calculated to be 7 and 10 μB, respectively. These values are collectively higher than 5 μB, which is the value of the magnetic moment of the Fe3+ ion.
The theoretical total magnetic moment per unit cell of the (RE.SrM) compound Mth,tot(RE.SrM) can be calculated using eqn (8), where M(↑) and M(↓) are the magnetic moments of sub-lattices with spin up and spin down, respectively. Mth,tot(RE.SrM) can be calculated as follows:
| Mth,tot(RE.SrM) = 2 × (5.98 × M(Fe3+,12k(↑)) + 0.01 × M(Gd3+,12k(↑)) + 0.01 × M(Ho3+,12k(↑)) + 0.99 × M(Fe3+,2a(↑)) + 0.01 × M(Sm3+,2a(↑)) + M(Fe3+,2b(↑)) − M(Fe3+,4f1(↓)) − M(Fe3+,4f2(↓))) | (8) |
| Mth,tot(RE.SrM) = 2 × ((5.98 × 5 μB) + (0.01 × (7 + 10)) + (0.99 × 5 μB) + (0.01 × 0.71) + (1 × 5 μB) − (2 × 5 μB) − (2 × 5 μB)) |
| Mth,tot(RE.SrM) = 40.043 μB per unit cell |
The value of the theoretical total magnetic moment per unit cell of the undoped (SrM) compound Mth,tot(SrM) can be calculated in the same manner to be 40 μB. Clearly, the value of Mth,tot(RE.SrM) is higher than that of Mth,tot(SrM) by 0.11%, explaining the increase in the Ms value. The experimental values of the total magnetic moment per formula unit of the (RE.SrM) compound Mtot(RE.SrM) can be calculated using eqn (9):76
 | (9) |
The improvement of the coercive force (Hc = 5257.63 Oe) can be explained by the magnetocrystalline anisotropy and the exchange interactions. Indeed, the Hc is directly proportional to the anisotropy Ha, while Ha is also directly proportional to the magnetocrystalline anisotropy constant K1. Therefore, Hc is directly proportional to K1. The determined values of Ha and K1 are respectively 22.45 104 Oe and 7.602 106 emu Oe g−1. These values are improved compared with other works on doped strontium hexaferrite (Ha = 1.9053 104, K1 = 0.5558 106 emu Oe g−1).77 In addition, the spin-orbital coupling is generally stronger in rare-earth ions than in 3d transition metal ions. Therefore, the substitution of Fe3+ ions with Sm3+ and Ho3+ ions improves the value of coercivity.
The crystal field perturbation effects on the 4f electrons of rare-earth ions are weak because the 4f electrons are shelled by the 5s and 5p electrons. Consequently, there are less quenching effects in rare-earth ions in comparison to 3d transition metal ions; thus, strong spin–orbit interactions occur. Doping with small amounts of Gd3+, Ho3+, and Sm3+ increases the value of the coercive field of the (RE.SrM) compound. Indeed, the Ho3+ and Sm3+ ions have a large anisotropy to a single ion; thus, they contribute to the anisotropy of (RE.SrM). However, it has been reported in the literature that Gd strengthens and contributes to anisotropy.78
Furthermore, it is necessary to consider the exchange interactions in the (RE.SrM) compound. Super-exchange is the coupling between two magnetic cations that are separated by an oxygen anion (non-magnetic). It depends on the distance of these cations from the oxygen anion through which the interactions occur, and the angle between these cations. The super-exchange interaction energy is maximum when the angle between the cations is about 180°. Moreover, the interaction energy decreases rapidly with increasing distance between the cations and the oxygen anion. This effect becomes negligible over a distance higher than 3 Å, as suggested by Anderson.79 To study the effect of the super-exchange interaction, we calculated the respective bond lengths and bond angles, as shown in Table 2. All bond lengths in SrM and (RE.SrM) are less than 3 Å, indicating that the super-exchange interactions are non-negligible. The average bond length of the different polyhedrons ranging from largest to smallest are: octahedral > tetrahedral > bipyramidal for the (SrM) structure, and bipyramidal > octahedral > tetrahedral, for the (RE.SrM) structure.
We consider the following sub-lattice interactions: (2a(↑)–4f1(↓)), (2a(↑)–12k(↑)), (2b(↑)–4f2(↓)), (2b(↑)–12k(↑)), (4f2(↓)–12k(↑)), (4f1(↓)–12k(↑)), (4f2(↓)–4f2(↓)) and (12k(↑)–12k(↑)). From the values of Table 2, it can be seen that the interaction (4f2(↓)–12k(↑)) is the strongest. Indeed, the 4f2(↓) and 12k(↑) sites have the shortest Fe–O average bond length and the largest angle value between the cations, as depicted in Fig. 13. On the other hand, the sub-lattice interaction (12k(↑)–12k(↑)) is the weakest because the 12k(↑) site has the longest Fe–O average bond length and the smallest angle value between the cations. These interactions could affect the coercive force in the following manner: during the hysteresis loops measurement of the (RE.SrM) sample, the magnetic moments get aligned in the direction of the external magnetic field when the external field is applied to the sample. As the external field decreases slowly, these magnetic moments have a low tendency to return to their initial positions due to the strong interactions between the magnetic moments, especially the 12k(↑) and 4f2(↓) sites. This could explain the high coercive force of the (RE.SrM) sample.
The squareness ratio (Mr/Ms) for (RE.SrM) has also been calculated to be 0.52. The obtained value is above the theoretical value of 0.5, indicating that the materials are a single magnetic domain. A value below 0.5 is related to the multi magnetic domains.48 In the present work, the observed Mr/Ms value is very close to 0.5, suggesting that the synthesized sample is in the single magnetic domain.
According to the particle sizes calculated in the DRX section, the decrease of particle sizes after doping with rare earth elements is probably another reason for the improved coercivity (Hc). (Hc) has been significantly affected by particle morphology and varies inversely with grain size. With larger grain size, fewer grain boundaries will act as pinning sites for the magnetic domain wall movement. With Sm3+, Gd3+ and Ho3+ doping, the grain size became smaller, and the results are consistent with XRD analysis. The reverse magnetic field for the demagnetization of the nanoparticles can be interpreted in relation with the domain rotation, where the smaller grain sizes have less domain wall movement. Consequently, the high coercivity is expected for smaller particle sizes.
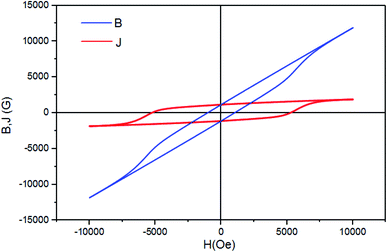
To test the material's material quality for magnetic water treatment applications, the curves B–H and J–H were drawn using the equation: B = H + 4πM in the CGS units with J = 4πM. The J–H curve is the hysteresis loop shown in Fig. 14. Two different coercivities are normally used to characterize the hardness of the permanent magnetic material, namely, the normal coercivity HcB (the strength of the inverse field required to reduce the B-induction to zero) and the intrinsic coercivity HcJ (the strength of the field required to reduce the intrinsic induction 4πM to zero). A high-performance magnet is characterized by a high saturation magnetization and a high coercivity, with the intrinsic coercivity being generally much higher than the normal coercivity (HcB) that is necessary for the stable operation of the magnet.
The two coercivity parameters were directly determined from the B–H and J–H curves presented in Fig. 14. The results, presented in Table 6, show that both HcB and HcJ increase with the substitution with the rare earth elements Gd3+, Ho3+ and Sm3+. This constitutes an improvement in the magnetic properties for permanent magnet applications, compared to other works, in particular Sr0.7La0.3Fe11.8Zn0.2O19 (HcJ = 2530.86 Oe and HcB = 2459.23 Oe).80
| Hc (Oe) | Ms (emu g−1) | Mr (emu g−1) | Mr/Ms | HcJ (Oe) | HcB (Oe) | K1 (emu Oe g−1) × 106 | Ha (Oe) × 104 | (BH)max (MGOe) | (BH)max (kJ m−3) |
|---|---|---|---|---|---|---|---|---|---|
| 5258.63 | 67.72 | 35.65 | 0.52 | 5244.92 | 1030.45 | 7.602 | 22.45 | 1.06 | 8.46 |
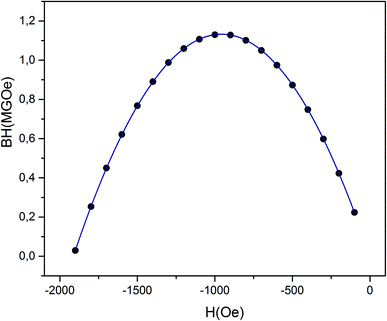
From the M–H data (Fig. 11), we could also calculate the energy product (BH)max, which is a significant factor for rating the performance of a permanent magnet. (BH)max is also known as a figure of merit for hard magnetic materials, and is often used to indicate their grade. Fig. 15 shows |BH| versus H dependences (in absolute values) of the (RE.SrM) sample. It can be seen that the data form a parabola in which the vertex corresponds to (BH)max. The value of (BH)max is found to be 1.064 MGOe. This value is improved due to the increase in the Hc and Mr values. The reported (BH)max values from the literature include: 1.04 MGOe (SrFe12O19),81 0.363 MGOe (Ba0.5Sr0.5Fe12O19),82 0.007 MGOe (Ba0.5Sr0.5Fe12O19),83 0.9 MGOe (SrFe12O19),84 0.791 MGOe (BaCoFe11O19),85 0.96 MGOe (BaFe12O19),86 0.622 MGOe (BaCr0.3Ga0.3Fe11.4O19),87, (0.42–0.61) MGOe (SrFe12O19),88 1.02 MGOe (SrFe12O19),89 and 1.039 MGOe (SrLa0.1Fe11.9O19).90 The obtained value of (BH)max in this work has yielded much higher values than those reported by other researchers, which is the essential achievement of this work.
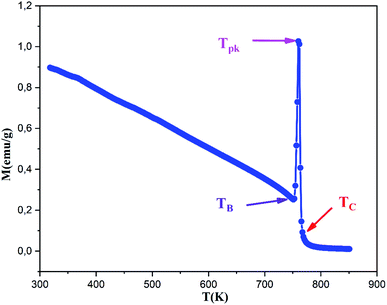
The magnetization M of the (RE.SrM) sample was measured by varying temperature T from 25 °C to 580 °C, as shown in Fig. 16. It can be seen that M decreases with increasing T. As the temperature increases from 25 °C, the magnetization value gradually decreases to a critical temperature after which a sudden increase in the magnetization M is observed. This temperature is called the blocking temperature TB, and its value is found to be TB = 749 K. This behavior indicates that, below the blocking temperature TB, the (RE.SrM) nanoparticles are magnetically stable, and a superparamagnetic relaxation takes place when the temperature overcomes the TB value. Moreover, it is clear that the measured magnetization shows a typical behavior. This phenomenon is called the Hopkinson effect, and the maximum just below the Curie temperature is called the Hopkinson peak. The drastic increase in magnetization can be explained by a concurrent phenomenon of thermomagnetic randomization and magnetic reorganization by the expansion of the domain boundary expansion with increasing thermal energy.91 The relative intensity of the Hopkinson peak indicates that the (RE.SrM) nanoparticles are in the single-domain state, which is in good agreement with the mentioned value of the Mr/Ms ratio. In addition, a superparamagnetic relaxation occurs, resulting in a sharp peak (peak temperature) at Tpk = 760 K, which is below to the Curie temperature Tc = 765 K. This suggests a transition of the (RE.SrM) nanoparticles from a ferrimagnetic to a paramagnetic state.
The value of Tc is relatively high when compared to previous works. The reported Tc values from the literature include: 737 K for (SrFe12O19),92 740.15 K for (Sr0.95Sm0.05Fe12O19)54 and 738.15 K (Ba0.5Sr0.5Fe11.6Co0.2(MgZn)0.1O19).93
As the Curie temperature Tc depends on the overall strength of the exchange interactions, it can be argued that the increase of the exchange interaction energy is responsible for the increase in the Tc value. As it was already discussed, the increase in the exchange interaction energies in the compound is due to the presence of rare earth elements having a strong spin–orbit coupling and large magnetic moments, especially the Ho3+ ion. Indeed, to offset the effects of the exchange interactions (RE–O–Fe3+ and Fe3+–O–Fe3+) in the (RE.SrM) compound, a greater amount of energy will be required.
3.7. Ab initio study
The magnetic properties of the strontium hexaferrite can be adjusted by substituting Fe atoms with other atoms, such as rare earth elements. The Fe atoms occupy five distinct crystallographic sites, namely, the 2a, 2b, 4f1, 4f2 and 12k sites. The substitution of Fe atoms with other elements give rise to energetically distinct configurations (denoted [X,s] with element X in the site s). To complement the present XRD and Raman spectroscopy results, a site preference study was conducted for the substituting elements Sm, Gd and Ho. This can be accomplished by calculating the substitution energy Esub[X,s] of the element X in the site s using eqn (10):
| Esub[X,s] = ESrFeXO[s] − ESrFeO + EFe − EX | (10) |
Some of the calculations that were conducted have not converged, namely, the calculations for the structure optimization of strontium hexaferrite substituted with Sm in the 4f2 and 12k sites, and both Gd and Ho in the (4f2) site. This indicates that these configurations are more likely to be unstable; therefore, they were omitted from the present site preference study. Consequently, the configurations to be investigated are the following:
| [Sm,2a], [Gd,2a], [Gd,12k], [Ho,2a] and [Ho,12k] |
Fig. 17 shows the graph corresponding to the calculated substitution energy Esub of Sm, Gd, and Ho in the octahedral sites of 2a and 12k, using the GGA and the GGA+U methods. It can be seen that the curve from the GGA method, as well as the 3 curves from GGA+U have a common trend: Sm in 2a site having the highest substitution energy, and Ho in the 12k site having the lowest value for Esub. The more stable and energetically favorable substitution site corresponds to that of the lowest substitution energy. From the GGA calculations, the configurations ranging from the least stable to the most stable, are: [Sm,2a], [Gd,12k], [Gd,2a], [Ho,2a], then [Ho,12k]. However, those from the GGA+U calculations ranging from the least stable to the most stable are: [Sm,2a], [Gd,2a], [Gd,12k], [Ho,2a], then [Ho,12k]. This is consistent with the results using the GGA+U method with Ueff = 3, 4 and 6 eV.
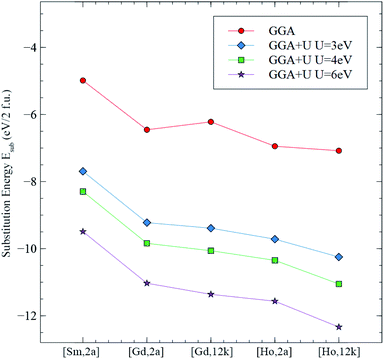 | ||
| Fig. 17 Substitution energies Esub for the studied configurations calculated using the GGA and the GGA+U methods with Ueff = 3, 4 and 6 eV. | ||
In conclusion, from the substitution energy concerning the site preference study, the Sm3+ occupies the 2a site, whereas Gd3+ and Ho3+ both occupy the 12k sites. This is in very good agreement with the present XRD and Raman spectroscopy results.
| Phase | pH | Calcination temperature (°C) | Duration of calcination | Crystallite size (nm) | Magnetic parametres | Ref. | ||||
|---|---|---|---|---|---|---|---|---|---|---|
| Applied field (KOe) | Ms (emu g−1) | Mr (emu g−1) | Hc (Oe) | |||||||
| Sol–gel | Undoped SrFe12O19 | 7 | 1100 | 5 h | 45.15 | ±13 | 46.9 | 34 | 46.9 | 65 |
| SrGd0.01Sm0.01Ho0.01Fe11.97O19 | 7 | 1000 | — | 49.85 | ±10 | 67.72 | 35.65 | 5257.63 | Present work | |
| Sr0.975 Ce0.025Fe11.75Mn0.25O19 | 7–8 | 950 | 8 h | 1782 | ±10 | 59.80 | 17.30 | 256.09 | 66 | |
| SrAl4La0.5Sm0.5Fe7O19 | 7–8 | 1100 | 1 h | 43.80 | ±10 | 53.271 | 22.313 | 623.286 | 67 | |
| Sr0.5Cu0.2Mg0.3Fe12O19 | 7–8 | 1200 | 4 h | 2120 | ±10 | 72.55 | 45.29 | 1987.40 | 68 | |
| Ba0.4Sr0.6Al0.3 Sm0.1Fe11.09O19 | — | 1000 | 1 h 30 | — | ±10 | 42.73 | 25.48 | 2700 | 69 | |
| Sr(NdLa)0.4Fe11.2O19 | 6.5 | 900 | 10 h | 30.62 | — | 47.7 | — | 6308 | 45 | |
| Co-precipitation | Sr0.5Ba0.98Pr0.02Fe11.80Ni0.2O19 | 9 | 1050 | 6 h | 41 | ±7 | — | — | 2790 | 70 |
| Sr0.85Sm0.15Fe11.85Cu0.15O19 | 7 | 800 | 2 h | — | ±12 | 59.96 | — | 6862 | 71 | |
| Sr(CeNd)0.25Fe11.5O19 | 13 | 900 | 2 h | 29 | ±15 | 52.36 | 30.90 | 5010 | 72 | |
| Solid state | Sr0.7La0.1Ce0.2Fe11.7Zn0.3O19 | — | 1200 | 2 h | — | ±5 | 67.2 | — | 2685 | 73 |
| Ca0.4Sr0.44Gd0.16Fe11.84O19 | — | 1185 | 1 h 5 | 51.97 | ±20 | 63.80 | 26.44 | 1332.7 | 74 | |
| Ca0.4Sr0.44Nd0.16Fe11.84(NbZn)0.08O19 | — | 1625 | 2 h | 48.2 | ±30 | 60.915 | 17.359 | 617.7 | 75 | |
| Configuration | Esub (eV) | G | Mtot (μB) | a (Å) | b (Å) | c (Å) | V (Å3) | α (°) | β (°) | γ (°) |
|---|---|---|---|---|---|---|---|---|---|---|
| SrFe12O19 | — | — | 40.02 | 5.8259 | 5.8259 | 22.9161 | 673.59 | 90 | 90 | 120 |
| [Sm,2a] | −7.693 | 2 | 40.00 | 5.8533 | 5.8533 | 23.3461 | 692.71 | 90 | 90 | 120 |
| [Gd,2a] | −9.223 | 2 | 41.99 | 5.8529 | 5.8529 | 23.3077 | 691.47 | 90 | 90 | 120 |
| [Gd,12k] | −9.389 | 12 | 42.00 | 5.8579 | 5.9126 | 23.1089 | 695.27 | 90.19 | 90 | 119.69 |
| [Ho,2a] | −9.716 | 2 | 31.01 | 5.8521 | 5.8521 | 23.2607 | 689.89 | 90 | 90 | 120 |
| [Ho,12k] | −10.248 | 12 | 38.96 | 5.8596 | 5.9034 | 23.0936 | 693.51 | 90.19 | 90 | 119.75 |
| Configuration | M(Fe) (μB) in: | M(X) (μB) X = Sm, Gd, Ho in: | Mtot (μB) | |||||
|---|---|---|---|---|---|---|---|---|
| 2a | 2b | 4f1 | 4f2 | 12k | 2a | 12k | ||
| SrFe12O19 | 3.93 | 3.83 | −3.83 | −3.91 | 3.98 | — | — | 40.02 |
| [Sm,2a] | 3.98 | 3.84 | −3.80 | −3.85 | 3.96 | 4.89 | — | 40.00 |
| [Gd,2a] | 3.98 | 3.85 | −3.81 | −3.86 | 3.96 | 6.81 | — | 41.99 |
| [Gd,12k] | 3.97 | 3.85 | −3.81 | −3.87 | 3.96 | — | 6.81 | 42 |
| [Ho,2a] | 3.98 | 3.85 | −3.81 | −3.86 | 3.96 | 3.8 | — | 38.98 |
| [Ho,12k] | 3.98 | 3.85 | −3.81 | −3.87 | 3.96 | — | 3.9 | 38.96 |
The band gap problem is among the issues of the GGA approximation. The calculated band gaps of semiconductors are systematically underestimated with respect to the experimental values.94 One way to address the problem is to introduce an effective on-site Coulomb interaction term (referred to as the effective Hubbard parameter Ueff) to the Hohenberg–Kohn–Sham Hamiltonian. This GGA+U method corrects for the self-interaction error present in the GGA approximation, and the band gap is no longer underestimated.
Fig. 18 shows the calculated density of states of the M-type strontium hexaferrite SrFe12O19 using the GGA and the GGA+U methods with Ueff = 4 eV. It can be seen that the GGA method give rise to a metallic behavior for the structure. The band gap is clearly underestimated with the GGA method. On the other hand, the GGA+U method produces an electronic structure corresponding to a semi-conductor, as it was shown experimentally in previous works.60,61,95–98
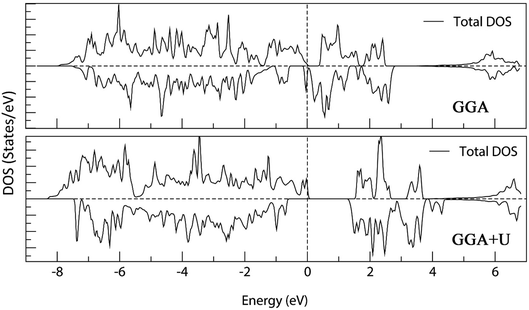 | ||
| Fig. 18 Total Density Of States (DOS) of M-type strontium hexaferrite SrFe12O19 calculated using the GGA method (top); and the GGA+U method with Ueff = 4 eV (bottom). The Fermi energy is set to zero. | ||
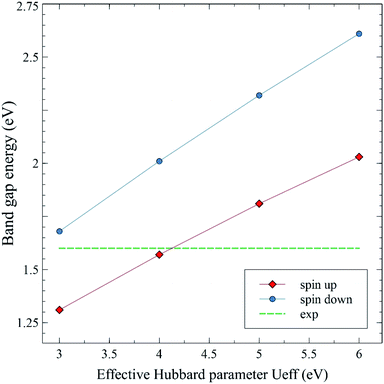
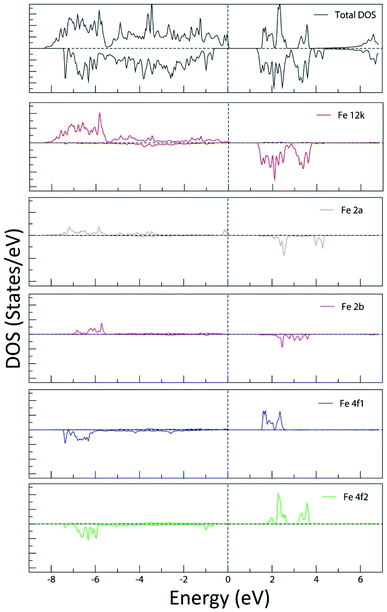
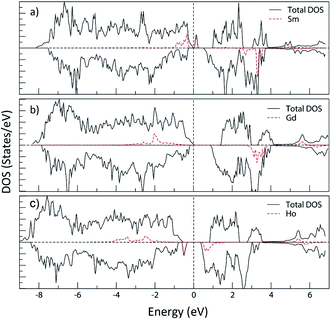
Fig. 19 shows the calculated spin up and spin down band gap energies of the M-type strontium hexaferrite SrFe12O19 using the GGA+U method with Ueff = 3, 4, 5 and 6 eV, compared to the present experimental value from the optical measurements. It can be seen from the graphs that the two curves are roughly linear. The GGA+U method with Ueff = 4 eV gives rise to a band gap energy value of 1.57 eV (corresponding to the majority spin channel, i.e., the spin up channel), which is in good agreement with the present experimental optical band gap of 1.60 eV. The GGA+U method with Ueff = 4 eV was used for calculating the total Density Of States (DOS) and the Partial Density Of States (PDOS) of the Fe LAPW spheres of the strontium hexaferrite SrFe12O19 (Fig. 20), as well as for calculating the DOS and the PDOS of Sm, Gd and Ho LAPW spheres of the structures SrFe11.5X0.5O19 with X = Sm, Gd and Ho, respectively (Fig. 21).
In Fig. 20, the PDOS of the Fe LAPW spheres show the occupied low-lying energy Fe-3d bands, extending on average from −7.5 eV to the Fermi level. The 3d vacant bands start from the bottom of the valence band and extend to around 4.5 eV above the Fermi energy level. It can be seen that the PDOS of Fe in the octahedral sites (12k, 2a and 4f2) is characteristic of the electronic configuration t32g e2g of the high spin state of the octahedrally coordinated Fe3+. The crystal field separation of the vacant t2g and eg bands is clearly observed. In addition, it can be shown that the PDOS of the tetrahedrally coordinated Fe in the 4f1 site is characteristic of the electronic configuration e2 t32 of the high spin state of the tetrahedrally coordinated Fe3+. The occupied Fe-3d bands in the 4f1 and 4f2 sites are quite similar. Nevertheless, the vacant Fe-3d bands in the tetrahedral 4f1 site are narrower than those of Fe in the octahedral sites, reflecting a smaller field splitting, as it is expected from the ionic crystal-field theory.
Fig. 21 shows the total and partial density of states (Sm, Gd and Ho LAPW spheres) of SrFe11.5Sm0.5O19 (Sm in the 2a site), SrFe11.5Gd0.5O19 (Gd in the 12k site) and SrFe11.5Ho0.5O19 (Ho in the 12k site) using the GGA+U method (Ueff = 4 eV). It is observed that the electronic structure of strontium hexaferrite is affected, especially the band gap energy, upon doping with any of the three elements. The PDOS of the rare earth elements extending from −6 eV to 4 eV (with respect to the Fermi level) are mostly 4f states.
The density of states of SrFe11.5Sm0.5O19, where Sm3+ ions occupy the 2a site, shows the creation of occupied bands extending from −1 eV to −0.3 eV. Additional vacant bands are created near the Fermi energy, and others in the higher energies. This is characteristic of the electronic configuration, A12u T32u T11u, of the octahedrally coordinated Sm3+ (Fig. 22(a)). The band gap energy is therefore significantly reduced.
 | ||
| Fig. 22 Schematic diagram of the crystal field splitting of: (a) Sm 3+; (b) Gd3+; (c) Ho3+ in the octahedral field. | ||
The density of states of SrFe11.5Gd0.5O19, where Gd3+ ions occupy the 12k site, shows the creation of the low-lying energy occupied Gd 4f bands extending from −3.5 eV to −0.5 eV, where the band gap energy is weakly affected. These bands correspond to the electronic configuration, A12u T32u T31u, of the octahedrally coordinated Gd3+ (Fig. 22(b)).
On the other hand, the DOS of SrFe11.5Ho0.5O19, where Ho3+ occupy the 12k site, displays a creation of low-lying energy occupied bands in the majority spin channel extending from −4.4 eV to −1.9 eV, in addition to a narrow band in the minority spin channel, decreasing the band gap energy to 1.01 eV. These bands are characteristic of the electronic configuration A22g T52g T31g of the octahedrally coordinated Ho3+ (Fig. 22(c)).
This study suggests that the band gap would be decreased upon doping with Sm3+, Gd3+ and Ho3+ ions. However, as it is seen in Section 3.5, the experimental band gap energy from the present work is not affected upon doping. It is measured to be 1.60 eV for the SrM compound and 1.62 eV for the (RE.SrM) compound.
4. Conclusion
In the present work, the sol–gel method was found to be economical and efficient for the synthesis of Gd–Ho–Sm doped M-type Sr hexaferrite nanoparticles. XRD structural analysis reveals a single-phase hexaferrite at 1000 °C. Rietveld refinement has confirmed the formation of a hexagonal structure with space group P63/mmc and a decrease of the lattice constant. The crystallite size calculated is in the order of 49 nm. The crystallization was confirmed by FTIR spectroscopy. The Raman spectra confirm the formation of octahedral, tetrahedral and trigonal-bipyramidal sites. From the proposed cation distribution, we note that the Gd3+ and Ho3+ ions have strong preferences towards the 12k site, whereas the Sm3+ ions prefer to occupy the 2a site. The SEM analysis and EDS spectroscopy confirmed the morphology and homogeneous composition. The calculated band gap from the UV-Vis NIR spectroscopy spectra indicates that the sample is a semiconductor. The magnetic properties prove that (RE.SrM) belongs to the class of hard-magnetic materials. The substitution of the Fe3+ ions with Sm3+, Gd3+, and Ho3+ ions is responsible for the increased values of Ms and Mr. The improvement in Hc is due to the contribution of the magnetocrystalline anisotropy of the Gd3+ and Sm3+ ions. The improvement of (BH)max is due to the increase of Hc and Mr. The ferrimagnetic nature and the initial magnetization behavior illustrate the typical behavior of the single-domain particles. The temperature-dependent magnetization shows a Hopkinson peak before transition. The Mr/Ms ratio confirms the single domain nature.First-principles calculations were conducted on SrFe12−xXxO19 with x = 0, 0.5 and X = Sm, Gd, Ho to investigate the effects of doping the M-type strontium hexaferrite with the rare-earth elements Sm, Gd, and Ho on its structural, electronic and magnetic properties. The site preference study reveals that the Sm3+ ions preferably occupy the 2a site, whereas Gd3+ and Ho3+ ions both preferably occupy the 12k sites, which is in very good agreement with the XRD and Raman spectroscopy results in the present work. The GGA+U method gave rise to a semi-conducting behavior for the doped and pristine Sr hexaferrite structure. The hard ferrimagnetism is a good magnetic response, making this material very interesting for water treatment applications.
Conflicts of interest
There are no conflicts to declare.Acknowledgements
This research did not receive any specific grant from funding agencies in the public, commercial, or not-for-profit sectors.References
- W. Yongfei, L. Qiaoling, Z. Cunrui and J. Hongxia, J. Alloys Compd., 2009, 467, 284–287 CrossRef
.
- T. Xie, L. Xu and C. Liu, Powder Technol., 2012, 232, 87–92 CrossRef CAS
.
- M. N. Ashiq, S. Shakoor, M. Najam-ul-Haq, M. F. Warsi, I. Ali and I. Shakir, J. Magn. Magn. Mater., 2015, 374, 173–178 CrossRef CAS
.
- S. Chino, S. Ogasawara, T. Miura, A. Chiba, M. Takemoto and N. Hoshi, in 2011 IEEE Energy Conversion Congress and Exposition, IEEE, Phoenix, AZ, USA, 2011, pp. 2805–2811 Search PubMed
.
- M. Chirca, S. Breban, C. Oprea and M. M. Radulescu, in 2014 International Conference on Optimization of Electrical and Electronic Equipment (OPTIM), IEEE, Bran, Romania, 2014, pp. 472–476 Search PubMed
.
- U. Surendran, O. Sandeep and E. J. Joseph, Agric. Water Manag., 2016, 178, 21–29 CrossRef
.
- M. C. Amiri and A. A. Dadkhah, Colloids Surf., A, 2006, 278, 252–255 CrossRef CAS
.
- C. Santhosh, V. Velmurugan, G. Jacob, S. K. Jeong, A. N. Grace and A. Bhatnagar, Chem. Eng. J., 2016, 306, 1116–1137 CrossRef CAS
.
- P. E. Kazin, L. A. Trusov, D. D. Zaitsev, Y. D. Tretyakov and M. Jansen, J. Magn. Magn. Mater., 2008, 320, 1068–1072 CrossRef CAS
.
- A. Morisako, T. Naka, K. Ito, A. Takizawa, M. Matsumoto and Y.-K. Hong, J. Magn. Magn. Mater., 2002, 242–245, 304–310 CrossRef CAS
.
- M. J. Iqbal, M. N. Ashiq, P. Hernandez-Gomez and J. M. Munoz, J. Magn. Magn. Mater., 2008, 320, 881–886 CrossRef CAS
.
- H. Z. Wang, B. Yao, Y. Xu, Q. He, G. H. Wen, S. W. Long, J. Fan, G. D. Li, L. Shan, B. Liu, L. N. Jiang and L. L. Gao, J. Alloys Compd., 2012, 537, 43–49 CrossRef CAS
.
- L. A. Trusov, E. A. Gorbachev, V. A. Lebedev, A. E. Sleptsova, I. V. Roslyakov, E. S. Kozlyakova, A. V. Vasiliev, R. E. Dinnebier, M. Jansen and P. E. Kazin, Chem. Commun., 2018, 54, 479–482 RSC
.
- R. C. Pullar, Prog. Mater. Sci., 2012, 57, 1191–1334 CrossRef CAS
.
- G. M. Rai, M. A. Iqbal and K. T. Kubra, J. Alloys Compd., 2010, 495, 229–233 CrossRef CAS
.
- P. A. Mariño-Castellanos, A. C. Moreno-Borges, G. Orozco-Melgar, J. A. García and E. Govea-Alcaide, Phys. B, 2011, 406, 3130–3136 CrossRef
.
- M. Liu, X. Shen, F. Song, J. Xiang and X. Meng, J. Solid State Chem., 2011, 184, 871–876 CrossRef CAS
.
- S. Ounnunkad and P. Winotai, J. Magn. Magn. Mater., 2006, 301, 292–300 CrossRef CAS
.
- I. Bsoul and S. H. Mahmood, J. Alloys Compd., 2010, 489, 110–114 CrossRef CAS
.
- G. Litsardakis, I. Manolakis, C. Serletis and K. G. Efthimiadis, J. Magn. Magn. Mater., 2007, 316, 170–173 CrossRef CAS
.
- X. Liu, W. Zhong, S. Yang, Z. Yu, B. Gu and Y. Du, Phys. Status Solidi A, 2002, 193, 314–319 CrossRef CAS
.
- J. F. Wang, C. B. Ponton and I. R. Harris, J. Alloys Compd., 2005, 403, 104–109 CrossRef CAS
.
- J. F. Wang, C. B. Ponton and I. R. Harris, IEEE Trans. Magn., 2002, 38, 2928–2930 CrossRef CAS
.
- J. F. Wang, C. B. Ponton and I. R. Harris, J. Magn. Magn. Mater., 2006, 298, 122–131 CrossRef CAS
.
- M. Jamalian, A. Ghasemi and E. Paimozd, J. Electron. Mater., 2014, 43, 1076–1082 CrossRef CAS
.
- S. Kanagesan, M. Hashim, S. Jesurani, T. Kalaivani and I. Ismail, Mater. Sci. Appl., 2014, 05, 171–176 CAS
.
- L. Qiao, L. You, J. Zheng, L. Jiang and J. Sheng, J. Magn. Magn. Mater., 2007, 318, 74–78 CrossRef CAS
.
- A. Ghasemi, A. Morisako and X. Liu, J. Magn. Magn. Mater., 2008, 320, 2300–2304 CrossRef CAS
.
- H. F. Lu, R. Y. Hong and H. Z. Li, J. Alloys Compd., 2011, 509, 10127–10131 CrossRef CAS
.
- X. Yang, Q. Li, J. Zhao, B. Li and Y. Wang, J. Alloys Compd., 2009, 475, 312–315 CrossRef CAS
.
- J. Ding, W. F. Miao, P. G. McCormick and R. Street, J. Alloys Compd., 1998, 281, 32–36 CrossRef CAS
.
- Y.-P. Fu, C.-H. Lin and K.-Y. Pan, J. Alloys Compd., 2003, 349, 228–231 CrossRef CAS
.
- D.-H. Kim, Y.-K. Lee, K.-M. Kim, K.-N. Kim, S.-Y. Choi and I.-B. Shim, J. Mater. Sci., 2004, 39, 6847–6850 CrossRef CAS
.
- I. Perelshtein, N. Perkas, Sh. Magdassi, T. Zioni, M. Royz, Z. Maor and A. Gedanken, J. Nanopart. Res., 2008, 10, 191–195 CrossRef CAS
.
- A. Manikandan, J. J. Vijaya and L. J. Kennedy, J. Nanosci. Nanotechnol., 2013, 13, 2986–2992 CrossRef CAS PubMed
.
- P. Giannozzi, S. Baroni, N. Bonini, M. Calandra, R. Car, C. Cavazzoni, D. Ceresoli, G. L. Chiarotti, M. Cococcioni, I. Dabo, A. D. Corso, S. de Gironcoli, S. Fabris, G. Fratesi, R. Gebauer, U. Gerstmann, C. Gougoussis, A. Kokalj, M. Lazzeri, L. Martin-Samos, N. Marzari, F. Mauri, R. Mazzarello, S. Paolini, A. Pasquarello, L. Paulatto, C. Sbraccia, S. Scandolo, G. Sclauzero, A. P. Seitsonen, A. Smogunov, P. Umari and R. M. Wentzcovitch, J. Phys.: Condens. Matter, 2009, 21, 395502 CrossRef PubMed
.
- J. P. Perdew, K. Burke and M. Ernzerhof, Phys. Rev. Lett., 1996, 77, 3865 CrossRef CAS PubMed
.
- H. J. Monkhorst and J. D. Pack, Phys. Rev. B: Solid State, 1976, 13, 5188–5192 CrossRef
.
- P. Blaha, K. Schwarz, G. K. H. Madsen, D. Kvasnicka, J. Luitz, R. Laskowski, F. Tran and L. D. Marks, WIEN2k, An Augmented Plane Wave + Local Orbitals Program for Calculating Crystal Properties, ed. Karlheinz Schwarz, Techn. Universität Wien, Austria, 2018,
ISBN 3-9501031-1-2 Search PubMed
.
- V. I. Anisimov, J. Zaanen and O. K. Andersen, Phys. Rev. B: Condens. Matter Mater. Phys., 1991, 44, 943 CrossRef CAS PubMed
.
- R. Joshi, C. Singh, J. Singh, D. Kaur, S. B. Narang and R. B. Jotania, J. Mater. Sci.: Mater. Electron., 2017, 28, 11969–11978 CrossRef CAS
.
- R. S. Azis, S. Sulaiman, I. R. Ibrahim, A. Zakaria, J. Hassan, N. N. C. Muda, R. Nazlan, N. M. Saiden, Y. W. Fen, M. S. Mustaffa and K. A. Matori, Nanoscale Res. Lett., 2018, 40, 773–783 Search PubMed
.
- T. R. Wagner, J. Solid State Chem., 1998, 136, 120–124 CrossRef CAS
.
- C. Cui, L. Xu, T. Xie, C. Liu and J. Yang, Mater. Focus, 2014, 3, 355–360 CrossRef CAS
.
- A. Thakur, P. B. Barman and R. R. Singh, Mater. Chem. Phys., 2015, 156, 29–37 CrossRef CAS
.
- V. Dimitrov and T. Komatsu, J. Solid State Chem., 2002, 163, 100–112 CrossRef CAS
.
- N. Hayashi, J. Electrochem. Soc., 1999, 146, 1351 CrossRef CAS
.
- Y. Mouhib, M. Belaiche and S. Briche, Phys. Status Solidi A, 2018, 215, 1800469 CrossRef
.
- Q. Wu, Z. Yu, H. Hao, Y. Chu and H. Xie, J. Mater. Sci.: Mater. Electron., 2017, 28, 12768–12775 CrossRef CAS
.
- R. S. Yadav, I. Kuřitka, J. Vilcakova, J. Havlica, L. Kalina, P. Urbánek, M. Machovsky, D. Skoda, M. Masař and M. Holek, Ultrason. Sonochem., 2018, 40, 773–783 CrossRef CAS PubMed
.
- S. S. Seyyed Afghahi, R. Peymanfar, S. Javanshir, Y. Atassi and M. Jafarian, J. Magn. Magn. Mater., 2017, 423, 152–157 CrossRef CAS
.
- J. Kreisel, G. Lucazeau and H. Vincent, J. Solid State Chem., 1998, 137, 127–137 CrossRef CAS
.
- W. Y. Zhao, P. Wei, X. Y. Wu, W. Wang and Q. J. Zhang, J. Appl. Phys., 2008, 103, 063902 CrossRef
.
- M. A. P. Buzinaro, N. S. Ferreira, F. Cunha and M. A. Macêdo, Ceram. Int., 2016, 42, 5865–5872 CrossRef CAS
.
- V. Anbarasu, P. M. Md Gazzali, T. Karthik, A. Manigandan and K. Sivakumar, J. Mater. Sci.: Mater. Electron., 2013, 24, 916–926 CrossRef CAS
.
- M. S. Chen, Z. X. Shen, X. Y. Liu and J. Wang, J. Mater. Res., 2000, 15, 483–487 CrossRef CAS
.
- P. Kubelka, Z. Tech. Phys., 1931, 12, 593–601 Search PubMed
.
- T. Kaur, S. Kumar, B. H. Bhat, B. Want and A. K. Srivastava, Appl. Phys. A, 2015, 119, 1531–1540 CrossRef CAS
.
- K. Alamelu Mangai, K. Tamizh Selvi, M. Priya, M. Rathnakumari, P. Sureshkumar and S. Sagadevan, J. Mater. Sci.: Mater. Electron., 2017, 28, 1238–1246 CrossRef CAS
.
- J. Mohammed, H. Y. Hafeez, T. Tchouank Tekou Carol, C. E. Ndikilar, J. Sharma, P. K. Maji, S. K. Godara and A. K. Srivastava, Mater. Res. Express, 2019, 6, 056111 CrossRef CAS
.
- I. A. Auwal, H. Güngüneş, A. Baykal, S. Güner, S. E. Shirsath and M. Sertkol, Ceram. Int., 2016, 42, 8627–8635 CrossRef CAS
.
- G. F. Dionne, Magnetic oxides, Springer, New York, 2009 Search PubMed
.
- L. Néel, J. Phys. Radium, 1948, 9, 184–192 CrossRef
.
- W. F. Brown, Phys. Rev., 1941, 60, 139–147 CrossRef
.
- I. Ali, M. U. Islam, M. S. Awan, M. Ahmad, M. N. Ashiq and S. Naseem, J. Alloys Compd., 2013, 550, 564–572 CrossRef CAS
.
- N. Yasmin, S. Abdulsatar, M. Hashim, M. Zahid, S. Fatima Gillani, A. Kalsoom, M. Naeem Ashiq, I. Inam, M. Safdar and M. Mirza, J. Magn. Magn. Mater., 2019, 473, 464–469 CrossRef CAS
.
- G. A. Ashraf, L. Zhang, W. Abbas and G. Murtaza, Ceram. Int., 2018, 44, 18678–18685 CrossRef CAS
.
- N. Yasmin, M. Mirza, S. Muhammad, M. Zahid, M. Ahmad, M. S. Awan and A. Muhammad, J. Magn. Magn. Mater., 2018, 446, 276–281 CrossRef CAS
.
- N. Rezlescu, C. Doroftei, E. Rezlescu and P. D. Popa, J. Alloys Compd., 2008, 451, 492–496 CrossRef CAS
.
- M. J. Iqbal and S. Farooq, J. Alloys Compd., 2010, 505, 560–567 CrossRef CAS
.
- Z. Wu, R. Zhang, Z. Yu, L. Shan, L. Dong and X. Zhang, Ferroelectrics, 2018, 529, 120–127 CrossRef CAS
.
- M. khandani, M. Yousefi, S. S. S. Afghahi, M. M. Amini and M. B. Torbati, Mater. Chem. Phys., 2019, 235, 121722 CrossRef CAS
.
- Y.-M. Kang, Ceram. Int., 2015, 41, 4354–4359 CrossRef CAS
.
- Y. Yang, F. Wang, J. Shao, D. Huang, A. V. Trukhanov and S. V. Trukhanov, Appl. Phys. A, 2019, 125, 37 CrossRef
.
- Y. Yang, F. Wang, J. Shao, D. Huang, H. He, A. V. Trukhanov and S. V. Trukhanov, J. Alloys Compd., 2018, 765, 616–623 CrossRef CAS
.
- S. E. Shirsath, M. L. Mane, S. M. Patange, S. S. Jadhav and K. M. Jadhav, J. Phys. Chem. C, 2011, 115, 20905–20912 CrossRef
.
- M. Z. Shoushtari, S. E. M. Ghahfarokhi and F. Ranjbar, Adv. Mater. Res., 2012, 622–623, 925–929 Search PubMed
.
- B. A. Calhoun and M. J. Freiser, J. Appl. Phys., 1963, 34, 1140–1145 CrossRef CAS
.
- P. W. Anderson, Phys. Rev., 1950, 79, 705–710 CrossRef
.
- Y. J. Yang, X. S. Liu and F. J. Feng, Mater. Technol., 2014, 29, 188–192 CrossRef CAS
.
- F. M. Gu, W. W. Pan, Q. F. Liu and J. B. Wang, J. Phys. Appl. Phys., 2013, 46, 445003 CrossRef
.
- C. Singh, S. B. Narang, I. S. Hudiara, Y. Bai and K. Marina, Mater. Lett., 2009, 63, 1921–1924 CrossRef CAS
.
- J. Singh, C. Singh, D. Kaur, H. Zaki, I. A. Abdel-Latif, S. B. Narang, R. Jotania, S. R. Mishra, R. Joshi, P. Dhruv, M. Ghimire, S. E. Shirsath' and S. S. Meena, J. Alloys Compd., 2017, 695, 1112–1121 CrossRef CAS
.
- X. He, W. Zhong, S. Yan, C.-T. Au, L. Lü and Y. Du, J. Phys. Appl. Phys., 2014, 47, 235002 CrossRef
.
- T. L. Phan, N. Tran, H. H. Nguyen, D. S. Yang, N. T. Dang and B. W. Lee, J. Alloys Compd., 2019, 816, 152528 CrossRef
.
- P. M. Md Gazzali and G. Chandrasekaran, J. Mater. Sci.: Mater. Electron., 2014, 25, 702–709 CrossRef CAS
.
- I. Ali, M. U. Islam, M. S. Awan and M. Ahmad, J. Alloys Compd., 2013, 547, 118–125 CrossRef CAS
.
- J. Liu and X. Xue, Mater. Lett., 2016, 164, 579–582 CrossRef CAS
.
- A. D. Volodchenkov, S. Ramirez, R. Samnakay, R. Salgado, Y. Kodera, A. A. Balandin and J. E. Garay, Mater. Des., 2017, 125, 62–68 CrossRef CAS
.
- G. A. Al-Garalleh, I. Bsoul, Y. Maswadeh, E. Al-Hwaitat and S. H. Mahmood, Appl. Phys. A, 2019, 125, 467 CrossRef CAS
.
- K. Alamelu Mangai, S. K. Tamizh and M. Priya, J. Supercond. Novel Magn., 2020, 33, 713–720 CrossRef
.
- Z. F. Zi, Y. P. Sun, X. B. Zhu, Z. R. Yang, J. M. dai and W. H. Song, J. Magn. Magn. Mater., 2008, 320, 2746–2751 CrossRef CAS
.
- V. Harikrishnan, R. E. Vizhi, D. Rajan Babu and P. Saravanan, J. Magn. Magn. Mater., 2018, 448, 243–249 CrossRef CAS
.
- F. Tran, P. Blaha, K. Schwarz and P. Novák, Phys. Rev. B: Condens. Matter Mater. Phys., 2006, 74, 155108 CrossRef
.
- B. C. Brightlin and S. Balamurugan, J. Supercond. Novel Magn., 2017, 30, 215–225 CrossRef CAS
.
- M. A. Almessiere, Y. Slimani and A. Baykal, Ceram. Int., 2018, 44, 9000–9008 CrossRef CAS
.
- I. A. Auwal, A. Baykal, S. Güner, M. Sertkol and H. Sözeri, J. Magn. Magn. Mater., 2016, 409, 92–98 CrossRef CAS
.
- G. A. Ashraf, L. Zhang, W. Abbas and G. Murtaza, Curr. Appl. Phys., 2019, 19, 506–515 CrossRef
.
| This journal is © The Royal Society of Chemistry 2020 |

