 Open Access Article
Synthesis and application of tuneable carbon–silica composites from the microwave pyrolysis of waste paper for selective recovery of gold from acidic solutions†
Konstantina Sotirioua,
Nontipa Supanchaiyamat b,
Tengyao Jianga,
Intuorn Janekarnb,
Andrea Muñoz Garcíaa,
Vitaliy L. Budarina,
Duncan J. MacQuarrie
 a and
Andrew J. Hunt
 *b
*b
aDepartment of Chemistry, University of York, Heslington, York, YO10 5DD, UK
bMaterials Chemistry Research Center, Department of Chemistry, Center of Excellence for Innovation in Chemistry, Faculty of Science, Khon Kaen University, Khon Kaen, 40002, Thailand. E-mail: andrew@kku.ac.th
First published on 2nd July 2020
Abstract
Microwave pyrolysis bio-oil from waste paper and K60 silica gel has successfully been utilised to synthesise mesoporous carbon–silica composites with uniquely tuneable surface properties, where functionality and structural characteristics can be altered and even enhanced by curing at different temperatures. This temperature-dependence resulted in composites ranging from highly oxygenated polymerised bio-oil composites at 300 °C to aromatic carbonaceous materials covering the silica surface at 800 °C, making them attractive materials for gold recovery from mining wastewater. The composite materials exhibit exceptional ability and selectivity to recover gold from dilute solutions. Metal adsorption on the surface of these composites proceeded via both chemisorption and physisorption leading to the reduction of Au(III) to Au(0), resulting in high recovery capacities for gold. Composite material prepared at 500 °C demonstrated the optimum combination of surface functionality and porosity, allowing for an adsorption capacity of 320 mg g−1 of gold and with 99.5% removal being achieved at concentrations mimicking those of real-life mine tailing wastes. All materials pioneered in this research display great potential as selective adsorbents for the recovery of gold from acidic media.
Introduction
Climate change and depleting fossil resources have created a shift towards sustainable methods for producing energy, including wind turbines and photovoltaics to name a few, many of which are reliant on the use of critical elements.1 Concerns over elemental sustainability and the future availability of elements such as gold, coupled with the growing demand, and low substitutability of gold, have led to fears over the security of its supply.2 Gold holds various uses in the electronic and electrical industries, medical applications, chemical catalysis and the manufacture of jewellery, due to its exceptional chemical and physical properties.3–5 Gold Demand Trends (Gold World Council) published a document in 2016 which presented the 5 year average demand for gold at 1123.4 tonnes, with the year-on-year demand increasing by 15%, however also highlighting that the current rates of production fall short of this demand.6Disposal of electronic waste, emissions from chemical processes and mining practices can lead to high levels and fast distribution rates of metal ions in the surrounding water and soil streams.7 As a result of this release and leaching of metal ions, secondary aqueous waste streams are generated, and the extent of contamination cannot be controlled or fully assessed.8 Given that water consumption is dramatically increasing due to population growth and the expansion of industrial processes, while the supply sources remain constant, applying green technologies to treat such wastes is key.9 Treatment of contaminated acidic waste streams to remove gold, holds a great potential with respect to developing recovery technologies for this element, whilst also aiding in water decontamination. Such technologies are vitally needed for elemental recovery from acidic mine drainage and acidic gold containing waste streams from electronics recycling.
Conventional methods implemented for metal removal and recovery are mechanical processes, such as electrodeposition, ion exchange, solvent extraction and chemical precipitation.10–12 Such mechanical techniques have been extensively investigated due to their adaptability and relative ease of execution. However, they can be costly, highly energy and labour intensive, and in addition offer poor efficacy in low metal concentrations.13–15 Researchers have therefore studied alternative methods based on physical principles of recovery and decontamination, focusing on adsorption.16,17 It has been proven that these physical techniques are more effective, faster and with lower operating costs in comparison to the conventional methods.4,17 Adsorbent materials most commonly investigated and used are porous materials, such as activated carbons and templated silicas.18–21 Due to their porosity, they hold the ability to interact with atoms, ions and molecules not only on their surfaces, but throughout their bulk, making adsorption an attractive option for metal recovery.22–24
Activated carbons are the popular choice due to their high surface area, microporous structure, and high adsorption capacity, as well as being cost effective.16 Nonetheless, their lack of selectivity, especially towards metals, and poor mechanical strength are significant disadvantages.25,26 Templated silicas on the other hand, exhibit good mechanical stability and hold uniform pore structures allowing for better mass transfer. They, too, lack selectivity, as well as having low adsorption capacities and high costs associated with their production.24,27 As a result, alternative adsorbent materials are being sought to combine the virtues of both to be efficient and effective adsorbents. Mesoporous carbon–silica composites (CSCs) are one such class of materials which combine the properties of both carbon and silica.
Incorporating carbon onto the walls of silica can lead to the production of a carbonaceous material which is mechanically robust and demonstrates chemical characteristics of the parent silica and carbon.28,29 This clean and economical synthesis of CSCs enables appropriate control over both the porosity and the aromatic content or functionality of the carbon surface. As a result, these porous composites offer great opportunities for a variety of potential applications, including adsorption and separation technologies. While any carbon source can be utilised in the production of CSC, from a cost perspective it is preferential to utilise bio-based wastes. Cost-effective substitutes to templated silica materials can be developed through the utilisation of waste biomass and low-cost amorphous silicas, such as K60.
Paper recycling can only take place a finite number of times due to the degradation and reduction in cellulose fibre length that occurs during the recycling process. As such, significant quantities of low value waste paper are available for valorisation. Waste office paper at its end-of-life is therefore an attractive bio-based carbon source for the production of composites. Use of renewable wastes not only promotes a bio-based economy but coupled with metals recycling could be an important aspect of a circular economy. Several studies have already focussed on the use of pyrolysis for the valorisation of cellulose or waste paper.30–33
Pyrolysis is a process that is widely applied within the waste management sector and in waste treatment and specifically for cellulose utilisation. Three main classes of products are generated during the thermal decomposition of the paper: biogas, char and bio-oil.34 Development of a biorefinery based on the paper-waste requires the usage of all these three components. The biogas usually burns in the pyrolysis process giving energy. The biochar obtained in pyrolysis has established industrial applications as good fuel, precursors of activated carbon or as a soil fertiliser.35,36 However, at the moment, there is no industrial application for the bio-oil. The calorific value of the bio-oil is typically below 22 kJ g−1 and it cannot be used as an efficient fuel.37 Furthermore, due to its high complexity, the separation of bio-oil to high-value chemicals is a challenge. Therefore, one of the main goals was to convert bio-oil from pyrolysis waste into a high-value commodity. The manuscript demonstrates that we can transfer low-cost bio-oil to high-value mesoporous materials in one single heating step establishing the potential for waste paper-based biorefinery.
Herein, the synthesis of CSC has been achieved utilising bio-oil from the microwave pyrolysis of waste office paper at its end-of-life to yield promising composite materials for the recovery of critical elements, focusing on gold. Results of this work provide clear evidence that these bio-derived composite materials exhibit both high adsorption capacities and specific affinity towards gold, even with very dilute solutions of this metal.
Experimental section
Chemicals
Amorphous silica gel (K60) with average particle size of 0.040–0.063 mm was purchased from Sigma-Aldrich. Gold(III) chloride 64.4% min was purchased from Alfa Aesar. Analytical grade solvents including acetone and ethanol, as well as 0.1 M HCl used for adsorption studies and ICP-OES sample preparation, were purchased from Fisher Scientific. All chemicals were used as received.Bio-oil production via microwave pyrolysis
Recycled office paper was mixed with de-ionised water, pressed into blocks and left to dry in an oven at 50 °C for 48 hours. Blocks were cut up into smaller pieces (5 cm × 5 cm × 5 cm), and placed into the microwave reactor vessel until half of its volume was occupied (approximately 150 g of paper blocks).A Milestone ROTOSYNTH Rotative Solid Phase Microwave Reactor (Milestone Srl., Italy) fitted with a vacuum pump was used to prepare the bio-oil. The contents of the vessel were heated at 40 °C and 800 W for 4 minutes and then to 200 °C and 1200 W for 8 minutes, under vacuum at all times. The viscous brown pyrolysis oil was collected in a flask outside the microwave cavity (further details can be found in ESI†).
Carbon–silica composite production
Bio-oil (20 g) was mixed with silica K60 (20 g) in acetone (50 mL), and was left stirring overnight at room temperature. The mixture was carbonised in the furnace under nitrogen flow (heating rate 5 °C min−1, hold time 10 minutes) at three different temperatures (300 °C for CSC300, 500 °C for CSC500, 800 °C for CSC800).Materials characterisation
N2 adsorption/desorption isotherms, surface area and porosimetry measurements were obtained at 77 K, using a MICROMERITICS ASAP 2020 analyser. Transmission electron microscopy images (TEM) were taken using a TECNAI G12 Bio-Twin microscope. Scanning electron microscopy (SEM-EDX) images were taken using a Helios Nanolab G3 CX (FEI) – Focused Ion-Beam scanning electron microscope. Thermo gravimetric analysis was carried out using a Netzsch 409 thermal analyser and a PL Thermal Sciences STA 625. Infrared analysis was carried out using an EQUINOX 55 FTIR. ICP-OES analysis of the sample solutions was carried out using a PerkinElmer Optima 5300 DV instrument. Elemental analysis based on carbon, hydrogen and nitrogen content was carried out using an Exeter analytical CE440 elemental analyser.Initial adsorption tests
Chloride salts of Ni, Cu, Zn, Pd, Pt and Au were dissolved in 0.1 M HCl (pH 3) (Au: 133.9 mg L−1, Pt: 0.32 mg L−1, Pd: 108.7 mg L−1, Ni: 93.9 mg L−1, Cu: 94.9 mg L−1, Zn: 90.6 mg L−1). To a 20 mL vial containing 10 mL of metal salt solution, 10 mg of adsorbent material was added and stirred for 24 hours at room temperature. Both the solution and solid were retained for further analysis.Gold adsorption
All CSCs were used as adsorbents to recover gold from acidic solutions in batch contact processes. Six different concentrations of gold(III) solution were prepared by dissolving AuCl3 in 0.1 M HCl (pH 3) (500 mg L−1, 300 mg L−1, 150 mg L−1, 100 mg L−1, 50 mg L−1 & 25 mg L−1). All concentrations were tested (10 mL) with 10 mg of each material separately. The adsorption mixtures were left to stir for 24 hours at room temperature. Both the solution and solid were retained for further analysis.Results and discussion
Microwave pyrolysis
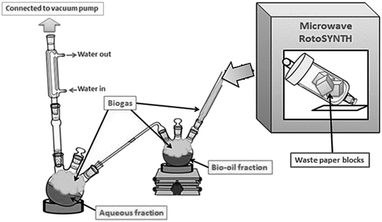
Microwave-assisted pyrolysis of waste paper takes place at 180–200 °C, which is more than 150 °C lower than conventional pyrolysis. This demonstrated that microwave-assisted pyrolysis as a very promising, energy-efficient method for the valorisation of waste biomass and renewable resources.38–40 Indeed, preliminary energy balance calculations based on the thermodynamic properties of the structural components of biomass during the decomposition process indicated an energy requirement of 1.8 kJ g−1 for microwave pyrolysis compared to 2.7 kJ g−1 for conventional thermal pyrolysis. The calculation was proved with large-scale MW pyrolysis experiments.41 Pyrolysis was carried out utilising a system previously published by Zhang et al. (Fig. 1). The method enables the simultaneous separation and isolation of bio-oil (tar) from an aqueous fraction.37 The resulting yields of char, bio-oil (tar), gas and water were 39%, 24%, 21% and 16% respectively. These yields were consistent with previously published work.37 The composition of the bio-oil included anhydrosugars, carboxyl compounds, carbonyl containing compounds and aromatic compounds.28,37,42,43 This complex bio-oil mixture of hundreds of organic compounds was similar to other oils generated through microwave pyrolysis of paper and cellulose.28,37,43 A ratio of 1![[thin space (1/6-em)]](https://www.rsc.org/images/entities/char_2009.gif) :
:![[thin space (1/6-em)]](https://www.rsc.org/images/entities/char_2009.gif) 1 bio-oil to silica was utilised to ensure uniform coverage of the surface, while not leading to blocking of the porous structure.28 The organic bio-oil fraction was added to a minimal quantity of acetone prior to coating of the silica and carbonisation took place with a ramp rate of 5 °C min−1 and then held for 10 minutes at the required temperature.
1 bio-oil to silica was utilised to ensure uniform coverage of the surface, while not leading to blocking of the porous structure.28 The organic bio-oil fraction was added to a minimal quantity of acetone prior to coating of the silica and carbonisation took place with a ramp rate of 5 °C min−1 and then held for 10 minutes at the required temperature.
Temperature-dependence: effect on textural properties
The temperature and durations for the functionalisation of silica with bio-oil were chosen based on well-established technology for the production of mesoporous functionalised materials.44 It has been shown that the functionality of carbonaceous materials go through three dramatic steps around 300 °C, 500 °C and 800 °C, which are independent of the precursor.45The textural properties of silica K60 and CSC materials obtained from N2 adsorption/desorption porosimetry are illustrated in Table 1. BET surface area, pore volume and pore diameter of CSC300 and CSC500 are lower than the parent silica due to the introduction of carbon into the silica surface and within the pores.
| Material | BET surface area (m2 g−1) | Pore volume (cm3 g−1) | Pore diameter (nm) | Carbon layer thickness (nm) | C wt% |
|---|---|---|---|---|---|
| Silica K60 | 467 | 0.80 | 6.7 | — | — |
| CSC300 | 321 | 0.32 | 4.4 | 1.15 | 45.3 |
| CSC500 | 380 | 0.39 | 4.5 | 1.10 | 40.3 |
| CSC800 | 1056 | 1.22 | 4.8 | 0.95 | 36.6 |
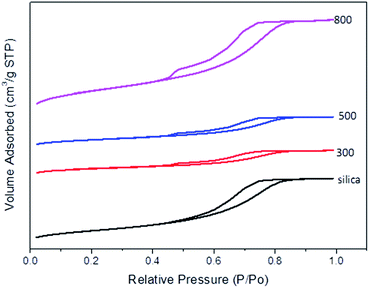
Introduction of organic matter into silica pores does not affect the pore shape significantly as demonstrated by the similar isotherms and hysteresis loops of both the CSCs and the parent silica K60 (Fig. 2). N2 adsorption/desorption isotherm illustrate a typical type-IV isotherm plot with a gradual rise in adsorption branch during capillary condensation for silica K60 and the CSCs, which is indicative of mesoporosity.46 This demonstrates that the polymerised bio-oil is evenly distributed within the pores. A significant reduction in pore volume from 0.8 cm3 g−1 in silica K60 to 0.32 cm3 g−1 was observed in CSC300.
As the carbonisation temperature increases to 500 °C, BET surface area, pore volume and diameter marginally increase, due to shrinkage in the carbon-rich layer. Interestingly, CSC800 exhibits a much larger surface area and pore volume than the parent silica and other CSC materials (Table 1). These textural changes of the materials are likely to be due to the loss of some carbon from within the pores and the subsequent formation of a more porous carbonaceous layer on the silica surface. This bio-oil decomposition is consistent with the rapid release of gas (including CO2, CO and H2O) that takes place with an increase in temperature from 500 °C to 800 °C (Fig. 3). The decomposition process leads to the formation of a highly aromatic porous carbon composite with surface areas of 1056 m2 g−1 for CSC800. These results are consistent with other CSC materials reported in the literature.28 The resulting material may be described as being comparable to a porous carbon on the silica pore walls. SEM-EDX data (Fig. 4) demonstrate a uniform coverage of carbon over the K60 silica framework of the CSC500. The thickness of the bio-oil film can be estimated from porosimetry data. As expected, this decreases relative to the carbonisation temperature, thus leading to the formation of an aromatic carbonaceous layer. The development of a highly aromatic structure at 800 °C is in good agreement with XPS (Fig. 5) and porosimetry data that exhibit an increase in pore volume and diameter (Table 1).
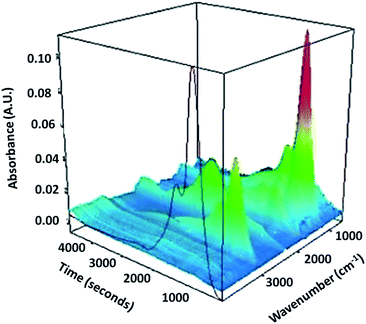 | ||
| Fig. 3 3D TG-IR spectrum of the off-gases from thermal treatment of the uncarbonised sample heated at 10 °C min−1. | ||
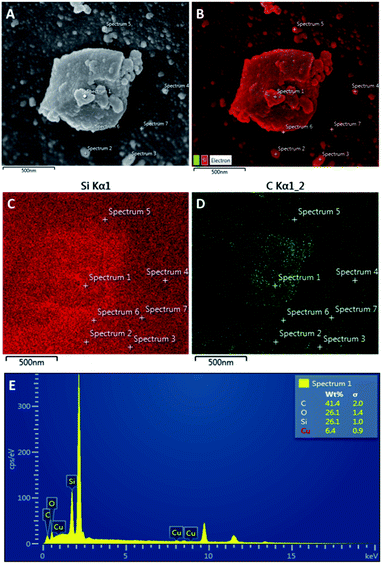 | ||
| Fig. 4 SEM images of (A) CSC500, (B) SEM-EDX mapping of carbon and silica on CSC500, (C) EDX mapping of Si, (D) EDX mapping of (C and E) chemical composition at spectrum 1. | ||
Greater poly-aromatic character was observed at higher temperatures of preparation, however future work will further investigate these materials to determine if the carbon layers are graphitic in nature. The uniform coverage of carbon over the K60 silica framework of the CSC500 is supported by EDX data that demonstrates the carbon layer is constant across the different mapping sites of CSC500 (Fig. 4). This result is also consistent across all larger particles in CSC materials (SEM-EDX for CSC300, CSC500 and CSC800 are represented in the ESI†).
All materials appear to have a variation in size and shape distribution of particles. CSC300 and CSC800 consist of a combination of larger and smaller particles. In contrast, CSC500 appears to contain a significant proportion of larger pieces.
A possible reason for the difference in size of particles in CSC materials is due to mechanical grinding of the CSCs. The abrasive forces generated between the elliptical magnetic stirrer bar and the round bottom flask led to fracturing of some silica particles in CSC300 and CSC800. Such a postulation is backed up by SEM-EDX data that indicate that the small particles in both the 300 °C (CSC300) and 800 °C (CSC800) contain a higher silica content, consistent with the fracturing of some silica particles (Fig. S11 and S15 in ESI†). Limited fracturing or mechanical grinding was observed for the CSC500 materials, demonstrating the superior mechanical properties of the CSC prepared at 500 °C. SEM-EDX demonstrated a significant coverage of oxygen containing species in the CSC300 sample (consistent with XPS and IR data). The content of oxygen diminishes with increasing temperature of preparation (Table 2).
| % Atomic content | |||
|---|---|---|---|
| C | Si | O | |
| CSC300 | 51.0 | 15.6 | 33.4 |
| CSC500 | 55.1 | 14.1 | 30.8 |
| CSC800 | 59.7 | 12.2 | 28.1 |
| % Atomic content | ||
|---|---|---|
| C/O ratio | C/Si ratio | |
| CSC300 | 1.53 | 3.27 |
| CSC500 | 1.79 | 3.99 |
| CSC800 | 2.12 | 4.89 |
Temperature-dependence: effect on surface functionality
It is clear from the 3D TG-IR plot (Fig. 3), that there is a significant signal located at 1082 cm−1, which is ascribed to C–O–C groups, possibly due to the presence of decomposition products of saccharides. Another characteristic signal at 2979 cm−1 can be assigned to –CH stretching vibrations, indicating the presence of sp3 hybridised –CHn groups. Although the intensities of these signals are decreasing from 160 °C onwards, they can be detected until 400 °C, indicating the sample still contains these components before 400 °C. An absorbance at 1807 cm−1 could be attributed to the carbonyl group associated with anhydrides, suggesting that these groups are released at this temperature.47 The fact that there is second band close to 1807 cm−1 is further evidence of the presence of anhydrides. A sharp peak at 877 cm−1 can be ascribed to a bending vibration of methylene groups.The minor absorption at 2350 cm−1 should be attributed to the vibrations of CO2, compared to the standard IR spectrum of carbon dioxide. As the temperature is increased to yield the highest temperature material CSC800, the polymer undergoes further decomposition or carbonisation, during which the rapid release of gases, including CO2 and CO are evolved. The theory is supported by TG-IR data, which demonstrate a clear release of such gases at 550 °C (Fig. 3), and porosimetry data. This rapid release of gases leads to the significant additional porosity throughout the composite material. These observations are exciting, as they demonstrate the formation of temperature-dependent composite materials that have tuneable structural and textural properties.
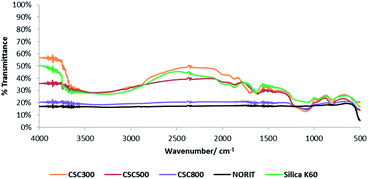
DRIFT spectra of the CSCs (Fig. 6), illustrate that increasing carbonisation temperature results in the decomposition of organic matter and a change in the functional groups present, shifting from an aliphatic and polar oxygenated coated surface to a more aromatic carbon layer. The carbonisation temperature-dependence of CSCs holds great potential for the development of tuneable properties as it enables the continuum surface functionality of the material from hydroxyl and carbonyl rich surfaces at 300 °C to carbonaceous aromatic surfaces at 800 °C.28 Aliphatic C–H stretching observed between 2900–2974 cm−1 and C![[double bond, length as m-dash]](https://www.rsc.org/images/entities/char_e001.gif) O stretching at 1650 cm−1 are due to the presence of oxygenated compounds like carboxylic acids, ketones, aldehydes and esters, resulting from the original components of the bio-oil.37
O stretching at 1650 cm−1 are due to the presence of oxygenated compounds like carboxylic acids, ketones, aldehydes and esters, resulting from the original components of the bio-oil.37
These absorbance bands, as well as the O–H stretch at 3500 cm−1, are evident in the spectrum of CSC300 as expected, but weaken and disappear as temperature increases to 500 °C and then 800 °C. Above 500 °C, the hydroxyl group is reduced significantly due to the dehydration and decomposition of polysaccharide residues, as well as the crosslinking of silanols in the material. Spectra for all CSCs show stretching bands at 1060 cm−1 and 800 cm−1 corresponding to Si–O–Si bonds, confirming the presence of the silica substrate in the composite materials and the changes on the carbonaceous part of the structure.48
The C, O and Si elemental content of the CSCs surface as measured by XPS is presented in Table 2. Comparing % C with CHN analysis (Table 3), indicates that carbon is concentrated on the surface of the material, with the overall amount throughout the bulk being lower.
| Material | % C | % H | % N | % Rest |
|---|---|---|---|---|
| Waste paper bio-oil | 48.9 | 7.5 | — | 43.6 |
| Uncarbonised material | 48.7 | 7.2 | — | 44.1 |
| CSC300 | 45.3 | 6.2 | — | 48.4 |
| CSC500 | 40.3 | 5.6 | — | 53.8 |
| CSC800 | 36.6 | 4.3 | — | 56.1 |
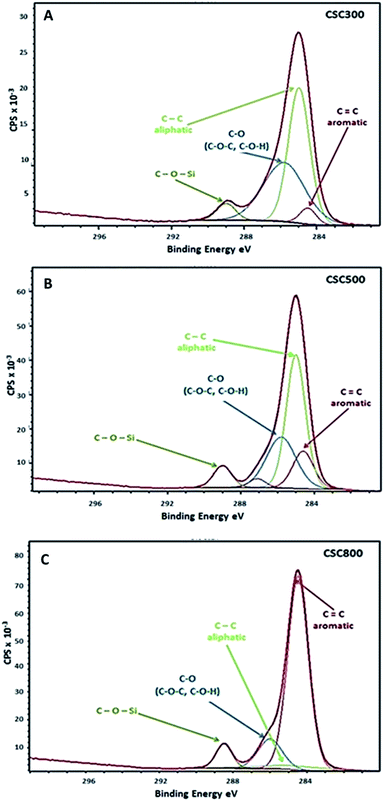
XPS data show that with increasing carbonisation temperature, % C content on the surface of the CSCs slightly increases, whereas % O and % Si decrease. These results are in good correlation with DRIFT data of the materials, as a significant loss in the proportion of hydrophilic compounds containing oxygen is observed on heating to higher temperatures. Oxygen is still present in all CSCs, and it facilitates the interaction between the polymerised bio-oil and the silanol groups in silica to give rise to the observed C–O–Si bonds as observed by XPS (Fig. 5). Four contributions can be identified due to: C![[double bond, length as m-dash]](https://www.rsc.org/images/entities/char_e001.gif) C groups (aromatic), C–C groups (aliphatic), C–O groups (C–O–C or C–O–H) and C–O–Si group at 284.4 eV, 284.6 eV, 285.8 eV and 288.9 eV binding energies, respectively.28,49,50 XPS and DRIFT data are in good correlation, confirming the shift from aliphatic and more polar hydroxyl character which predominates in CSC300 material, to aromatic character observed in CSC800 material.
C groups (aromatic), C–C groups (aliphatic), C–O groups (C–O–C or C–O–H) and C–O–Si group at 284.4 eV, 284.6 eV, 285.8 eV and 288.9 eV binding energies, respectively.28,49,50 XPS and DRIFT data are in good correlation, confirming the shift from aliphatic and more polar hydroxyl character which predominates in CSC300 material, to aromatic character observed in CSC800 material.
Gold selectivity
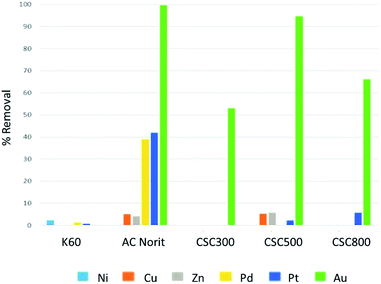
Initial batch adsorption experiments with a mixture of metals in solution, demonstrated these CSC materials exhibited significant promise for the selective recovery of gold from an acidic solution containing nickel, copper, zinc, palladium, platinum and gold in similar concentrations (Fig. 7). On CSC materials significant preference was demonstrated to those metals with greater reduction potentials. In contrast Norit activated carbons demonstrated significant adsorption of all elements.Silica K60 demonstrated poor adsorption of all elements, while the activated carbon Norit showed significant adsorption of these metals, yet poorer selectivity. In the case of the CSCs, the adsorption of gold is predominately controlled by surface functionality and the reduction of Au(III) to Au(0) on the surface. Therefore, the CSC materials demonstrated a balance between reduction and adsorption, resulting in high selectivity towards gold. All three CSC materials show exceptional gold recovery, with the best being the CSC500. The CSC500 has a combination of a highly uniform carbon layer on the K60 and the surface functionality (Fig. 4 and 5), which leads to enhanced reduction properties of the carbonaceous film and therefore adsorption capacity towards gold.
Mechanism of gold adsorption
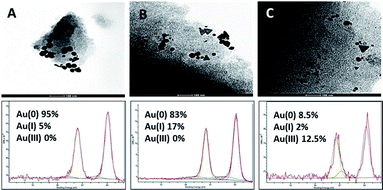
The mechanism relating to gold adsorption involves a chemisorption process, during which Au3+ species are reduced mainly to elemental gold, alongside traditional physisorption taking place (Fig. 5A). In the gold(III) chloride solutions, gold occurs as [AuCl4]−1 anion complex.51,52 The high affinity of the carbonaceous surface of CSCs for Au(III) is therefore likely to be due to the high standard electrode potential of the [AuCl4]−1/Au0 couple, E°[AuCl4]−1/Au0 = 1.00 V, and the similarly high reduction potential, E°[AuCl4]−1/[AuCl2]−1 = 0.93 V for the reduction to Au1+, via this reduction–adsorption mechanism.18,25,51–55 This mechanism allows for the creation of vacancies on the surface of the material as the reduced species deposits, which leads to higher uptake of the metal from solution and increased adsorption capacity of the adsorbate surface.XPS data was obtained for CSCs samples after adsorption with different concentrations of AuCl3 (50 mg L−1 & 300 mg L−1 for CSC300 and CSC800; 50 mg L−1, 150 mg L−1 & 300 mg L−1 for CSC500). Deconvolution of Au4f (7/2, 5/2) spectra exhibits three possible doublets, in which the two peaks within the doublet are 3.7 eV apart.56 The main doublet was found at 84.6 eV and corresponds to metallic Au(0) confirming the reduction of the [AuCl4]−1 species. The other two doublets at 86.1 eV and 86.6 eV relate to Au+ and Au3+, respectively. XPS spectra for all CSCs demonstrated that metallic Au(0) was detected on the surface of the materials after adsorption. This is in good agreement with the reduction–adsorption mechanism, further demonstrating the preference of the carbonaceous nature of the materials towards gold. This result also highlights the importance of tuning surface functional groups to enhance any reduction process.
Gold adsorption isotherms
Detailed adsorption studies of gold on the CSCs show that % gold removal from the chloride solution is concentration dependent at constant pH (Fig. 8B). Previous research has indicated that the adsorption of gold is higher at acidic pH, with its highest adsorption capacity observed in the presence of hydrochloric acid (pH 3), hence the choice of pH for this set of experiments.18,57 The CSC materials are significantly mesoporous, containing negligible amount of micropore. Therefore it is doubtful that they can adsorb protons and change the pH of solutions. Two additional experiments with independent batches of CSC materials were carried out to prove this hypothesis. During the gold adsorption process, the solution pH was changed insignificantly from 3.0 to 2.9.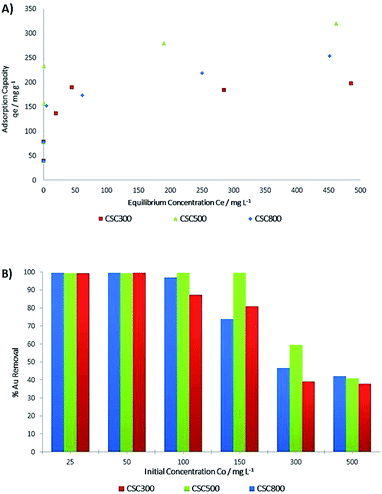 | ||
| Fig. 8 (A) Adsorption isotherms for CSC300, CSC500 & CSC800 at room temperature. (B) % Gold removal for CSC300, CSC500 & CSC800 at room temperature. | ||
ICP-OES analysis was used to determine the adsorption capacity and % gold removal for all CSCs. Fig. 8A and B demonstrate an increase in adsorption capacity and over 98% removal of gold with gold concentrations below 100 mg L−1, and a plateauing of adsorption is observed at concentrations more than 150 mg L−1, with values dropping to less than 60% removal. Adsorption plots (Fig. 8A) show a pattern, suggesting two different adsorption mechanisms, both of which occur in all CSCs. Initially, at the lower concentrations, significant adsorption is observed, resulting in the sharp increase in the adsorption curves (Fig. 8A). The very high % removal of gold (Fig. 8B) along with XPS data led to the hypothesis of irreversible chemisorption taking place as it is being adsorbed on the active sites of the material via its reduction to its inert elemental state.58 Adsorption in the higher concentration regions is speculated to follow a different mechanism with reversible physisorption, suggesting that gold is present as Au(III) ions, as hinted by Au4f XPS spectra.
TEM of the CSC samples after adsorption was used confirm the presence of gold nanoparticles produced through the reduction of gold during the chemisorption phase of the adsorption process (Fig. 9). These results are in good agreement with XPS that suggests that Au3+ has been reduced to Au+ and mainly to metallic gold Au(0). Both techniques confirm the initial speculation that gold is reduced via a chemical reaction during the adsorption process.
Adsorption models have been applied to determine the model with the best correlation factor R2 (Table 4). Plots show a strong correlation with Langmuir type adsorption after the suggested irreversible chemisorption has taken place. The model assumes monolayer adsorption within the adsorbent active sites and once all sites are occupied, the adsorption stops. Adsorption data are fitted in the linear Langmuir equation:
| Isotherm parameters | CSC300 | CSC500 | CSC800 |
|---|---|---|---|
| qe (mg g−1) | 196.97 | 320.32 | 265.90 |
| Langmuir | |||
| αL (L mg−1) | 0.23 | 0.24 | 0.09 |
| KL (L g−1) | 39.37 | 57.80 | 21.37 |
| Qo (mg g−1) | 169.50 | 242.20 | 232.60 |
| R2 | 0.9988 | 0.9953 | 0.9924 |
![[thin space (1/6-em)]](https://www.rsc.org/images/entities/char_2009.gif) |
|||
| Freundlich | |||
| Kf | 68.76 | 124.18 | 78.12 |
| n | 6.11 | 7.27 | 5.34 |
| R2 | 0.8205 | 0.7934 | 0.8607 |
![[thin space (1/6-em)]](https://www.rsc.org/images/entities/char_2009.gif) |
|||
| D–R | |||
| qm (mol g−1) | 155.73 | 237.94 | 187.24 |
| K′ × 10−8 (mol2 J−2) | 6 | 7 | 7 |
| E (kJ mol−1) | 2.89 | 2.67 | 2.67 |
| R2 | 0.9200 | 0.9518 | 0.9273 |
| Langmuir isotherm parameters | CSC300 | CSC500 | CSC800 |
|---|---|---|---|
| αL (L mg−1) | 0.232 | 0.239 | 0.092 |
| KL (L g−1) | 39.4 | 57.8 | 21.4 |
| Qo (mg g−1) | 170 | 242 | 233 |
| R2 | 0.999 | 0.9950 | 0.992 |
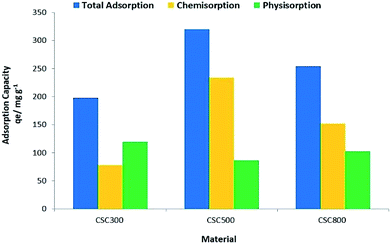
Experimental values for maximum adsorption capacity qe (Fig. 10), show that CSC500 is the best adsorbent material with an adsorption capacity of 320 mg g−1, enabling nearly complete recovery of gold (>99%) at lower concentrations. CSC300 and CSC800 have comparably high maximum surface coverage values of 197 mg g−1 and 266 mg g−1 respectively, and both attain exceptional recovery of gold (>99%) at the low concentrations of 25 mg L−1 and 50 mg L−1. Calculated values for maximum adsorption capacity (Qo) though, according to the Langmuir model, differ to the experimental values qe for all materials (Table 5).
The discrepancies in experimental and calculated values relate to the nature of adsorption taking place. Qo accounts only for the monolayer saturation capacity of the material owing only to reversible physisorption, whereas actual experimental value qe expresses the total capacity owing to both the chemisorption and physisorption capacities. Thus, with greater extent of chemisorption in the system, there is greater disagreement between Qo and qe (i.e. for CSC300 Qo = 170 mg g−1 but qe = 197 mg g−1, for CSC500 Qo = 242 mg g−1 but qe = 320 mg g−1 and CSC800 Qo = 233 mg g−1 but qe = 266 mg g−1).
The high qe values can be attributed to the optimum balance between surface functionalities of the material and the significant porosity retained by the parent silica framework, dictating the extent of physisorption and chemisorption.18 CSC500 appears to have the highest chemisorption out of the three materials (Fig. 10), suggesting that the carbon layer has a unique surface structure allowing for greater reduction ability of the material. Whereas, CSC300 and CSC800 hold a more equal propensity for physisorption and chemisorption, respectively, speculating that the reducing ability of the material is lower as surface functionalities amongst the three materials differ, and hence their subsequent adsorption capacity also varies.
Several studies have focussed on the development of adsorbents for the recovery or removal of Au3+ species from aqueous waste streams.3,54,61–67 Table 6 demonstrates the range of bio-based materials being developed for gold recovery. It can be observed that CSC500 materials demonstrate excellent performance with an adsorption capacity of 320 mg g−1. This value is greater than a significant number of the materials previously reported in the literature (Table 6).
| Adsorbent material | Species | Adsorption capacity (mg g−1) | Reference |
|---|---|---|---|
| CSC500 | Au(III) | 320 | This work |
| Alfalfa | Au(III) | 293 | 61 |
| Glycine modified crosslinked chitosan resin | Au(III) | 170 | 3 |
| De-alginated seaweed waste | Au(III) | 197 | 62 |
| Buckwheat hulls | Au(III) | 297 | 63 |
| Rice husk carbon | Au(III) | 150 | 64 |
| Bagasse ashes | Au(III) | 324 | 65 |
| Rice hull ash | Au(III) | 93.5 | 66 |
| MCM-41 | Au(III) | 0 | 54 |
| NH2-MCM-41 | Au(III) | 276 | 54 |
| Coconut shell activated carbon | Au(III) | 100 | 67 |
| Peach stone activated carbon | Au(III) | 73 | 67 |
Regeneration and reuse of materials is an important aspect of developing sustainable materials for gold recovery or remediation. This property is yet to be tested but as a significant proportion of the removed gold is achieved through reduction to Au(0) leaching with strong acids or burning off the carbon material would be required for gold recovery. Both of these processes will have a detrimental effect on the carbon layer and lead to reduced adsorption capacities, although neither should affect the silica. Importantly, it has recently been demonstrated that the use of recovered metals on carbons as supported catalysts can be worth up to 10 times the value of recovered metal.68 As such future work will focus on the use of these materials post adsorption as heterogeneous gold catalysts.
Conclusion
This work demonstrates the exceptional ability of the mesoporous bio-derived CSCs derived from microwave pyrolysis oil of waste paper and K60 silica gel to selectively recover significant amounts of gold even at low concentrations. The materials possess combined advantages including the use of low-cost waste feedstock, high selectivity (comparable to that of activated carbons) and improved capacity; which exceed that of parent silicas and demonstrate enhanced selectivity over activated carbons. These virtues coupled with their tuneable functionality and surface properties, and good thermal stability, makes them attractive alternatives to existing adsorbents for water decontamination. All three composite materials developed exhibit unusually high % removal of gold at the lower concentration solutions (>99%), making them ideal for gold recovery from acidic mining waste, where trace concentration of metals are usual, and also acidic solutions containing gold from the processing or recycling of electronic wastes. Even though all three materials are extremely selective towards gold, CSC500 appears to be the best with over 99.5% removal for solutions between 25–150 mg L−1. The highly efficient recovery is attributed to the unique surface structure promoting both chemisorption and physisorption. The materials pioneered in this research have great potential as adsorbents to overcome current problems with non-selective gold adsorption from dilute aqueous media. The highly selective recovery of gold may also be a benefit and enable the resulting adsorbed materials to be used as gold supported heterogeneous catalysts for chemical synthesis.Conflicts of interest
There are no conflicts to declare.Acknowledgements
This work was financially supported by the young researcher development project of Khon Kaen University. Additional funding was kindly provided by the young researcher development project of the Faculty of Science, Khon Kaen University. Nontipa Supanchaiyamat and Duncan Macquarrie would like to thank the financial support of the Newton Mobility Link, Royal Society (NI150336 – Green production of bio-derived materials from waste for water purification in Thailand) and OHEC Thailand. The authors would like to thank Dr Meg Stark for assistance with SEM imaging (Biology Department, University of York), Dr Graeme McAllister for CHN analysis (Chemistry Department, University of York), Dr Lorna Eades for ICP-OES analysis (School of Chemistry, University of Edinburgh) and NEXUS for XPS analysis (School of Mechanical and Systems Engineering, University of Newcastle). Further thanks to Dr Thomas Attard and Rachel Davies (Chemistry Department, University of York) for their assistance in preparation of this manuscript.Notes and references
- M. M. Kirchhoff, Resour. Conserv. Recycl., 2005, 44, 237–243 CrossRef.
- N. Supanchaiyamat and A. J. Hunt, ChemSusChem, 2019, 12, 397–403 CrossRef CAS PubMed.
- A. Ramesh, H. Hasegawa, W. Sugimoto, T. Maki and K. Ueda, Bioresour. Technol., 2008, 99, 3801–3809 CrossRef CAS PubMed.
- S. Syed, Hydrometallurgy, 2012, 115, 30–51 CrossRef.
- P. Goodman, Gold Bull., 2002, 35, 21–26 CrossRef CAS.
- L. Street, Gold Demand Trends Second quarter 2016 gold demand on record Key themes, World Gold Council, 2016, https://static.bullionstar.com/blogs/uploads/2016/08/GDT_Q2-2016.pdf, last accessed August 2019 Search PubMed.
- H. Wang and Z. J. Ren, Water Res., 2014, 66, 219–232 CrossRef CAS PubMed.
- S. Mor, K. Ravindra, R. P. Dahiya and A. Chandra, Environ. Monit. Assess., 2006, 118, 435–456 CrossRef CAS PubMed.
- G. Chen, Electrochemical technologies in wastewater treatment, Sep. Purif. Technol., 2004, 38, 11–41 CrossRef CAS.
- M. Lekka, I. Masavetas, A. V. Benedetti, A. Moutsatsou and L. Fedrizzi, Hydrometallurgy, 2015, 157, 97–106 CrossRef CAS.
- P. R. Zalupski, R. McDowell and G. Dutech, Solvent Extr. Ion Exch., 2014, 32, 737–748 CrossRef CAS.
- N. Das, Hydrometallurgy, 2010, 103, 180–189 CrossRef CAS.
- A. Tuncuk, V. Stazi, A. Akcil, E. Y. Yazici and H. Deveci, Miner. Eng., 2012, 25, 28–37 CrossRef CAS.
- D. Mohan and C. U. Pittman, J. Hazard. Mater., 2006, 137, 762–811 CrossRef CAS PubMed.
- I. Anastopoulos, A. Bhatnagar and E. C. Lima, J. Mol. Liq., 2016, 221, 954–962 CrossRef CAS.
- M. Soleimani and T. Kaghazchi, Bioresour. Technol., 2008, 99, 5374–5383 CrossRef CAS PubMed.
- E. Worch, Adsorption technology in water treatment- Fundamental, processes, and modeling, De Gruyter, Berlin, 2012 Search PubMed.
- T. M. Sun and W. T. Yen, Miner. Eng., 1993, 6, 17–29 CrossRef CAS.
- Y. F. Jia, B. Xiao and K. M. Thomas, Langmuir, 2002, 18, 470–478 CrossRef CAS.
- P. Van Der Voort, P. I. Ravikovitch, A. V. Neimark, M. Benjelloun, E. Van Bavel, K. P. De Jong, B. M. Weckhuysen and E. F. Vansant, Stud. Surf. Sci. Catal., 2002, 141, 45–52 CrossRef CAS.
- I. Sheet, A. Kabbani and H. Holail, Energy Procedia, 2014, 50, 130–138 CrossRef CAS.
- R. A. Bakar, R. Yahya and S. N. Gan, Procedia Chem., 2016, 19, 189–195 CrossRef.
- P. Valle-Vigón, M. Sevilla and A. B. Fuertes, Mater. Chem. Phys., 2013, 139, 281–289 CrossRef.
- L. Bois, A. Bonhommé, A. Ribes, B. Pais, G. Raffin and F. Tessier, Colloids Surf., A, 2003, 221, 221–230 CrossRef CAS.
- K. F. Lam, C. M. Fong, K. L. Yeung and G. Mckay, Chem. Eng. J., 2008, 145, 185–195 CrossRef CAS.
- K. F. Lam, K. L. Yeung and G. McKay, J. Phys. Chem. B, 2006, 110, 2187–2194 CrossRef CAS PubMed.
- J. Kříž, E. Adamcová, J. H. Knox and J. Hora, J. Chromatogr. A, 1994, 663, 151–161 CrossRef.
- T. Jiang, V. L. Budarin, P. S. Shuttleworth, G. Ellis, C. M. A. Parlett, K. Wilson, D. J. Macquarrie and A. J. Hunt, J. Mater. Chem. A, 2015, 3, 14148–14156 RSC.
- S. M. L. Dos Santos, K. A. B. Nogueira, M. De Souza Gama, J. D. F. Lima, I. J. Da Silva Junior and D. C. S. De Azevedo, Microporous Mesoporous Mater., 2013, 180, 284–292 CrossRef.
- J. Jiang and X. Q. Ma, Appl. Therm. Eng., 2011, 31, 3897–3903 CrossRef CAS.
- A. Méndez, J. M. Fidalgo, F. Guerrero and G. Gascó, J. Anal. Appl. Pyrolysis, 2009, 86, 66–67 CrossRef.
- A. J. Ridout, M. Carrier and J. Görgens, J. Anal. Appl. Pyrolysis, 2015, 111, 64–75 CrossRef CAS.
- L. Li, H. Zhang and X. Zhuang, Energy Sources, 2005, 27, 867–873 CrossRef CAS.
- D. Czajczyńska, L. Anguilano, H. Ghazal, R. Krzyżyńska, A. J. Reynolds, N. Spencer and H. Jouhara, Therm. Sci. Eng. Prog., 2017, 3, 171–197 CrossRef.
- K. Zeng, D. P. Minh, D. Gauthier, E. Weiss-Hortala, A. Nzihou and G. Flamant, Bioresour. Technol., 2015, 182, 114–119 CrossRef CAS PubMed.
- J. Park, Y. Lee, C. Ryu and Y. K. Park, Bioresour. Technol., 2014, 155, 63–70 CrossRef CAS PubMed.
- Z. Zhang, D. J. Macquarrie, M. De bruyn, V. L. Budarin, A. J. Hunt, M. J. Gronnow, J. Fan, P. S. Shuttleworth, J. H. Clark and A. S. Matharu, Green Chem., 2015, 17, 260–270 RSC.
- V. L. Budarin, J. H. Clark, B. A. Lanigan, P. Shuttleworth and D. J. Macquarrie, Bioresour. Technol., 2010, 101, 3776–3779 CrossRef CAS PubMed.
- J. Fan, M. De bruyn, Z. Zhu, V. Budarin, M. Gronnow, L. D. Gomez, D. Macquarrie and J. Clark, Chem. Eng. Process., 2013, 71, 37–42 CrossRef CAS.
- J. Fan, M. De bruyn, V. L. Budarin, M. J. Gronnow, P. S. Shuttleworth, S. Breeden, D. J. Macquarrie and J. H. Clark, J. Am. Chem. Soc., 2013, 135, 11728–11731 CrossRef CAS PubMed.
- V. L. Budarin, P. S. Shuttleworth, J. R. Dodson, A. J. Hunt, B. Lanigan, R. Marriott, K. J. Milkowski, A. J. Wilson, S. W. Breeden, J. Fan, E. H. K. Sin and J. H. Clark, Energy Environ. Sci., 2011, 4, 471–479 RSC.
- M. Miura, H. Kaga, T. Yoshida and K. Ando, J. Wood Sci., 2001, 47, 502–506 CrossRef CAS.
- Z. Zhang, D. J. Macquarrie, P. M. Aguiar, J. H. Clark and A. S. Matharu, Environ. Sci. Technol., 2015, 49, 2398–2404 CrossRef CAS PubMed.
- V. Budarin, J. H. Clark, J. J. E. Hardy, R. Luque, K. Milkowski, S. J. Tavener and A. J. Wilson, Angew. Chem., Int. Ed., 2006, 45, 3782–3786 CrossRef CAS PubMed.
- P. S. Shuttleworth, V. Budarin, R. J. White, V. M. Gun'ko, R. Luque and J. H. Clark, Chem.–Eur. J., 2013, 19, 9351–9357 CrossRef CAS PubMed.
- J. Wang, C. Xiang, Q. Liu, Y. Pan and J. Guo, Adv. Funct. Mater., 2008, 18, 2995–3002 CrossRef CAS.
- L. Li, H. Zhang and X. Zhuang, Energy Sources, 2005, 27, 867–873 CrossRef CAS.
- U. Kalapathy, A. Proctor and J. Shultz, Bioresour. Technol., 2000, 73, 257–262 CrossRef CAS.
- T. Susi, T. Pichler and P. Ayala, Beilstein J. Nanotechnol., 2015, 6, 177–192 CrossRef PubMed.
- C. Perruchot, M. A. Khan, A. Kamitsi, S. P. Armes, J. F. Watts, T. Von Werne and T. E. Patten, Eur. Polym. J., 2004, 40, 2129–2141 CrossRef CAS.
- Y. F. Jia, C. J. Steele, I. P. Hayward and K. M. Thomas, Carbon, 1998, 36, 1299–1308 CrossRef CAS.
- S. Mohammadnejad, J. L. Provis and J. S. J. Van Deventer, Int. J. Miner. Process., 2011, 100, 149–156 CrossRef CAS.
- S. Biggs, P. Mulvaney, C. F. Zukoski and F. Grieser, J. Am. Chem. Soc., 1994, 116, 9150–9157 CrossRef CAS.
- K. F. Lam, C. M. Fong and K. L. Yeung, Gold Bull., 2007, 40, 192–198 CrossRef CAS.
- M. H. Morcali, B. Zeytuncu, E. Ozlem and S. Aktas, Mater. Res., 2015, 18, 660–667 CrossRef CAS.
- D. G. Castner, K. Hinds and D. W. Grainger, Langmuir, 1996, 12, 5083–5086 CrossRef CAS.
- M. Bystrzejewski and K. Pyrzyńska, Mater. Chem. Phys., 2013, 141, 454–460 CrossRef CAS.
- S. Mohammadnejad, J. L. Provis and J. S. J. van Deventer, J. Colloid Interface Sci., 2013, 389, 252–259 CrossRef CAS PubMed.
- A. O. Dada, A. P. Olekau, A. M. Olatuna and O. Dada, IOSR J. Appl. Chem., 2012, 3, 38–45 CrossRef.
- K. Y. Foo and B. H. Hameed, Chem. Eng. J., 2010, 156, 2–10 CrossRef CAS.
- S. De Gisi, G. Lofrano, M. Grassi and M. Notarnicola, Sustainable Mater. Technol., 2016, 9, 10–40 CrossRef CAS.
- M. E. Romero-González, C. J. Williams, P. H. E. Gardiner, S. J. Gurman and S. Habesh, Environ. Sci. Technol., 2003, 37, 4163–4169 CrossRef PubMed.
- K. Deng, P. Yin, X. Liu, Q. Tang and R. Qu, Environ. Sci. Technol., 2014, 20, 2428–2438 CAS.
- R. Chand, T. Watari, K. Inoue, H. Kawakita, H. N. Luitel, D. Parajuli, T. Torikai and M. Yada, Miner. Eng., 2009, 22, 1277–1282 CrossRef CAS.
- R. Asadi-Kesheh, S.-A. Mohtashami, T. Kaghazchi, N. Asasian and M. Soleimani, Sep. Sci. Technol., 2015, 50, 223–232 CrossRef CAS.
- M. H. Morcali, B. Zeytuncu, E. Ozlem and S. Aktas, Mater. Res., 2015, 18, 660–667 CrossRef CAS.
- M. Yalcin and A. I. Aro, Hydrometallurgy, 2002, 63, 201–206 CrossRef CAS.
- Z. A. S. Harumain, H. L. Parker, A. Muñoz García, M. J. Austin, C. R. McElroy, A. J. Hunt, J. H. Clark, J. A. Meech, C. W. N. Anderson, L. Ciacci, T. E. Graedel, N. C. Bruce and E. L. Rylott, Environ. Sci. Technol., 2017, 51, 2992–3000 CrossRef CAS PubMed.
Footnote |
| † Electronic supplementary information (ESI) available. See DOI: 10.1039/d0ra02279a |
| This journal is © The Royal Society of Chemistry 2020 |

