 Open Access Article
Gas phase methanol synthesis with Raman spectroscopy for gas composition monitoring†
Pavel Maksimov *a,
Arto Laaria,
Vesa Ruuskanenb,
Tuomas Koiranena and
Jero Aholab
aLappeenranta-Lahti University of Technology, LUT School of Engineering Science, P.O. Box 20, FI-53851 Lappeenranta, Finland. E-mail: pavel.maksimov@lut.fi; Tel: +358 44 916 2861
bLappeenranta-Lahti University of Technology, LUT School of Energy Systems, P.O. Box 20, FI-53851 Lappeenranta, Finland
First published on 24th June 2020
Abstract
Applicability of Raman spectroscopy for time-resolved gas composition monitoring during direct methanol synthesis via carbon dioxide hydrogenation was investigated. A series of methanol synthesis experiments with varied reactor conditions was conducted and the reactor outlet stream was analyzed with in-line gas Raman spectroscopy. Concentrations of H2, CO2 and CO were determined directly from the acquired spectral data. For evaluation of methanol and water content a data reconciliation algorithm was developed. The algorithm involves estimation of the occurring chemical reactions' extents by iterative minimization of the difference between concentration values acquired from the experimental data and concentration values computed based on the mass conservation principle. The obtained experimental concentrations were compared and validated against the results of the reactor mathematical modeling, which is based upon a well-established kinetic interpretation of the process. The findings indicate good repeatability and accuracy of the developed gas analysis system, which together with the advantageous temporal resolution of the method, make Raman spectroscopy a promising technique for fast response monitoring of the process.
Introduction
Induced by the ever-increasing severity of concerns over global environmental challenges, development of carbon dioxide sequestration methods has become a topic of paramount importance over the past years. In this context, technologies devoted to conversion of carbon dioxide into value-added products have gained substantial significance as a way of using the main greenhouse gas as an alternative carbon source in chemical synthesis.Additionally, due to significant advances in the renewable energy sector, efficient production of green hydrogen becomes possible. This in turn provides an opportunity for effective implementation of carbon dioxide hydrogenation technologies on industrial scale.1 Among existing options, the process of carbon dioxide hydrogenation into methanol is one of the most promising solutions due to the high energy density of the product as well as its wide applicability.2 However, methanol production by direct reduction of carbon dioxide with hydrogen is a rather complicated problem because of relatively low equilibrium conversion. This problem arises as a result of thermodynamic limitations of the occurring reactions. Moreover, in comparison with the conventional process of methanol production from syngas, synthesis by direct hydrogenation of carbon dioxide involves excessive formation of water, which has an especially adverse impact on the catalyst. Therefore, considerable amount of research efforts is being put into development of new more effective and selective catalytic systems to overcome the existing bottlenecks of the process and to make it industrially feasible.3
Gas-phase methanol synthesis through carbon dioxide hydrogenation is typically performed with copper-based catalysts at temperature around 200–250 °C and pressure of 50–100 bar.4 The most prominent reactions involved in methanol synthesis via carbon dioxide hydrogenation can be summarized as follows:
| CO2 + H2 ⇌ CO + H2O | (1) |
| CO + 2H2 ⇌ CH3OH | (2) |
| CO2 + 3H2 ⇌ CH3OH + H2O | (3) |
Precise and reliable analysis of reactor outlet stream composition is crucial for accurate estimation of catalyst activity. Moreover, correct determination of hydrogen concentration is of particularly significant importance in case of methanol synthesis from carbon dioxide. This, however, might be a problem when infrared spectroscopy is used to analyse gas phase components. Furthermore, novel reactor designs that combine reaction and separation in a single operation unit have been proposed.5,6 Taking into account the transient nature of such processes, reliable fast response monitoring of the system becomes necessary for experimental verification of the proposed concepts.
In the majority of cases, analysis of reactor outlet stream is achieved by means of gas chromatography. Flame ionization detector (FID) is usually applied for methanol concentration determination, while thermal conductivity detector (TCD) is used for analysis of other gaseous components.7–16 However, although gas chromatography is a versatile and accurate analytical method, its application for continuous gas composition monitoring might be ineffective due to significant temporal resolution limitations.17 An additional issue of this method is the possible ambiguity in qualitative determination of unknown compounds within a complex mixture, which often necessitates additional confirmatory identification.18 Therefore, gas chromatography-mass spectrometry (GC-MS) is used in many instances for more accurate and reliable analysis of reactor outlet composition.19,20
For improved time resolved reactor outlet composition analysis, analytical methods such as Fourier transform infrared spectroscopy (FT-IR)21 and quadrupole mass spectrometry (QMS)22 have been applied. Although infrared spectroscopy enables relatively delay free data acquisition, its significant drawback is the limitation in detection of homonuclear diatomic molecules. More specifically, diatomic molecules have only one symmetric stretch vibration mode, which is completely infrared inactive.23,24 This aspect negates the possibility for detection of hydrogen and nitrogen. At the same time, accurate estimation of hydrogen conversion may provide valuable information for determination of reaction extents in the competitive reverse water gas shift (RWGS) and carbon dioxide hydrogenation reactions. On the other hand, even though mass spectroscopy empowers fast and accurate structural elucidation of the analyzed compounds, its applicability for real time quantitative analysis is rather limited, especially in comparison to optical spectroscopies. More precisely, reproducibility of quantitative measurements in mass spectroscopy is problematic due to possibility of unequal responses towards ions with different mass-to-charge ratio, excessive sensitivity to contamination caused by analytes, and interferences between analyzed ions occurring at the detector.25
In contrast, Raman spectroscopy that possesses numerous advantageous features over the other analytical tools can be especially beneficial in terms of methanol synthesis process monitoring. In particular, properties such as flexibility regarding sampling interfaces, no need for additional preparation of analytes and high sampling rate make this method very promising for a time resolved analysis.26 In addition, as opposed to FT-IR, Raman spectroscopy enables detection of most of the components present in the process.
In order to study the applicability of Raman spectroscopy for efficient quantitative analysis in methanol production via carbon dioxide hydrogenation, a series of synthesis experiments was conducted. A data reconciliation algorithm for processing the acquired spectral data to determine methanol and water outlet concentration values is proposed. The obtained values are validated indirectly by comparing the findings against a well-recognized kinetic model presented in literature for methanol synthesis.27 The unique approach described herein provides an opportunity to overcome limitations of Raman spectroscopy, particularly significant in terms of analysis of low concentrated species, taking full advantage of the analytical technique's ease of implementation and beneficial temporal resolution properties.
Raman spectroscopy
Raman spectroscopy involves detection of molecular vibrations and is based upon the phenomenon of inelastic scattering of photons. More precisely, incident light of constant wavelength interacting with the analyzed molecule causes distortion of electron cloud which, in turn, results in release of scattered radiation. Due to negligible mass of electrons, in the overwhelming majority of cases, this distortion of electron cloud does not initiate any nuclear motion. Therefore, the scattered radiation is mostly comprised of photons with the same frequency as that of the incident light. However, in case if nuclear motion is induced during this process, the frequency of the scattered radiation is changed due to energy transfer between the incident light and the illuminated target molecule. This change in energy is the phenomenon detected by Raman spectroscopy.28,29 Since for the analytical purposes the technique generally employs light of visible spectrum, one of the main limitations of the method is fluorescence, which, if it occurs, might prevent accurate detection of the signal from the analyte. An additional issue is the possibility of sample degradation as a result of intense laser energy absorption. In addition to the mentioned drawbacks of the method, certain limitations of Raman spectroscopy regarding water analysis might be considered as a minor disadvantage in the analysis of carbon dioxide hydrogenation processes. The rather weak Raman scattering efficiency of water molecule might cause detrimental impact on the accuracy of water concentration determination.30 More so, even though Raman spectrum of water at ambient conditions is well-known in the O–H stretching region, the quantity of distinguishable spectral features and their intensity experience a steady decrease as temperature rises.31 In light of this, accurate determination of water concentration with Raman spectroscopy might be especially challenging since gas composition analysis is typically performed at elevated temperatures to avoid vapor condensation.In the context of research on the topic of heterogeneous catalysis Raman spectroscopy has been applied mostly for structural characterization of solid catalytic materials.32–34 More specifically, the method is typically used to deliver insights related to molecular structure of analyzed materials and investigate formation of crystalline phases during catalyst preparation.35 In recent years, Raman spectroscopy was also successfully applied for in situ characterization of catalytic materials during operation under kinetically relevant conditions (operando spectroscopy).36 In this regard, Raman spectroscopy has proven as a good descriptive method for analysis of reaction intermediates due to its non-intrusiveness and no requirements for sample preparation.37 In methanol synthesis, applicability of operando Raman spectroscopy has been rigorously studied by Reymond et al.38,39 who applied Raman spectroscopy for in situ analysis of catalyst surface and phase behaviour during high-pressure methanol synthesis.
Although Raman spectroscopy is still a rather underdeveloped technique, it has been successfully applied for gas analysis with compositions similar to the methanol synthesis process considered in this study.40–44 Raman spectroscopy was also used for online gas composition monitoring during methanol synthesis by Reymond et al.38 However, reliable quantitative evaluation of product composition was in their case hindered due to poor methanol Raman signal determination.45 In a similar manner, Raman spectroscopy was also applied for quantitative analysis of methanol synthesis products by Gaikwad.46 Nonetheless, accurate estimation of methanol concentration was also limited due to the same reasons. Therefore, methanol formation rate was evaluated indirectly by considering the ratio of hydrogen and carbon dioxide signals intensities. In summary, although Raman spectroscopy in principle enables effective detection of the involved components, its application for comprehensive quantitative analysis of the products has been so far limited.
Experimental
A commercial methanol synthesis catalyst (Cu/ZnO/Al2O3, Alfa Aesar) was used in this study to conduct carbon dioxide hydrogenation experiments. In order to avoid mass transfer limitations during the synthesis, the pelletized catalyst was ground to produce a powdered sample. A fraction of the sample consisting of particles with 125–250 μm diameter was then separated by means of sieves with the corresponding mesh sizes. The obtained catalyst was then loaded inside the reactor for methanol synthesis experiments.Carbon dioxide hydrogenation process was performed in a steel tubular reactor (length – 400 mm, internal diameter – 10 mm, outer diameter – 12 mm) heated with an external electric furnace. The reactor temperature was measured and controlled by three K-type thermocouples installed along reactor height and in direct contact with its wall outer surface. This way, the reactor is divided into three temperature sections. The temperatures of these sections are independently controlled with PI controllers adjusting the duty cycle of the solid-state relays supplying the electrical heater elements. The reactor pressure was maintained via a back-pressure regulator with pure nitrogen used to apply the counter pressure. Three gas cylinders containing pure nitrogen, pure hydrogen and a mixture of carbon monoxide with hydrogen (H2![[thin space (1/6-em)]](https://www.rsc.org/images/entities/char_2009.gif) :
:![[thin space (1/6-em)]](https://www.rsc.org/images/entities/char_2009.gif) CO = 3
CO = 3![[thin space (1/6-em)]](https://www.rsc.org/images/entities/char_2009.gif) :
:![[thin space (1/6-em)]](https://www.rsc.org/images/entities/char_2009.gif) 1), respectively, were connected to mass flow controllers (Bronkhorst EL-FLOW, 0–2000 N ml min−1). In a similar manner, a gas cylinder containing a mixture of carbon dioxide and hydrogen (H2
1), respectively, were connected to mass flow controllers (Bronkhorst EL-FLOW, 0–2000 N ml min−1). In a similar manner, a gas cylinder containing a mixture of carbon dioxide and hydrogen (H2![[thin space (1/6-em)]](https://www.rsc.org/images/entities/char_2009.gif) :
:![[thin space (1/6-em)]](https://www.rsc.org/images/entities/char_2009.gif) CO2 = 3
CO2 = 3![[thin space (1/6-em)]](https://www.rsc.org/images/entities/char_2009.gif) :
:![[thin space (1/6-em)]](https://www.rsc.org/images/entities/char_2009.gif) 1) was connected to its own mass flow controller (BROOKS, 200–5000 N ml min−1). The control and data acquisition systems of the reactor section are implemented and accessed through the LabVIEW software package.
1) was connected to its own mass flow controller (BROOKS, 200–5000 N ml min−1). The control and data acquisition systems of the reactor section are implemented and accessed through the LabVIEW software package.
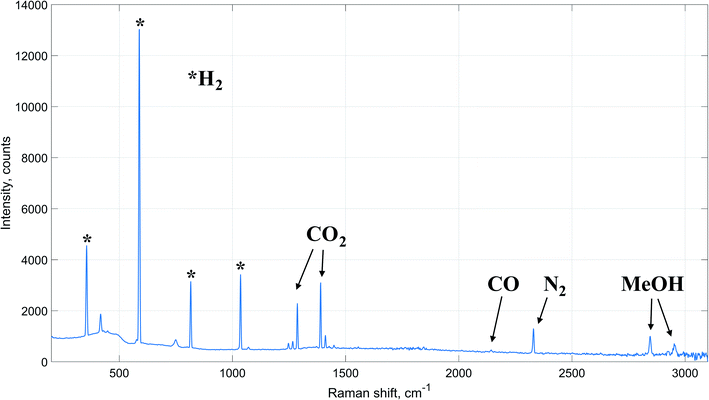
Reactor outlet is connected to a Raman cell equipped with a gas-phase probe, which is further connected to a Raman spectrometer (RamanRXN1, Kaiser Optical Systems, Inc.) via an optic cable. The Raman spectrometer is equipped with a near-infrared 785 nm laser with maximum output power 400 mW and a charge coupled device (CCD) detector. For the purpose of intensity calibration of the instrument, a tungsten-halogen reference lamp of a Raman Calibration Accessory (RamanRXN Systems) was applied. Cyclohexanol was used for wavenumber calibration and system verification.
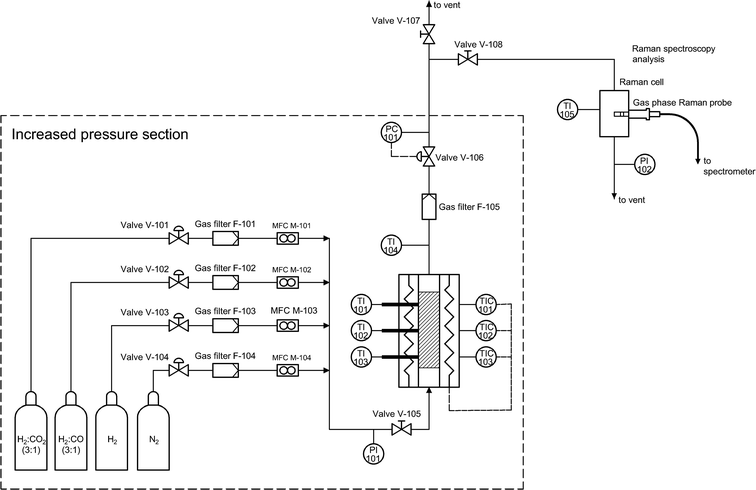
In order to avoid unwanted condensation of methanol and water, the outlet reactor lines and the Raman cell were electrically heated, and the temperature was controlled. The high-pressure lines (upstream of the back-pressure regulator) were heated up to 180 °C, while the temperature downstream of the back-pressure regulator and in the Raman cell was maintained at 110 °C. Liquid products were cooled after the Raman cell and collected in a separate condensing vessel. The overall flow diagram of the experimental setup is provided in Fig. 1.
In order to achieve uniform temperature in the catalyst bed section, only the last 100 mm of the reactor was packed with the catalyst. The first 280 mm of the reactor was filled with silica carbide (particle size – 1 mm) as an inert support, with the glass wool occupying the remaining 20 mm to prevent mixing of catalyst with silica carbide.
Before catalytic experiments, the catalyst was activated under a flow of hydrogen (20 vol%) balanced with nitrogen, while the temperature was increased at a rate of 1 °C per minute up to the point of 250 °C. After reaching the specified temperature, the activation was continued for additional 90 minutes at constant reactor temperature to ensure complete reduction of the catalyst.47 To ensure appropriate catalyst reduction, the composition of the reactor outlet was analyzed with Raman spectrometer. Data acquisition parameters were as follows: output laser power – 400 mW, exposure time – 45 seconds, accumulations – 2 scans per single Raman spectrum. During catalyst activation the outlet reactor pipes were not heated, thus the temperature in the Raman cell was ambient.
Before each experiment prior to acquiring experimental Raman spectra, the gas phase probe was illuminated with the excitation laser for 60 minutes in order to quench the background noise that might originate from the probe's internal optical surfaces.
All synthesis experiments were performed with a constant overall gas flowrate and constant inlet gas composition: CO2 – 125 N ml min−1, H2 – 375 N ml min−1, N2 – 50 N ml min−1. During the experiments conducted at different pressures, the reactor temperature was kept constant at 230 °C, while the reactor pressure was changed from 20 up to 60 bar with steps of 10 bar. Whereas, during the experiments conducted at different temperatures, the reactor pressure was kept constant at 40 bar and the reactor temperature was changed from 210 °C up to 260 °C with steps of 10 °C. For the purpose of quantitative analysis, a set of reference Raman spectra was acquired before each experiment by passing a gas of known composition through the system without any reaction occurring in the reactor. To ensure that no reactions would occur during the reference data acquisition, the reactor was kept at ambient conditions. Both the reference and the experimental data were acquired at temperature of 110 °C in the Raman cell.
The spectrometer configuration was changed for reference and experimental Raman spectra acquisition in order to avoid excessive saturation of the detector. More specifically, the exposure time was reduced to 20 seconds, while the number of scans per single Raman spectrum was increased to 3 in order to maintain high intensity signals of the components. Overall, 10 spectra of the following gas composition CO2 – 22.7%, H2 – 68.2%, N2 – 9.1% were acquired to get relevant reference data for calibration of the device for carbon dioxide, hydrogen and nitrogen. Additionally, 10 reference spectra of gas containing CO – 9.1%, H2 – 27.3%, N2 – 63.6% were obtained to calibrate the device for carbon monoxide. Since the reactions leading to methanol formation involve a significant decrease in the overall number of moles, it is expected that the overall gas flowrate decreases during the synthesis. In this regard, analysis of nitrogen Raman signal provides an opportunity to quantitatively estimate this decrease in the overall gas flowrate. In order to avoid possible discrepancy in the obtained results due to non-steady operation of the reactor, acquisition of experimental Raman spectra during the synthesis was started 60 minutes after the specified process conditions had been reached. For each synthesis experiment 10 Raman spectra were acquired.
Data processing
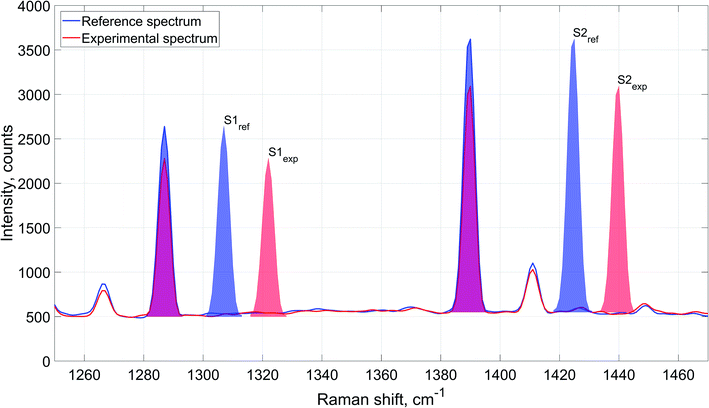
Since Raman signal intensity is directly proportional to analyte concentration, the spectra obtained during experiments are compared to averaged reference spectrum in order to determine the composition of the outlet stream. Integrated intensities of the observed Raman signals are considered for the comparison. This approach provides an opportunity to precisely determine analytes' concentrations minimizing sample-generated noise.55 In case if an analyte's Raman signal involves several peaks, the value of the overall integrated intensity of all the peaks is considered.
Schematic description of the spectral data processing is provided in Fig. 3 exemplified by carbon dioxide Raman signal. The figure represents carbon dioxide Raman signal obtained from reference and experimental spectra. Integrated intensity of the signal is determined as cumulative area underneath the peaks: S1ref and S2ref for the averaged reference spectrum, and S1exp and S2exp for the experimental spectrum.
Although the acquired Raman spectra exhibited clear and distinctive signals of the analyzed components, each spectrum had mild variations in the baseline intensity. The approximate magnitude of these variations fell within the limits of 8–9% of N2 peak height. These variations were consistent at all the acquired spectra. This way, a separate baseline value was considered for each peak to improve accuracy and reliability of evaluated integrated intensity values.
Using this method, the concentrations are determined in the following way:
 | (4) |
However, analysis of water Raman signal was hindered due to low scattering efficiency of the molecule and limitations of the employed apparatus that prohibited detection of the most prominent spectral features of the component. Taking these issues into account and also considering the weakly distinguished Raman peaks and lack of suitable calibration method for methanol, a data processing algorithm was deployed. The data reconciliation algorithm is designed for computation of water and methanol concentrations from the acquired experimental spectra.
It is worth mentioning that no signals of other components, such as methane or dimethyl ether, were detected on the acquired experimental Raman spectra. Therefore, with a reasonable degree of accuracy, it can be assumed that apart from methanol synthesis no other reactions occurred inside the reactor during the experiments. Moreover, the reaction of carbon dioxide hydrogenation to methanol (eqn (3)) is a stoichiometric sum of RWGS (eqn (1)) and carbon monoxide hydrogenation (eqn (2)) reactions. Therefore, accurate estimation of the extents of these reactions is sufficient for a reliable computation of the components' outlet concentrations. Hence, the algorithm is based on determination of reaction extent values for RWGS and carbon dioxide hydrogenation to methanol.
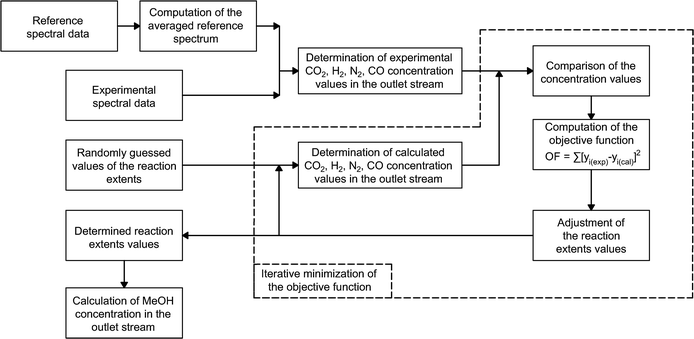
Methanol and water concentrations are calculated using the reaction extents determined by a data reconciliation algorithm on the basis of the acquired spectral data. More specifically, the reconciliation algorithm involves minimization of the objective function based on the difference between the concentrations obtained from the experimental spectra and the values calculated via the reaction extents by the following equation:
 | (5) |
Given that higher content components are characterized by more prominent Raman signals, their concentration values, determined from the acquired spectra, are less affected by noise in the data. Therefore, the objective function based upon sums of squared residuals was selected for the developed algorithm since with this type of regression larger concentration values tend to have greater contribution to the data fitting procedure.
Hence, the objective function employed for the algorithm is based on the method of least squares and is determined in the following way:
| OF = ∑(yiexp − yical)2 | (6) |
For the purpose of finding the minima of the objective function, a nonlinear unconstrained simplex optimization algorithm is applied.56 The optimization algorithm is implemented in MATLAB through the ‘fminseach’ function. Fig. 4 provides a visual representation of the overall experimental data processing algorithm.
Reactor model
In order to evaluate the general validity of the proposed methodology for obtaining the components' concentrations, an additional comparison of the obtained experimental results against a kinetic model of the process was performed. For this reason, a one-dimensional pseudo-homogeneous plug-flow reactor model was developed. In this model such phenomena as axial dispersion, mass-transfer limitations and pressure drop have been considered as negligible considering the relatively small scale of the reactor. Furthermore, since during experiments, the temperature of the reactor was kept constant, isothermal conditions are assumed. Moreover, the isothermal hypothesis is also supported by the thermal Mears criterion.15 Therefore, the steady state reactor model is given by the following ordinary differential equation:57
 | (7) |
Among the most well-recognized kinetic interpretations of methanol synthesis, the set of equations developed by Graaf et al.27 provides a very accurate description of the process. Hence, also considering the similarity between the experimental conditions investigated in this work and the ones studied by the authors, this model has been selected for mathematical representation of the process. The kinetic model describes the process of methanol synthesis with the following equations:
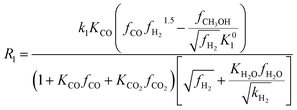 | (8) |
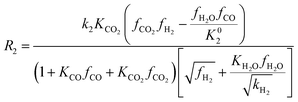 | (9) |
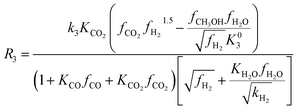 | (10) |
Numerical values of the constants used for calculation of the rate expressions can be found in ESI.† The modified Soave–Redlich–Kwong equation of state58 has been applied for calculating components fugacity coefficients due to its proven accuracy in terms of methanol synthesis kinetic modeling.15,19,27,59 The equilibrium constants for the kinetic expressions are based on the latest reassessment of the process thermochemical data.60 Since no signal of other chemical species has been detected on the acquired Raman spectra, no additional kinetic equations were considered.
To solve the system of the ordinary differential equations an explicit Runge–Kutta method was applied.61 It was implemented in MATLAB using the single-step non-stiff solver ode45. This method has been selected due to its effectiveness and accuracy when dealing with non-stiff problems.62
Results and discussion
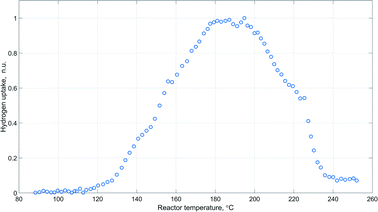
Before the methanol synthesis experiments, Raman spectroscopy was employed for analysis of the catalyst activation process. The amount of hydrogen consumed during the activation process is expressed through hydrogen uptake, which was calculated in normalized units with the following equation:
 | (11) |
The obtained pattern of hydrogen uptake as a function of reactor temperature during catalyst activation is provided in Fig. 5.
The represented profile exhibits an obvious sharp peak around 180–200 °C, which agrees well with the results of temperature-programmed reduction experiments of similar copper containing catalytic systems.47,63,64
Moreover, peaks of carbon dioxide and oxygen were observed in the acquired Raman spectra during the time of the highest hydrogen uptake (Fig. 6). This further supports the view that catalyst activation also involves reduction of undecomposed carbonate species.64
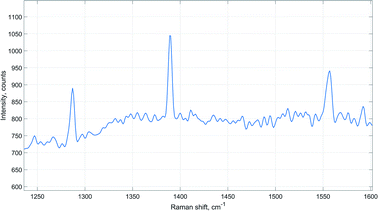 | ||
| Fig. 6 Raman signals of carbon dioxide and oxygen (1555 cm−1) detected during catalyst activation (reactor temperature 180 °C, ambient pressure). | ||
Experiments at different reactor pressures
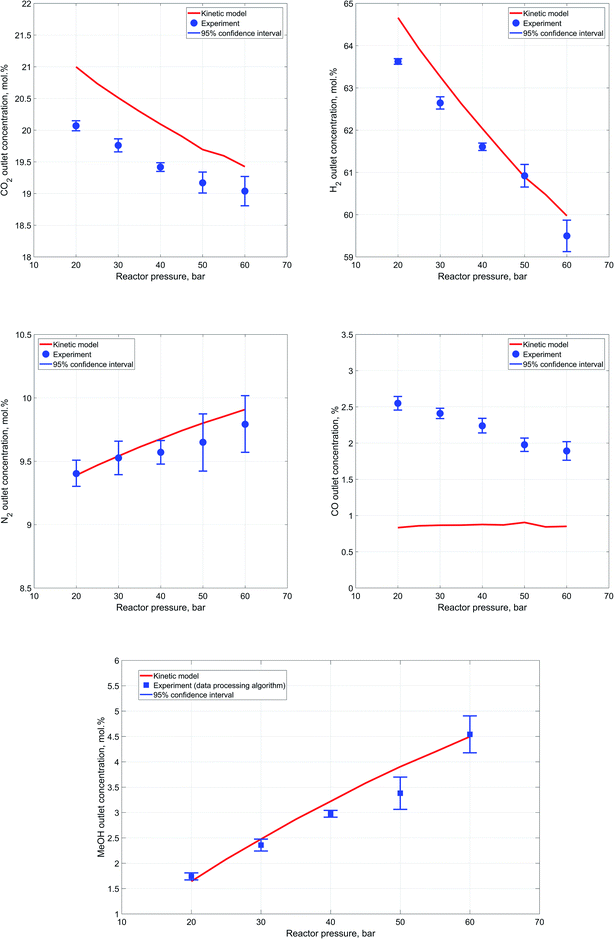
In good agreement with the Le Chatelier's principle, results of the conducted experiments indicate a steady increase in reactants conversion and, as a consequence, outlet methanol concentration as the reactor pressure is increased. Concentrations determined during each experiment are averaged for each component to yield an outlet experimental concentration at the specific process conditions. In order to estimate scatter between single synthesis experiment measurements, a 95% confidence interval is computed for each case from repeated experiments.65 Fig. 7a–d represent a comparison of the experimental values of components' outlet concentrations vs. the results of the kinetic modeling.Accurate estimation of nitrogen content is especially important because of its significance in the developed data processing algorithm for outlet methanol concentration estimation. These values of outlet methanol content, determined via the reaction extent algorithm, are compared against the kinetic modeling results in Fig. 7e.
In general, a close correspondence between the obtained experimental concentrations and the kinetic modeling results can be observed, except for carbon monoxide content in the outlet stream. Furthermore, it can be also noted that as the reactor pressure rises the degree of scatter in the results obtained during each experiment experiences a slight increase. This might be caused by insufficient heating of the high-pressure pipe downstream the reactor that may lead to condensation of water. The condensation in turn intervenes with the components' flowrates in the Raman cell and influences estimation of the reactor outlet composition.
Although, the discrepancy in terms of carbon monoxide outlet concentration values is not significant in absolute terms, it bears a clear and distinctive pattern. This might imply that there are differences between the kinetic expressions employed for the description of the reactions and the actual experimental process.
The results indicate an apparent decrease in the carbon monoxide content in the outlet stream with the increase of reactor pressure. Thus, it can be assumed that the catalyst used for methanol synthesis in the current work may have slightly different activity with respect to RWGS reaction. In addition, the comparatively weak Raman scattering efficiency of carbon monoxide and its low content in the outlet stream during the experiments might also have a negative impact on the precision and reliability of the acquired carbon monoxide data.
Experiments at different reactor temperatures
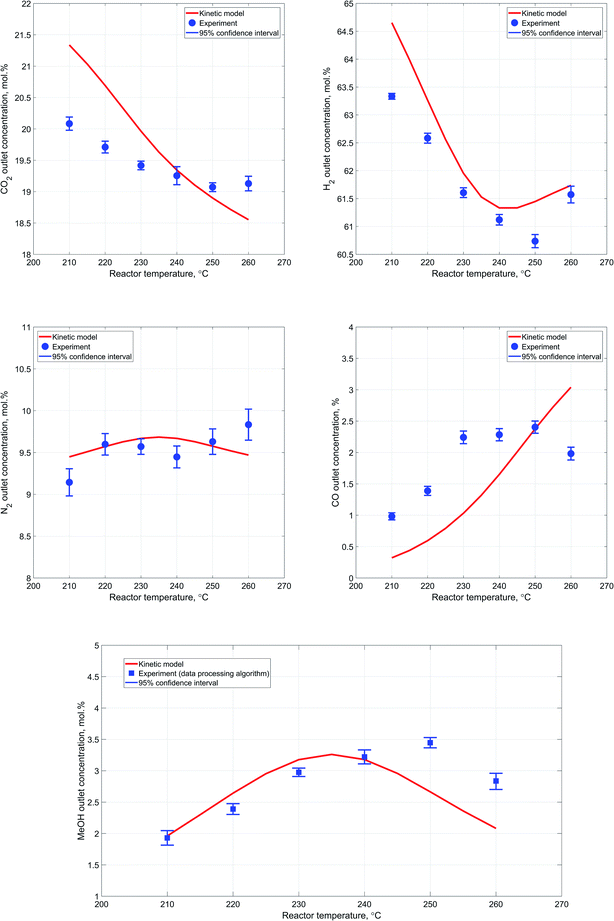
In general, the results obtained during the experiments conducted at different temperatures follow the expected pattern attributable to the exothermicity of the synthesis reactions and the dependence of the reaction rate from temperature. Particularly, as the reactor temperature rises there is a steady improvement in the reactants' conversion due to increase in the reaction rates, followed by a slight decrease as a result of thermodynamic equilibrium limitations.Fig. 8a–e provide a more detailed description regarding the reactor outlet composition and a comparative analysis of the attained results. Although the deviation between the kinetic modeling results and experimental data is not significant, it is worth noting that the overall pattern of the reactor performance as a function of temperature is slightly different. Particularly, the decrease in outlet methanol concentration with increase in reactor temperature is less significant in case of experimental results. Additionally, conversion of carbon dioxide experiences an obvious decrease as the reactor temperature rises, implying that the RWGS reaction, which should be dominant under high temperature conditions, is rather limited in our case. This is also indirectly confirmed by the decrease in carbon monoxide outlet concentration with increase in reactor temperature.
With respect to the variation in the experimental data acquired at one measurement point, the 95% confidence interval values are generally slightly more significant in case of the experiments conducted at different temperatures.
However, the values are consistent and exhibit only minor changes at different process conditions. This also supports the notion that the observed variability in the obtained experimental data is mostly due to minor limitations of the reactor setup itself. At the same time, it is also worth noting a minor lack of consistency in the experimental values of nitrogen outlet concentration. These deviations most likely originate from the spectral data due to weak Raman scattering efficiency of nitrogen molecule coupled with the relatively low content of nitrogen at the reactor outlet. Nevertheless, the employed data processing algorithm still provided a reasonably good estimation of methanol outlet concentration, due to determination of carbon dioxide to hydrogen ratio in the outlet stream. Accurate estimation of carbon dioxide and hydrogen concentrations in the outlet stream provides an opportunity to estimate co-relation between extents of RWGS and carbon dioxide hydrogenation reactions due to the difference in hydrogen consumption rate.
Regarding the discrepancy between the obtained experimental carbon monoxide concentrations and the corresponding results of the kinetic modeling, it is worth noting that the values are consistent with the carbon dioxide and methanol concentrations.
More specifically, at higher reactor temperatures, formation of both methanol and carbon monoxide is hindered due to lower conversion of starting materials, which can be clearly identified by increased outlet concentrations of carbon dioxide and hydrogen at 260 °C.
Additionally, a noteworthy detail is that at 260 °C conversion of carbon dioxide is much lower than the value predicted by the kinetic model, while conversion of hydrogen is almost equal to the kinetic model value. Hence, more hydrogen has been consumed per mole of carbon dioxide, which means that more carbon dioxide has been converted to methanol since carbon dioxide hydrogenation reaction consumes thrice more hydrogen that RWGS. This pattern clearly supports the notion that the catalyst employed in the conducted experiments exhibits different properties in terms of RWGS reaction, which should be more favorable at elevated temperatures.
Therefore, it can be concluded that in the case of the conducted synthesis experiments, the RWGS reaction is less prominent as compared to the reaction of carbon dioxide hydrogenation to methanol. Moreover, the system of kinetic expressions considered for the mathematical modeling of the process has been developed on the basis of experimental data acquired within the temperature range of 210–245 °C.27 Therefore, the identified inconsistencies at temperatures above 240 °C might be partly attributed to this reason.
Conclusions
The applicability of Raman spectroscopy for time-resolved monitoring of outlet gas composition during methanol synthesis via carbon dioxide hydrogenation was studied in this work. In general, the obtained results indicate good accuracy and repeatability of the method for transient fast response gas analysis. Moreover, the spectral data processing algorithm enables accurate estimation of methanol and water concentrations in the outlet stream. In overall, the findings are in remarkably good agreement with the results obtained by predictions of the kinetic model for the process. Carbon monoxide outlet concentration values show some deviation, which might be explained by the different activity of the utilized catalyst in terms of the RWGS reaction. Similarly, the minor differences between the experimentally determined components' concentrations and the kinetic modeling results for the experiments at different temperatures can also be attributed to the different catalyst properties regarding the RWGS reaction.Regarding the experiments conducted at different pressures, conversion of the reactants and process selectivity experienced an expected increase with increased reactor pressure. However, variations between the results obtained during one experiment became also slightly more prominent as the reactor pressure increased. As indicated by the temperature varied experiments, this decrease in repeatability is associated not with the employed gas analysis system itself but with certain limitations of the reactor setup. However, this minor increase in variation in the acquired results is rather insignificant and in no way diminishes the reliability of the obtained experimental data.
Overall, considering the good repeatability of the method and the accuracy of the obtained results, Raman spectroscopy proved to be a reliable and efficient tool for in-line time-resolved gas composition monitoring during methanol synthesis from carbon dioxide. Furthermore, such advantageous features as ease of implementation, no need for additional sample preparation and fast response time make the method especially suitable for gas phase analysis in the studied process.
Conflicts of interest
There are no conflicts to declare.Acknowledgements
The work was supported by ERDF European Regional Development Fund Grant no. A74130 and REFLEX research platform of LUT University, Lappeenranta, Finland. The authors gratefully acknowledge the valuable assistance of M.Sc. Tiina Virtanen who provided help and support in terms of working with the Raman spectroscope.References
- G. Leonzio, J. CO2 Util., 2018, 27, 326–354 CrossRef CAS.
- O. Y. Abdelaziz, W. M. Hosny, M. A. Gadalla, I. A. Ashour, F. H. Ashour and C. P. Hulteberg, J. CO2 Util., 2017, 21, 52–63 CrossRef CAS.
- S. Dang, H. Yang, P. Gao, H. Wang, X. Li, W. Wei and S. Yahan, Catal. Today, 2019, 330, 61–75 CrossRef CAS.
- I. Lo and H. Wu, J. Taiwan Inst. Chem. Eng., 2019, 98, 124–131 CrossRef CAS.
- M. Bayat, M. Heravi and M. R. Rahimpour, Chem. Eng. Process., 2016, 110, 30–43 CrossRef CAS.
- Z. Dehghani, M. Bayat and M. R. Rahimpour, J. Taiwan Inst. Chem. Eng., 2014, 45, 1490–1500 CrossRef CAS.
- W. Geng, H. Han, F. Liu, X. Liu, L. Xiao and W. Wu, J. CO2 Util., 2017, 21, 64–71 CrossRef CAS.
- E. L. Kunkes, F. Studt, F. Abild-Pedersen, R. Schlögl and M. Behrens, J. Catal., 2015, 328, 43–48 CrossRef CAS.
- M. M. Li, Z. Zeng, F. Liao, X. Hong and S. C. E. Tsang, J. Catal., 2016, 343, 157–167 CrossRef CAS.
- X. Dong, F. Li, N. Zhao, F. Xiao, J. Wang and Y. Tan, Appl. Catal., B, 2016, 191, 8–17 CrossRef CAS.
- B. Tidona, A. Urakawa and P. Rudolf von Rohr, Chem. Eng. Process., 2013, 65, 53–57 CrossRef CAS.
- F. Arena, K. Barbera, G. Italiano, G. Bonura, L. Spardo and F. Frusteri, J. Catal., 2007, 249, 185–194 CrossRef CAS.
- N. Park, M. Park, Y. Lee, K. Ha and K. Jun, Fuel Process. Technol., 2014, 125, 139–147 CrossRef CAS.
- H. Bahruji, M. Bowker, G. Hutchings, N. Dimitratos, P. Wells, E. Gibson, P. Gibson, E. Jones and W. Brookes, J. Catal., 2016, 343, 133–146 CrossRef CAS.
- J. Portha, K. Parkhomenko, K. Kobl, A. Roger, S. Arab, J. Commenge and L. Falk, Ind. Eng. Chem. Res., 2017, 56, 13133–13145 CrossRef CAS.
- F. Studt, M. Behrens, E. L. Kunkes, N. Thomas, S. Zander, A. Tarasov, J. Schumann, E. Frei, J. B. Varley, F. Abild-Pedersen, J. K. Norskov and R. Schlögll, ChemCatChem, 2015, 7, 1105–1111 CrossRef CAS.
- R. Grob, in Modern Practive of Gas Chromatography, John Wiley & Sons, Hoboken, New Jersey, 2004, pp. 25–63 Search PubMed.
- E. Stashenko and J. Reny Martynez, in Advances in Gas Chromatography, Books on Demand, Norderstedt, Germany, 2014, pp. 1–38 Search PubMed.
- K. Vanden Bussche and G. Froment, J. Catal., 1996, 161, 1–10 CrossRef CAS.
- M. Bukhtiyarova, T. Lunkenbein, K. Kähler and R. Schlögl, Catal. Lett., 2017, 147, 416–427 CrossRef CAS.
- J. Terreni, M. Trottmann, T. Franken, A. Heel and A. Borgschulte, Energy Technol., 2019, 7, 1801093 CrossRef.
- P. C. K. Vesborg, I. Chorkendorff, I. Knudsen, O. Balmes, J. Nerlov, A. M. Molenbroek, B. S. Clausen and S. Helveg, J. Catal., 2009, 262, 65–72 CrossRef CAS.
- T. Theophanides, Infrared Spectroscopy – Materials Science, Engineering and Technology, IntechOpen, 2012 Search PubMed.
- B. C. Smith, Fundamentals of Fourier Transform Infrared Spectroscopy, CRC Press, Baton Rouge, 2011 Search PubMed.
- P. L. Urban, Y. Chen and Y. Wang, Time-resolved mass spectrometry, Wiley Chichester, West Sussex, 2016 Search PubMed.
- K. A. Bakeev, Process analytical technology, Blackwell Publishing, Oxford, 2005 Search PubMed.
- G. H. Graaf, E. J. Stamhuis and A. Beenackers, Chem. Eng. Sci., 1988, 43, 3185–3195 CrossRef CAS.
- P. Vandenabeele, Practical Raman Spectroscopy - An Introduciton, John Wiley & Sons, Hoboken, New Jersey, 2013 Search PubMed.
- E. Smith and G. Dent, Modern Raman spectroscopy, John Wiley & Sons, Hoboken, New Jersey, 2005 Search PubMed.
- M. Louvel, A. Bordage, C. Da Silva-Cadoux, D. Testemale, E. Lahera, W. Del Net, O. Geaymond, J. Dubessy, R. Argound and J. H. Hazemann, J. Mol. Liq., 2015, 205, 54–60 CrossRef CAS.
- Q. Hu, X. Lü, W. Lu, Y. Chen and H. Liu, J. Mol. Spectrosc., 2013, 292, 23–27 CrossRef CAS.
- V. Deerattrakul, W. Limphirat and P. Kongkachuichay, J. Taiwan Inst. Chem. Eng., 2017, 80, 495–502 CrossRef CAS.
- L. Shi, K. Tao, R. Yang, F. Meng, C. Xing and N. Tsubaki, Appl. Catal., A, 2011, 401, 46–55 CrossRef CAS.
- M. S. Frei, M. Capdevila-Cortada, R. García-Muelas, C. Mondelli, N. López, J. A. Stewart, D. Curulla Ferre and J. Perez-Ramirez, J. Catal., 2018, 361, 313–321 CrossRef CAS.
- M. A. Bañares and I. E. Wachs, Encyclopedia of Analytical Chemistry, 2010 Search PubMed.
- M. A. Bañares, Adv. Mater., 2011, 23, 5293–5301 CrossRef PubMed.
- I. E. Wachs and C. A. Roberts, Chem. Soc. Rev., 2010, 39, 5002–5017 RSC.
- H. Reymond, V. Amado-Blanco, A. Lauper and P. Rudolf von Rohr, ChemSusChem, 2017, 10, 1166–1174 CrossRef CAS PubMed.
- H. Reymond and P. Rudolf von Rohr, Rev. Sci. Instrum., 2017, 88, 114103 CrossRef PubMed.
- M. Buldakov, B. Korolev, I. Matrosov, D. Petrov and A. Tikhomirov, J. Appl. Spectrosc., 2013, 80, 124–128 CrossRef CAS.
- Y. Gao, L. Dai, H. Zhu, Y. Chen and L. Zhou, Chin. J. Anal. Chem, 2019, 47, 67–76 CAS.
- L. J. Venstrom, P. Hilsen and J. H. Davidson, Chem. Eng. Sci., 2018, 183, 223–230 CrossRef CAS.
- D. V. Petrov, I. I. Matrosov, A. R. Zaripov and A. S. Maznoy, Spectrochim. Acta, Part A, 2019, 215, 363–370 CrossRef CAS PubMed.
- Y. Numata, Y. Shinohara, T. Kitayama and H. Tanaka, Process Biochem., 2013, 48, 569–574 CrossRef CAS.
- H. Reymond, Gaining Light into High-Pressure Carbon Dioxide Hydrogenation to Chemical Energy Carriers. ETH Zurich, 2017 Search PubMed.
- R. Gaikwad, Carbon Dioxide to Methanol: Stoichiometric Catalytic Hydrogenation under High Pressure Conditions, Universitat Rovira i Virgili, 2018 Search PubMed.
- J. Schumann, T. Lunkenbein, A. Tarasov, N. Thomas, R. Schlögl and M. Behrens, ChemCatChem, 2014, 6, 2889–2897 CrossRef CAS.
- D. K. Veirs and G. M. Rosenblatt, J. Mol. Spectrosc., 1987, 121, 401–419 CrossRef CAS.
- G. Tejeda, B. Maté and S. Montero, J. Chem. Phys., 1995, 103, 568–576 CrossRef CAS.
- R. Lemus, M. Sánchez-Castellanos, F. Pérez-Bernal, J. M. Fernández and M. Carvajal, J. Chem. Phys., 2014, 141 Search PubMed.
- F. Thibault, R. Z. Martinez, J. L. Domenech, D. Bermejo and J. Bouanich, J. Chem. Phys., 2002, 117, 2523–2531 CrossRef CAS.
- D. Petrov, I. Matrosov, D. Sedinkin and A. Zaripov, Opt. Spectrosc., 2018, 124, 8–12 CrossRef CAS.
- Y. Yu, Y. Wang, K. Lin, N. Hu, X. Zhou and S. Liu, J. Phys. Chem. A, 2013, 117, 4377–4384 CrossRef CAS PubMed.
- F. Billes, I. Mohammed-Ziegler and H. Mikosch, Phys. Chem. Chem. Phys., 2011, 13, 7760–7772 RSC.
- M. J. Pelletier, Appl. Spectrosc., 2003, 57, 20A–42A CrossRef CAS PubMed.
- J. C. Lagarias, J. A. Reeds, M. H. Wright and P. E. Wright, SIAM J. Control, 1998, 9, 112–147 Search PubMed.
- G. F. Froment, K. B. Bischoff and J. De Wilde, Chemical reactor analysis and design, John Wiley & Sons, Hoboken, New Jersey, 3rd edn, 2011 Search PubMed.
- G. Soave, Chem. Eng. Sci., 1972, 27, 1197–1203 CrossRef CAS.
- B. J. Lommerts, G. H. Graaf and A. Beenackers, Chem. Eng. Sci., 2000, 55, 5589–5598 CrossRef CAS.
- G. H. Graaf and J. Winkelman, Ind. Eng. Chem. Res., 2016, 55, 5854–5864 CrossRef CAS.
- J. R. Dormand and P. J. Prince, J. Comput. Appl. Math., 1980, 6, 19–26 CrossRef.
- L. F. Shampine and M. W. Reichelt, SIAM J. Control, 1997, 18, 1–22 Search PubMed.
- M. Shimokawabe, H. Asakawa and N. Takezawa, Appl. Catal., 1990, 59, 45–58 CrossRef CAS.
- J. P. Breen and J. R. H. Ross, Catal. Today, 1999, 51, 521–533 CrossRef CAS.
- D. S. Moore, The basic practice of statistics, 6th edn, W. H. Freeman, US, 2012 Search PubMed.
Footnote |
| † Electronic supplementary information (ESI) available. See DOI: 10.1039/d0ra04455e |
| This journal is © The Royal Society of Chemistry 2020 |

