DOI:
10.1039/D0RA00222D
(Paper)
RSC Adv., 2020,
10, 23702-23711
Electromagnetic and microwave absorption properties of iron pentacarbonyl pyrolysis-synthesized carbonyl iron fibers
Received
8th January 2020
, Accepted 14th June 2020
First published on 22nd June 2020
Abstract
The present study executed iron pentacarbonyl pyrolysis to synthesize one-dimensional structured carbonyl iron fibers (CIFs) via carrier gas induced flow. The obtained CIFs with a diameter of 100–300 nm and length–diameter ratio of more than 20, are actually composed of a large number of nanocrystalline aggregates. We investigated the dependence of the structure, morphology, and static magnetic and electromagnetic properties of the CIFs on the pyrolysis temperatures. CIFs synthesized at 300 °C (denoted as CIF-300) exhibited optimal microwave absorption properties dependent on the fiber structure and well-matched impedance. An optimal reflection loss of −58.1 dB was observed at 13.8 GHz with a matching thickness of 1.43 mm. Furthermore, CIF-300 presented a broad effective absorption bandwidth (RL ≤ −10 dB) of 5.66 GHz with a thickness of 1.44 mm, indicating that it could be applied in practical applications from 3.74 GHz to 18.0 GHz by tuning its thickness from 1.0 mm to 4.0 mm. This paper not only reveals that the CIFs synthesized at 300 °C have great potential application in microwave absorbing materials (MAMs) with thin thicknesses, wide absorption bandwidths, and strong absorption intensities, but also provides a simple approach to prepare metal fibers.
1. Introduction
Nowadays, electromagnetic (EM) interference and pollution in both the military and governmental arenas have become serious concerns due to the rapid development of communication technology, thus requiring the urgent development of high-efficiency microwave absorbing materials (MAMs). Past significant efforts have been devoted toward exploring ideal light weight, thin thickness, and broad absorption bandwidth MAMs.1–3 In general, MAMs can be categorized into two loss mechanisms: dielectric loss, and magnetic loss.4,5 Magnetic loss MAMs exhibit strong absorption, thin thickness, and broad absorption bandwidth, which benefits from both dielectric and magnetic loss.6,7
Carbonyl iron (CI) has received recognition as compared to other MAMs due to its high saturation magnetization (Ms), high Curie temperature, substantial magnetic permeability, and significantly wide absorption bandwidth.8 Nonetheless, as a magnetic metal MAMs, CI has a relatively high density (∼7 g cm−3), as well as a high filling content when used as MAMs (generally more than 70 wt%),9–11 thereby resulting in a significant increase in EM absorber weight. In our previous research,12 the effects of particle size on electromagnetic properties of spherical CI was investigated, and the filling content reached 80 wt%. Although the flake CI, obtained by ball milling, shows improved microwave absorption performance, its filling content is still high.13–16 In recent years, hollow or porous structured CI have also been employed in high-performance MAMs applications. Yin et al.17 adopt pitting corrosion to prepare hollow CI microspheres. The calculated reflection loss (RL) of the hollow CI for 0.5 mm or 1.0 mm thickness is much better than that of the initial one, whereas the filling content is still as high as 80 wt%. Wang et al.18 produced an annealing and selective pitting corrosion method for the synthesis of porous CI flakes, of which the results presented an RL of less than −20 dB over the range of 2.9 GHz to 20 GHz following thickness tuning from 0.9 mm to 4.5 mm. Nan et al.19 construct synchronous microstructure with Fe microfibers and flake CI, thin and light microwave absorbers operating in the broadband range were obtained under the state of low content because of the synergy between the two components and the synchronous orientation of the fillers.
The fiber magnetic MAMs have received recognition for their novel chemical and physical properties.20,21 Novel electroless plated Fe–Co binary hollow fibers exhibit excellent EM properties within GHz frequency ranges at a filling content of only 30 wt% as well as adjustable soft magnetic properties through their fiber alignments.22 Shen et al.23 synthesized magnetic hexaferrite SrFe12O19/α-Fe composite nanowires that presented an optimized RL value of −51.1 dB at a thickness of 3.0 mm and an absorption bandwidth exceeding −20 dB encompassing the entire G-band, X-band, and 20% Ku-band at a thickness of 4.0 mm. The one-dimensional (1D) fiber structure can enable magnetic MAMs to maintain good absorption performance while the density and filling content of MAMs are greatly reduced.22,23 Magnetic metals with fiber structures have been examined to completely comprehend the potential of metallic MAMs as EM absorption materials due to their lightweight and even distribution in composite materials. Barakat et al.24 adopted a two-step method of electrospinning and calcination to prepare CoNi bimetallic nanofibers, which revealed better magnetic properties compared with those of Co-doped Ni and pristine Ni nanofibers. Nie et al.25 and Li et al.26 fabricated iron fibers and Fe55Ni45 fibers with diameter of 5 μm by magnetic-field-induced thermal decomposition, respectively. However, the required equipment in their experiment is complex. Therefore, it is of great significance to prepare 1D iron fibers with enhanced EM properties through a facile process.
In the present work, we report a carrier gas induced flow process for the fabrication of 1D structured carbonyl iron fibers (CIFs) to achieve lightweight and high-efficiency MAMs. Compared to the magnetic-field-induced thermally decomposition process of metal fibers reported in previous research,25–27 our method does not require complex equipment. The phase structure, morphology, static magnetic, and EM properties of CIFs were thoroughly determined. We also systematically examined the optimized pyrolysis temperatures of iron pentacarbonyl (Fe(CO)5) that were required to produce high-performance CIFs, as well as its microwave absorption performances and loss mechanism. The CIFs synthesized at 300 °C, termed CIF-300, exhibited a thin absorber thickness, strong absorption intensities, and broad absorption bandwidth. Besides, this work provides a simple approach to prepare metal fibers (such as iron fibers or nickel fibers) as efficient MAMs.
2. Experimental
2.1 Synthesis of CIFs
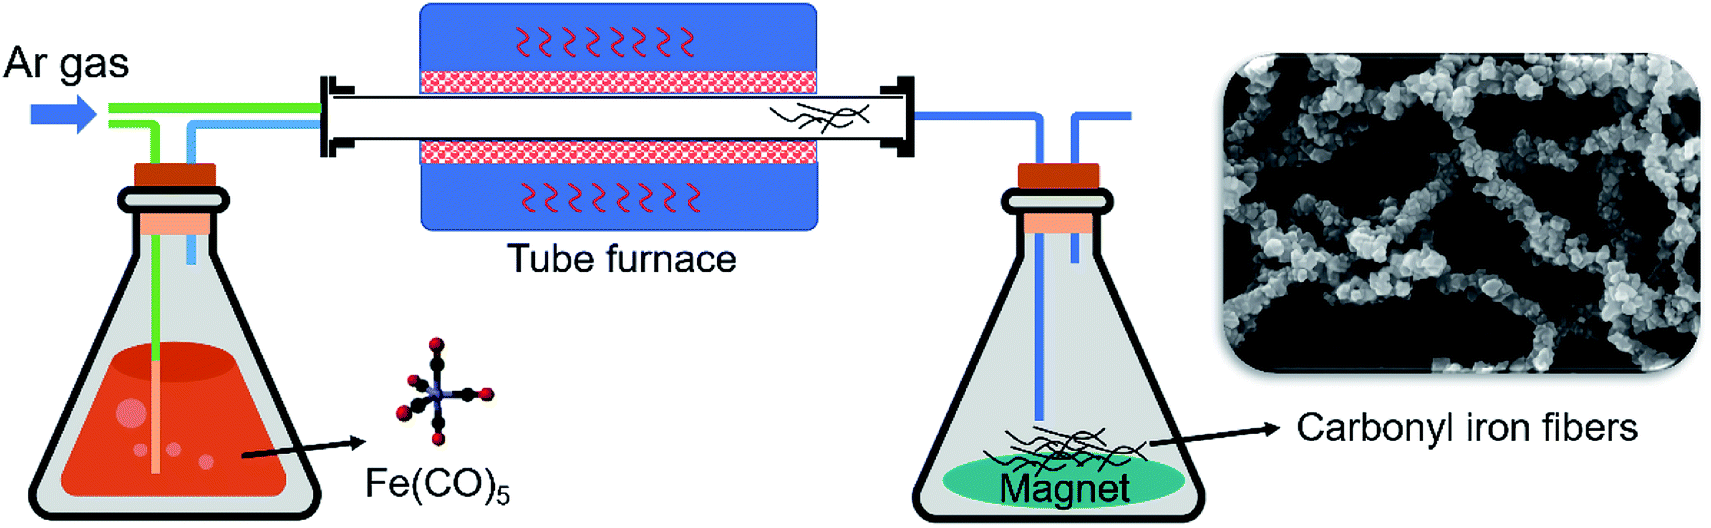
Fig. 1 presents a schematic illustration of the CIFs synthesis process, which followed the pyrolysis of Fe(CO)5. CIFs generation was executed based on the following equation: Fe(CO)5 = Fe + 5CO. 20 mL of Fe(CO)5 (99.9%; supplied by Shaanxi XingHua Chemical Co. Ltd., China) was first decanted into the evaporator, after which argon (Ar) gas was injected into the experimental system for 2 h to remove the air in the tube furnace and evaporator. Subsequently, the argon supply of the evaporator was turned off. After the tube furnace was heated and maintained under the required temperature, the argon supply of the tube furnace was shut off and the argon supply of the evaporator was turned on. Fe(CO)5 vapor with Ar gas was continuously injected into the tube furnace at a rate of 1 L min−1 for 1 h. Product collection proceeded using a magnet in the conical flask. The system was permitted to cool down to room temperature under the protection of Ar gas, after which the CIFs were obtained. The final CIFs were denoted as CIF-250, CIF-300, CIF-350 and CIF-400, corresponding to the pyrolysis temperatures of 250 °C, 300 °C, 350 °C and 400 °C, respectively.
 |
| | Fig. 1 Schematic illustration depicting the CIFs synthesis process. | |
2.2 Characterizations
The present study employed Rigaku D/max-2400 X-ray diffraction (XRD) with Cu Kα irradiation at 40 kV and 40 mA to measure the CIFs phase structure. Scanning electron microscopy (SEM, ZEISS Merlin Compact) was employed to characterize the CIFs morphology. The carbon contents and surface chemical composition of the CIFs were analyzed by high frequency infrared carbon/sulphur determinator (LEKO, CS230), X-ray photoelectron spectrometry (XPS) (EscaLab 250Xi). Raman spectra were obtained by a cryogenic matrix isolated Raman spectroscopic system (LabRAM HR Evolution). A Quantum Design PPMS vibrating sample magnetometer (VSM) was employed to characterize the CIFs hysteresis loops. The CIFs were uniformly mixed with paraffin wax at a mass ratio of 45 wt% to measure the complex permittivity (εr = ε′ − jε′′) and permeability (μr = μ′ − jμ′′). Traditionally, 0.55 g paraffin wax was put into a crucible to heat to melt, 0.45 g CIFs was added and stir it quickly to make the mixture evenly. After cooling, grind with a mortar, then melt and stir, repeat 3 times. Finally, the powder was filled into a coaxial clapper mold and compacted into a circular coaxial sample with an outer diameter of 7.0 mm, an inner diameter of 3.04 mm and a length of 2.0–3.5 mm. A vector network analyzer (Keysight E5071C) was employed to quantify the εr and μr via the transmission/reflection coaxial line method within 2 GHz to 18 GHz.
3. Results and discussion
3.1 Structure and morphology
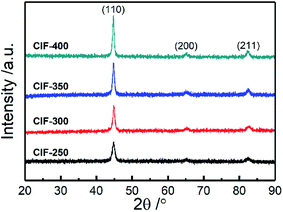
The present study characterized the crystalline structures of CIFs synthesized at various pyrolysis temperatures (250 °C, 300 °C, 350 °C, and 400 °C) by XRD (Fig. 2). All of the samples exhibited three well-resolved diffraction peaks at 2θ = 44.8°, 65.1°, and 82.4°, which can be denoted to the (110), (200), and (211) α-Fe planes with a body-centered cubic structure (JCPDS card no. 06-0696),18 respectively. The intensities of diffraction peaks for the α-Fe are enhanced with the increasing pyrolysis temperature, indicating gradual improvements in the Fe nanoparticle crystallinity. The average grain sizes of CIF-250, CIF-300, CIF-350, and CIF-450, which are estimated by the Scherrer formula, were 12.0, 15.8, 16.4 and 17.9 nm, respectively. It is shown that the increase of pyrolysis temperatures can enhance the growth of the grain size.
 |
| | Fig. 2 XRD patterns of CIFs synthesized at various pyrolysis temperatures. | |
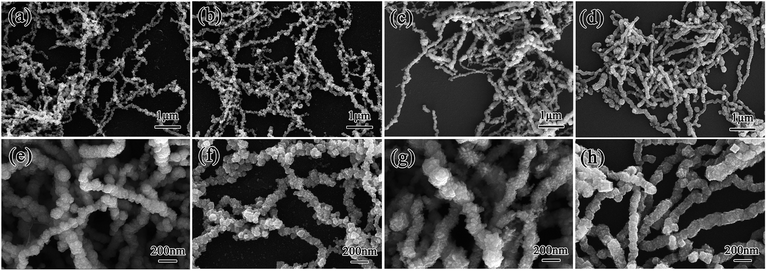
Fig. 3 presents the morphologies of the synthesized CIFs at various pyrolysis temperatures. The CIFs with diameters ranging from 100 nm to 300 nm are formed with the aggregation of nanocrystalline grains. All four samples demonstrate rough fiber surfaces with some exhibiting granular protuberances and are essentially assembled by the accumulation of nanoparticles. The length–diameter ratio of CIF-250 and CIF-300 are more than 50. Yet, when the pyrolysis temperature is further increased, the length–diameter ratio decreases, and the length–diameter ratio of CIF-400 is about 20. It can be seen that the pyrolysis temperature significantly affects the nanostructures of CIFs. On the one hand, Fe(CO)5 vapor introduced into the tube furnace is decomposed at a certain temperature to obtain iron nanocrystalline grains. Under the induction of airflow and spontaneous magnetization of magnetic nanocrystal grains at high temperature, iron nanocrystal grains aggregate, assemble and grow to form CIFs. At a given decomposition temperature, the decomposition reaction rate and the growth rate of the crystal are slow, the heat and mass transfer at the crystal growth interface is stable, and the crystal grows evenly in all directions and forms a granular shape. On the other hand, with the increase of pyrolysis temperature, the decomposition rate of Fe(CO)5 is accelerated. Due to the imbalance of heat and mass transmission, the growth rate of each crystal surface in the crystal is of great different, resulting in the length–diameter ratio of the fiber and the particles that make up the CIFs become smaller. Furthermore, the nanocrystalline fiber particles presented a significant number of gaps, thus increasing the specific surface area and reducing the CIFs density.
 |
| | Fig. 3 SEM images of CIFs synthesized at various pyrolysis temperatures: (a and e) CIF-250, (b and f) CIF-300, (c and g) CIF-350, and (d and h) CIF-400. | |
The carbon contents of CIF-250, CIF-300, CIF-350, and CIF-400 were 1.22, 2.05, 2.86, and 2.74 wt%, respectively, which were first increased with the pyrolysis temperatures, and then decreased. During the pyrolysis process of Fe(CO)5, two chemical reactions occur: Fe(CO)5 = Fe + 5CO and 2CO = C + CO2. The first reaction is endothermic, and the second is exothermic. The increased pyrolysis temperature is conducive to promote the activation energy of molecules in the first reaction, intensifying the pyrolysis of Fe(CO)5 and increasing the concentration of CO, which is beneficial to the second reaction, thus increasing the percentage of carbon. However, the excessive temperature will inhibit the pyrolysis reaction of CO, thereby reducing the carbon content in the CIFs.
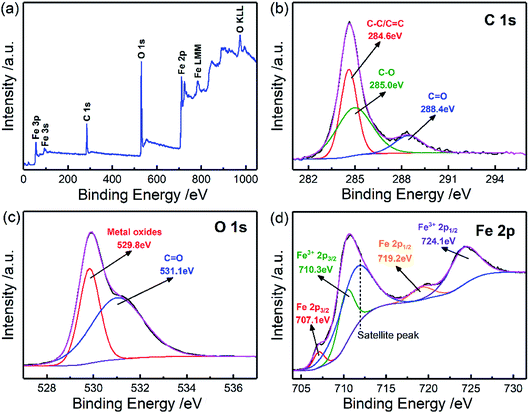
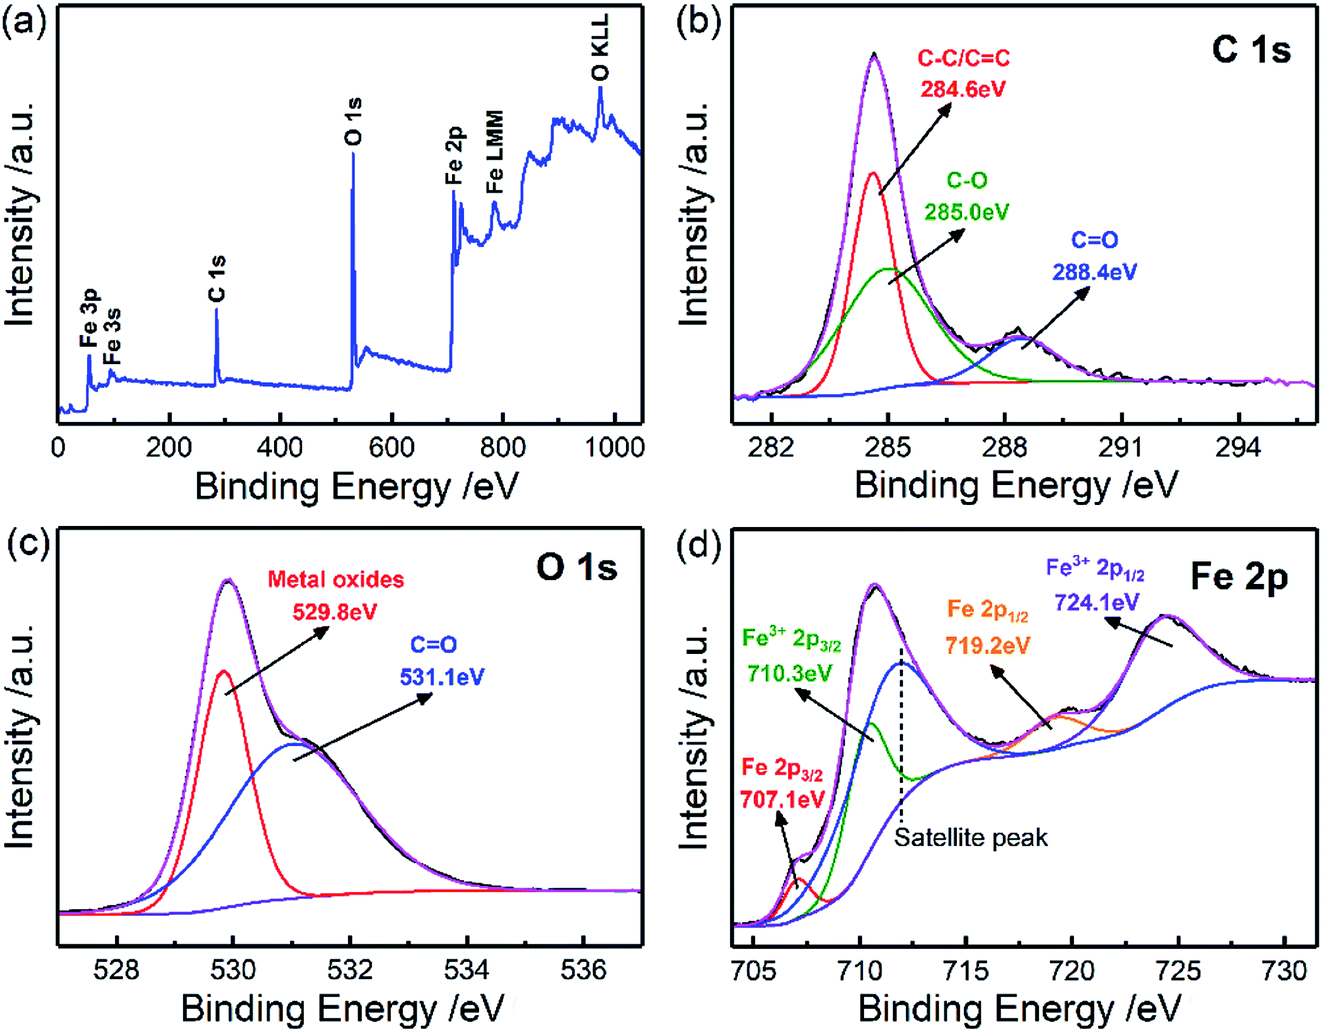
In order to investigate the element composition and atom valence state of the CIFs, the XPS spectrum of CIF-300 was analyzed, as shown in Fig. 4. The XPS survey spectrum demonstrates that Fe, C, and O elements were presented on the surface of CIF-300 (Fig. 4a). In detail, signals of Fe 3p, Fe 3s, C 1s, O 1s, Fe 2p, Fe LMM, and O KLL can be seen. Therefore, O elements may originate from surface iron oxides. For the C 1s HR-XPS spectrum (Fig. 4b), the three peaks are corresponded to C–C/C![[double bond, length as m-dash]](https://www.rsc.org/images/entities/char_e001.gif) C (284.6 eV), C–O (285.0 eV), and CO (288.4 eV), respectively. The O 1s HR-XPS spectrum can be deconvoluted into two peaks as displayed in Fig. 4c. Peaks at 529.8 eV belong to the metal oxides, and peaks at 531.1 eV belong to CO. For the Fe 2p HR-XPS spectrum (Fig. 4d), there are three unique Fe status corresponding to Fe, Fe3+ and satellite peaks. The peaks located at 710.3 eV and 724.1 eV were related to the Fe3+ 2p3/2 and Fe3+ 2p1/2 electrons, respectively, while the binding energies at 707.1 eV and 719.2 eV should correspond to the metallic Fe state. XPS analysis results show that some Fe elements on the surface of CIF-300 are oxidized to Fe2O3.
C (284.6 eV), C–O (285.0 eV), and CO (288.4 eV), respectively. The O 1s HR-XPS spectrum can be deconvoluted into two peaks as displayed in Fig. 4c. Peaks at 529.8 eV belong to the metal oxides, and peaks at 531.1 eV belong to CO. For the Fe 2p HR-XPS spectrum (Fig. 4d), there are three unique Fe status corresponding to Fe, Fe3+ and satellite peaks. The peaks located at 710.3 eV and 724.1 eV were related to the Fe3+ 2p3/2 and Fe3+ 2p1/2 electrons, respectively, while the binding energies at 707.1 eV and 719.2 eV should correspond to the metallic Fe state. XPS analysis results show that some Fe elements on the surface of CIF-300 are oxidized to Fe2O3.
 |
| | Fig. 4 XPS spectrum of the representative CIFs (CIF-300) for (a) survey spectra, (b) C 1s, (c) O 1s, and (d) Fe 2p. | |
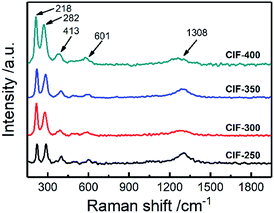
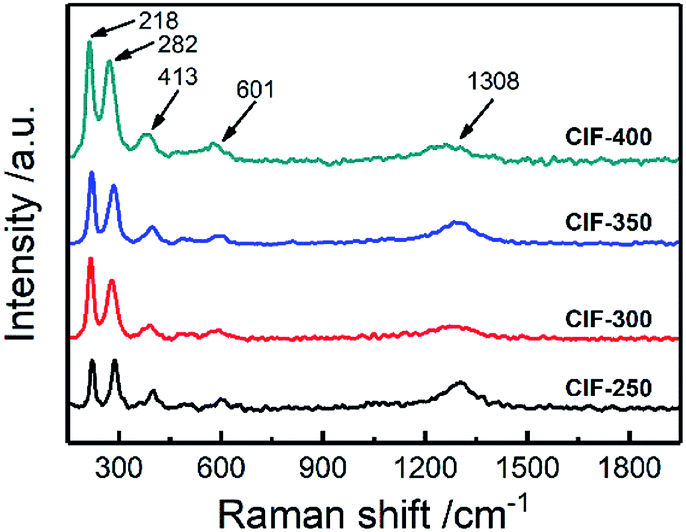
Raman spectrum was utilized to further analyze the state of Fe element in CIFs, and the results are shown in Fig. 5. All the samples exhibit five distinct peaks located at 218 cm−1, 282 cm−1, 413 cm−1, 601 cm−1, and 1308 cm−1, respectively, which are corresponded to Fe2O3 phase.28,29 The Raman peak appearing at 218 cm−1 assigned to A1g mode, and those at 282 cm−1 and 611 cm−1 were assigned to Eg modes.28 Whether the peak observed at 1308 cm−1 is classified as a hematite two-magnon scattering is still controversial.29 In addition, the peak located at 1340 cm−1 cannot be identified because it has a similar position to that of a peak of Fe2O3. Fe2O3 comes from the oxidation of CIFs in the air. Since there is no characteristic peak of Fe2O3 in the XRD analysis, the content of Fe2O3 should be very low and only exist on the surface of CIFs.
 |
| | Fig. 5 Raman spectra of CIFs synthesized at various pyrolysis temperatures. | |
3.2 Static magnetic properties
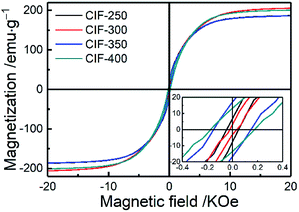
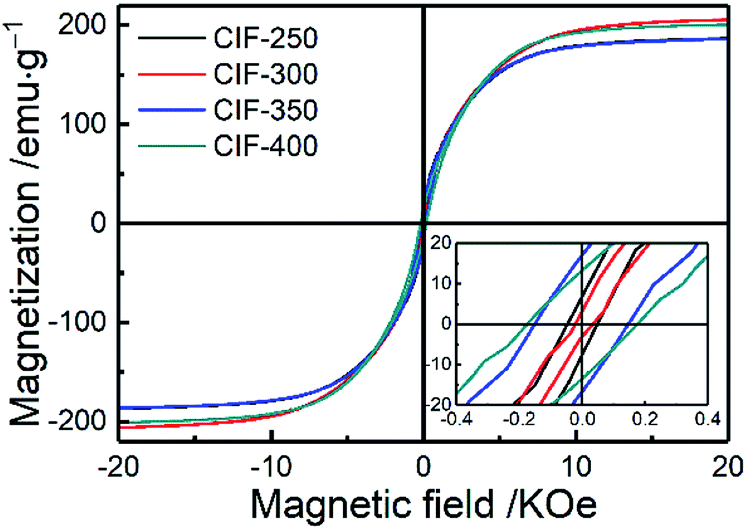
The magnetic hysteresis loops of the synthesized CIFs are presented in Fig. 6, which demonstrate typical magnetization hysteresis loops of ferromagnetic materials with high saturation magnetization (Ms) and low coercivity (Hc) values. The Ms values for CIF-250, CIF-300, CIF-350, and CIF-400 are 175.8, 205.8, 179.8, and 200.8 emu g−1, respectively. Obviously, the pyrolysis temperature should be the main reason for the difference of Ms values. On one hand, the crystalline degree and grain size of Fe nanoparticles are enhanced through the high pyrolysis temperature, which aids in organizing the magnetic domain orders under an external field and enhances Ms.30 On the other hand, the Ms value is also significantly dependent upon the number of atoms per unit volume.5 The content of carbon, which is non-magnetic and makes little contribution to magnetization, were first increased and then decreased with the pyrolysis temperatures. Both of these two facts are considered to be responsible for the fluctuation of Ms. The Ms value increase as the pyrolysis temperature increased from 250 to 300 °C, indicating that the enhancement of grain size on Ms is greater than the inhibition of carbon content on Ms. When the pyrolysis temperature increased to 350 °C, the Ms value decreased, indicating that the inhibition of carbon content on Ms is greater than the enhancement of grain size on Ms. As the pyrolysis temperature further increased to 400 °C, the increasement of Ms is mainly due to the drop in carbon content.
 |
| | Fig. 6 Magnetic hysteresis loops of CIFs synthesized at various pyrolysis temperatures, wherein inset presents the details around the zero magnetic fields. | |
The lower-right inset of Fig. 6 presents details surrounding zero magnetic fields, wherein CIF-250, CIF-300, CIF-350, and CIF-400 present Hc values of 60.5, 21.6, 190.1, and 175.7 Oe, respectively. The Hc significantly correlates with the grain size and magnetic anisotropy,12 such that grain size growth increases the Hc for grain sizes smaller than the single domain critical size of iron (28 nm).31 The XRD results revealed a CIFs grain size of less than 28 nm for all of the synthesized samples, indicating the effect of the grain size on the observed fluctuations in Hc.
3.3 Electromagnetic properties
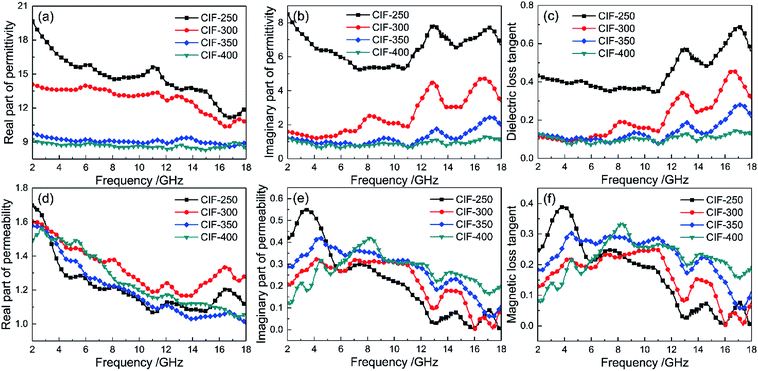
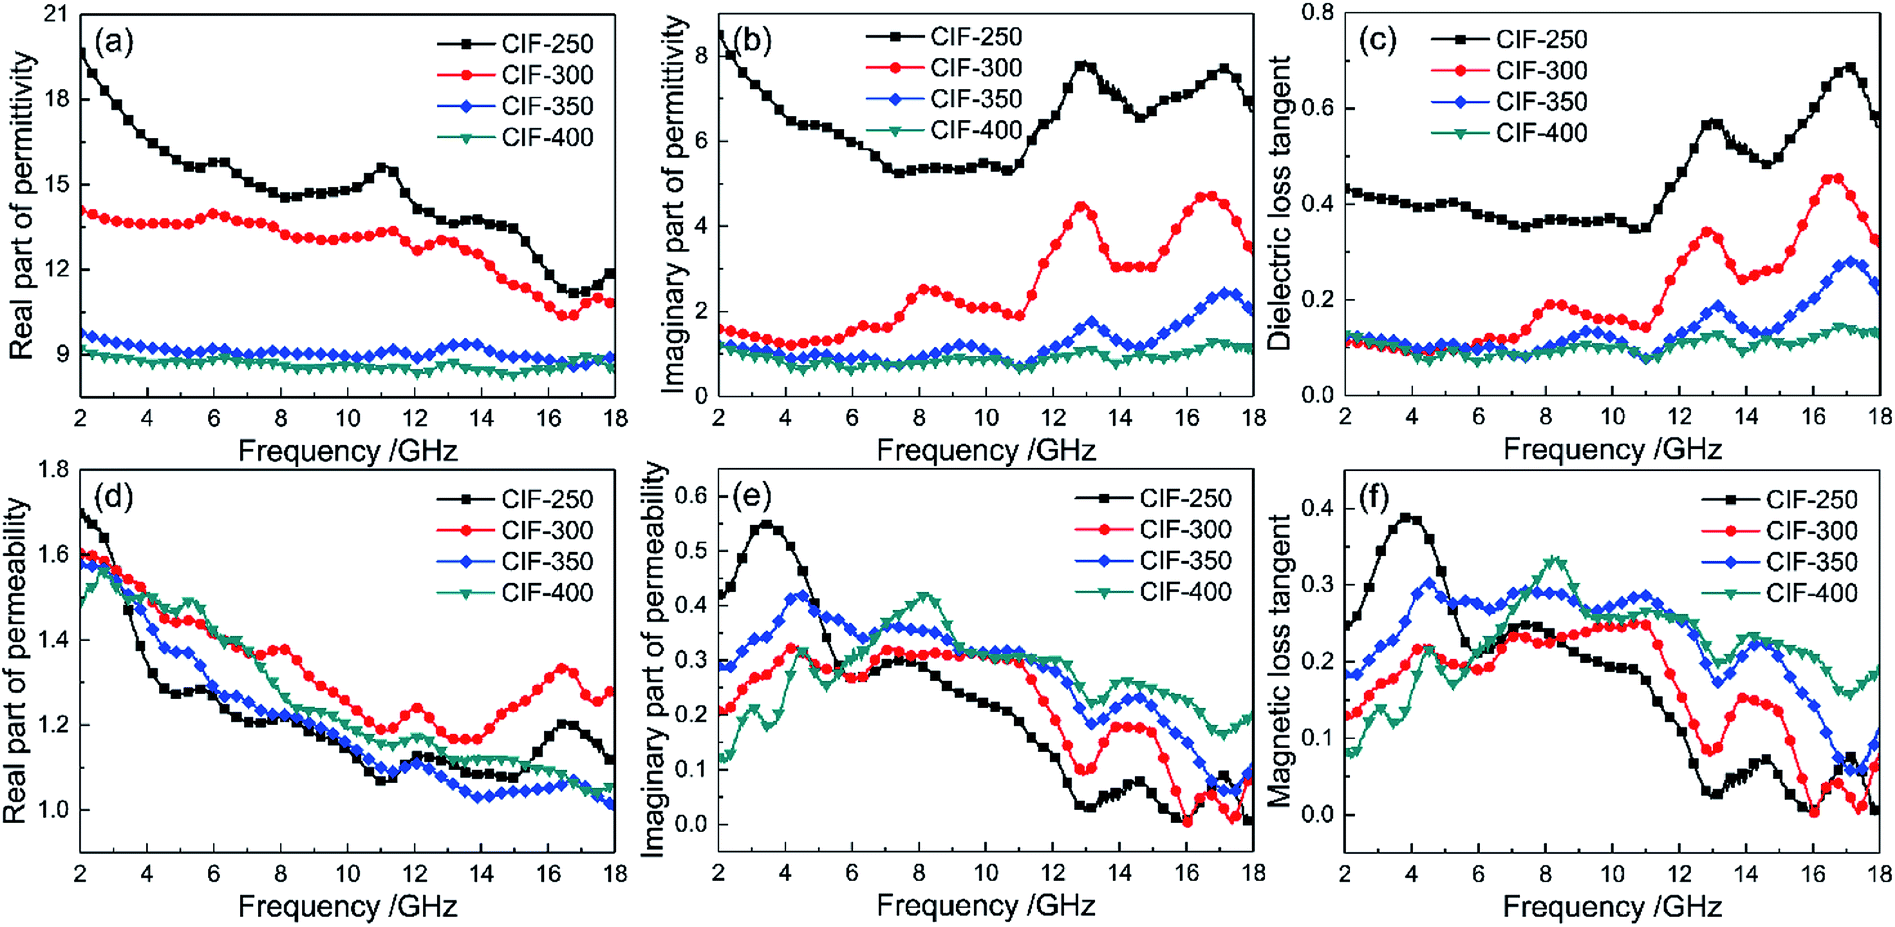
The εr and μr of the CIFs/paraffin composites loading with 45 wt% of CIFs were investigated within 2 GHz to 18 GHz to characterize the EM properties of the synthesized CIFs. Based on the transmission line theory, the ε′ and μ′ define the storage capability of electric and magnetic energy, respectively, whereas the ε′′ and μ′′ define the loss capability of electric and magnetic energy, respectively.32 Fig. 7a and b present the ε′ and ε′′ of the CIFs synthesized at different pyrolysis temperatures, respectively. Both ε′ and ε′′ of CIF-250, CIF-300, and CIF-350 drastically decrease in the entire measured frequency range. When the pyrolysis temperatures increased from 350 °C to 400 °C, the ε′ and ε′′ decline slightly. CIF-250 demonstrates the highest ε′ and ε′′ values than the other three samples. This may be due to the decrease in the length of the CIFs as the pyrolysis temperature increases. When the filling ratio is the same, the electrical conductivity of the CIFs/paraffin composites decrease, resulting in a decrease of εr. The dielectric loss tangent (tan![[thin space (1/6-em)]](https://www.rsc.org/images/entities/char_2009.gif) δe = ε′′/ε′) of the samples are shown in Fig. 7c. CIF-250 presents a relatively high tanδe across the entire tested frequency range due to its high energy storage and dissipation abilities. In comparison, the other three samples present constant tanδe values within 2 GHz to 6 GHz, of which the tanδe gradually decreased with the increased pyrolysis temperatures across the remaining frequencies. The resonant peaks around 8, 13, and 17 GHz suggest the execution of several polarization relaxation processes in the composites beneath the radiation of rotating EM waves.
δe = ε′′/ε′) of the samples are shown in Fig. 7c. CIF-250 presents a relatively high tanδe across the entire tested frequency range due to its high energy storage and dissipation abilities. In comparison, the other three samples present constant tanδe values within 2 GHz to 6 GHz, of which the tanδe gradually decreased with the increased pyrolysis temperatures across the remaining frequencies. The resonant peaks around 8, 13, and 17 GHz suggest the execution of several polarization relaxation processes in the composites beneath the radiation of rotating EM waves.
 |
| | Fig. 7 Complex permittivity (a and b), dielectric loss tangent (c), complex permeability (d and e), and magnetic loss tangent (f) of CIFs synthesized at various pyrolysis temperatures. | |
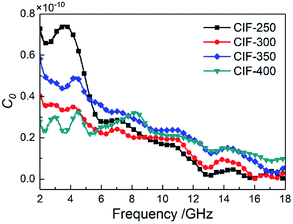
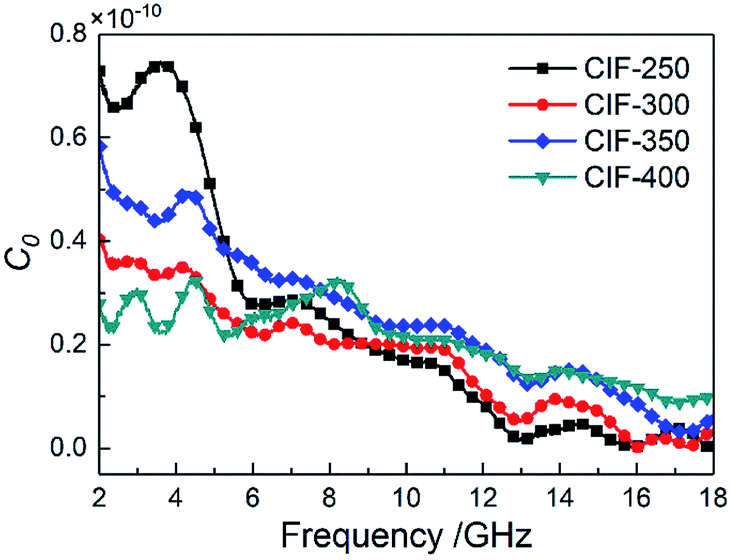
Fig. 7d–f present the μ′, μ′′, and magnetic loss tangent (tanδm = μ′′/μ′) of the CIFs synthesized at various pyrolysis temperatures, respectively. The μ′ of the specimens present a gradual decrease tendency with increasing frequency. Notably, among the four samples, CIF-300 exhibits the highest μ′ at the majority of the test frequency range, indicating that CIF-300 has higher magnetic energy storage capabilities as compared to CIF-250, CIF-350, and CIF-400. CIF-250 shows the highest μ′′ at the 2 GHz to 5 GHz. In comparison, CIF-400 exhibits the highest μ′ and tanδm within 7 GHz to 18 GHz, indicating its optimal magnetic energy dissipation capabilities. A positive correlation is observed between the CIFs tanδm and the pyrolysis temperatures within 7 GHz to 18 GHz. Furthermore, the curves of tanδm present three obvious resonance peaks around 4 GHz and 14 GHz. The magnetic loss the GHz range is largely originated from natural ferromagnetic resonance and eddy current loss.33 The magnetic loss only initiate from the eddy current loss given the constancy of C0 = f−1(μ′)2μ′′ regardless of frequency.34 However, the C0 values of the CIFs synthesized at various pyrolysis temperatures varies within 2 GHz to 13 GHz (Fig. 8) and do not exhibit significant changes in the remaining frequencies. Therefore, the resonance peaks around 4 GHz are assumed to originate from natural resonances, whereas the peaks around 14 GHz are a result of eddy current loss.
 |
| | Fig. 8 C0 of CIFs synthesized at various pyrolysis temperatures. | |
3.4 Microwave absorption properties
Based on the transmission line theory, the RL of a single-layer absorber could be evaluated as follows:35| | |
RL = 20lg|(Zin − Z0)/(Zin + Z0)|
| (1) |
| |
 | (2) |
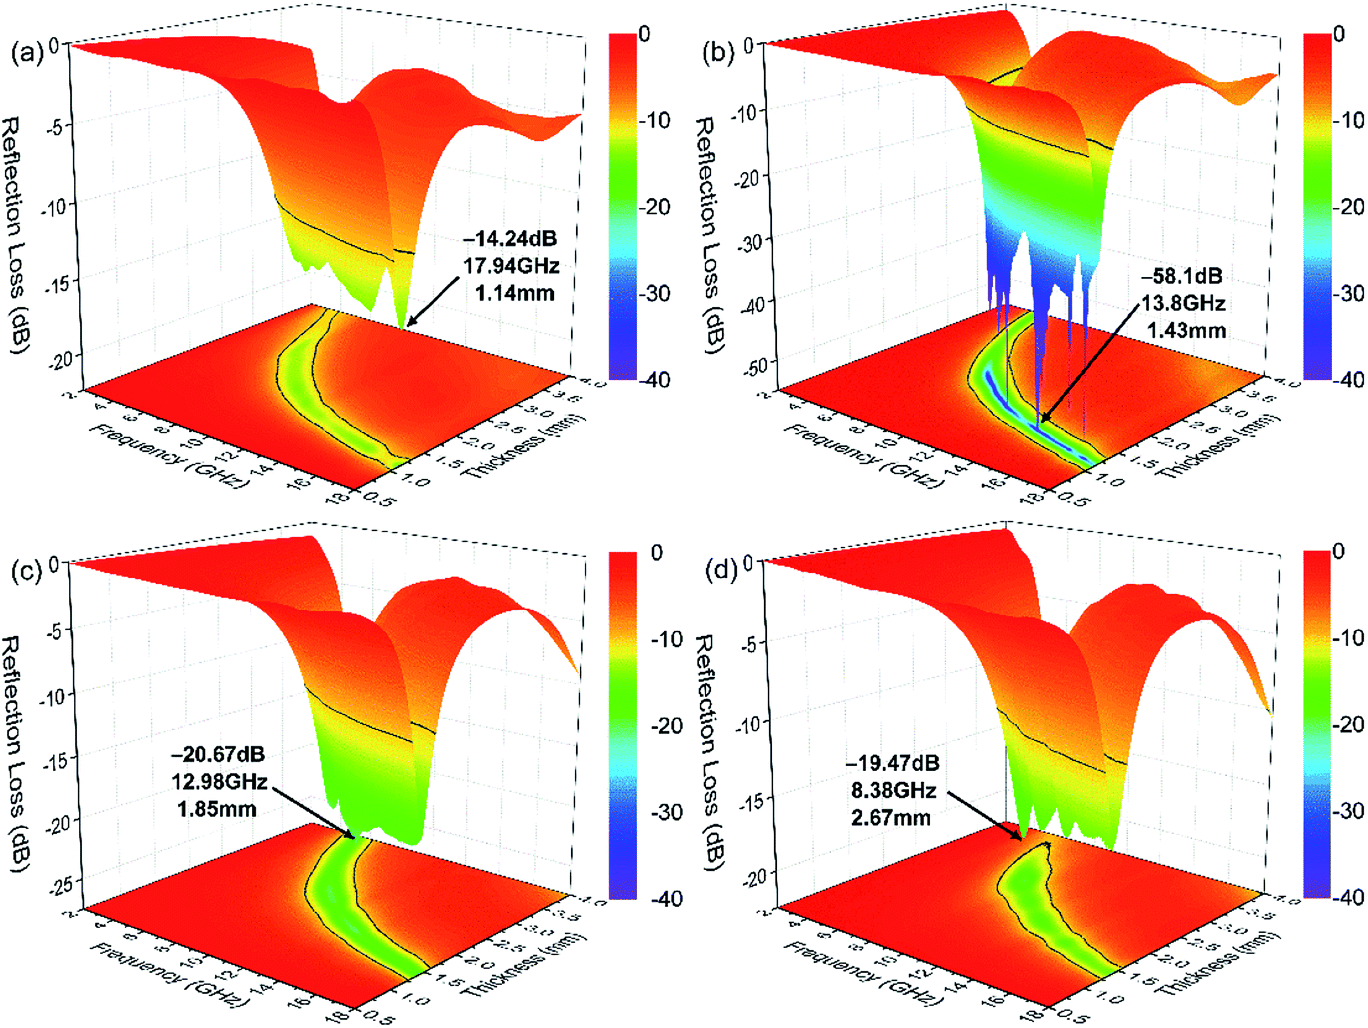
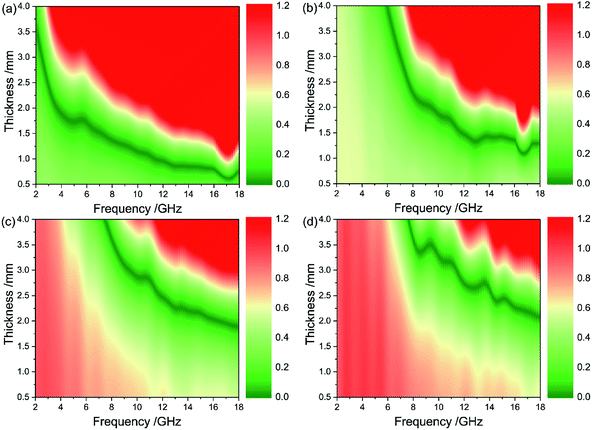
where Zin is defined as the absorber input characteristic impedance, Z0 defines the intrinsic impedance of the free space, c is the velocity of light, d is the absorber thickness, and f is the incident EM wave frequency. The RL value of common applications must be lower than −10 dB to allow 90% of the incident EM wave to be attenuated. The RL was evaluated according to the eqn (1) and (2) to investigate the effect of the pyrolysis temperatures on the microwave absorption characteristics of the CIFs. Fig. 9 presents the 3D plots of the calculated RL for the synthesized CIFs at variable absorber thicknesses varying from 0.5 mm to 4.0 mm. Although all of the samples exhibit the incident EM wave loss, their concrete performances differ greatly and are sensitive to the pyrolysis temperature. CIF-250 exhibit relatively poor microwave absorption properties (Fig. 9a). A minimum reflection loss (RLmin) of only −14.24 dB at 17.94 GHz is observed at an absorber thickness of 1.14 mm. The RL values of CIF-300 exceed −10 dB for 3.74 GHz to 18 GHz with the absorber thicknesses ranging from 1.0 mm to 4.0 mm (Fig. 9b). The RLmin reach up to −58.1 dB at 13.8 GHz with an absorber thickness of 1.43 mm. When the pyrolysis temperature increased from 350 °C to 400 °C, CIF-350 and CIF-400 present RLmin of up to −20.67 dB at 12.98 GHz and −19.47 dB at 8.38 GHz with absorber thicknesses of 1.85 mm and 2.67 mm, respectively. The RL peaks of the CIFs shift to the low frequency area as the absorber thickness increased (Fig. 9). The thickness dependence of the RL peaks can be illustrated through the quarter-wavelength matching model:  4 where tm defines the matching thickness of RL.
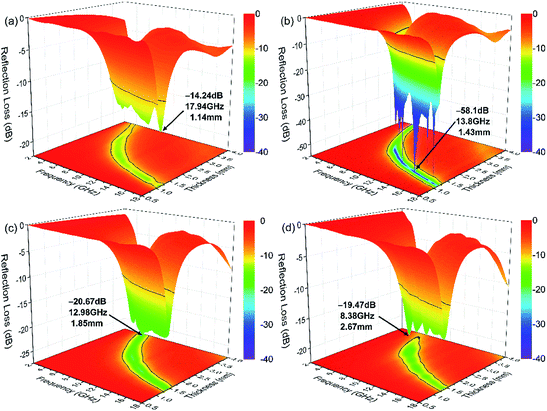 |
| | Fig. 9 3D plots of the calculated RL for the CIFs synthesized at various pyrolysis temperatures: (a) CIF-250, (b) CIF-300, (c) CIF-350, and (d) CIF-400. | |
Fig. 10a presents the effective absorption bandwidth (RL ≤ −10 dB) of the synthesized CIFs. All four samples exhibit effective absorption bandwidths of more than 4 GHz within the thickness range of 1.24 mm to 1.75 mm. CIF-300 exhibits a maximum bandwidth of 5.66 GHz with a thickness of 1.44 mm, which is the broadest of all of the four samples. Further, the inset of Fig. 10a presents the bandwidth correlating to the RL less than −20 dB. CIF-300 exhibit a bandwidth of more than 1.8 GHz with a thickness of 1.78 mm. While for the other three samples, the bandwidths corresponding to the RL less than −20 dB can be hardly seen. Fig. 10b demonstrates the comparison of the RLmin of the CIFs synthesized at various pyrolysis temperatures, wherein the RL values (below −10 dB) of CIF-250 and CIF-300 are observed at a wide thickness of 1.0 mm to 4.0 mm. In comparison, the RL values of CIF-350 and CIF-400 are below −10 dB at thicknesses ranging from 1.27 mm to 4.0 mm. CIF-300 with RL values of less than −20 dB concentrates in the thickness of 1.1 mm to 2.5 mm. In comparison, the RL values of the other three specimens barely reach −20 dB. Smaller absorber thickness is ideal for practical applications. Therefore, CIF-300 demonstrates the optimal microwave absorption performance at relatively thin coating thicknesses in contrast to the other three samples.
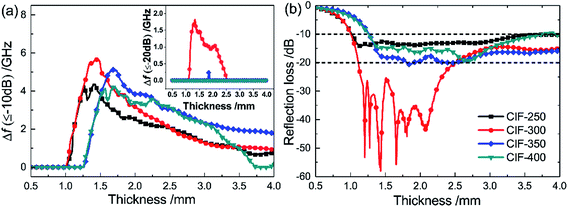 |
| | Fig. 10 Comparison of (a) effective absorption bandwidth (RL ≤ −10 dB) and (b) RLmin values of CIFs synthesized at various pyrolysis temperatures, wherein the insert in (a) denotes the bandwidth correlating to a RL of less than −20 dB. | |
Furthermore, the performances of the CIFs with those of typically published relative absorbers were further evaluated (Table 1). CIF-300 demonstrates broader absorption bandwidth, lower loading content, RLmin value, and matching thickness d as compared to those of hollow CI,17 porous CI flakes,18 aligned Fe microfiber,21 SrFe12O19/α-Fe nanowires,23 Fe55Ni45 fiber,26 and polycrystalline iron fibers.36 Compared to those of spherical CI,12 flaky CI,16 and Fe nanowire,37 the loading content and matching thickness d of the CIF-300 are relatively lower, which is beneficial to reduce the weight of absorbing coating. Moreover, the flaky CI14 exhibit broader absorption bandwidths and lower matching thickness. However, their loading content and RLmin value are also higher than the CIF-300. Although the Fe10Ni90 submicro fibers20 have a lower filling content, its RLmin and absorption bandwidths value are also lower. Thus, the CIFs synthesized with the pyrolysis temperatures of 300 °C, demonstrating stronger absorption intensities, broader absorption bandwidth, and thinner thicknesses, are ideal for high-performance practical MAMs.
Table 1 Contrast of microwave absorption properties of typical relative absorbers
| Absorber |
Filling content |
Optimal absorption |
Absorption bandwidth |
Ref. |
| RLmin/dB |
d/mm |
RL ≤ −10 dB/GHz |
d/mm |
RL ≤ −20 dB/GHz |
d/mm |
| Spherical CI |
80 wt% |
−56.9 |
1.50 |
7.44 |
1.38 |
2.4 |
1.29 |
12 |
| Flaky CI |
18 vol% |
−13.2 |
1.40 |
6.40 |
1.40 |
0 |
— |
14 |
| Flaky CI |
55 wt% |
−42.5 |
2.00 |
6.10 |
2.00 |
2.0 |
2.00 |
16 |
| Hollow CI |
80 wt% |
−10.7 |
1.00 |
2.40 |
1.00 |
0 |
— |
17 |
| Porous CI flakes |
20 vol% |
−41.8 |
3.50 |
4.14 |
1.20 |
1.0 |
1.20 |
18 |
| Fe10Ni90 submicro fibers |
20 wt% |
−45.4 |
2.00 |
3.78 |
2.00 |
1.0 |
2.00 |
20 |
| Aligned Fe microfiber |
50 wt% |
−12.1 |
1.20 |
3.61 |
1.2 |
0 |
— |
21 |
| SrFe12O19/α-Fe nanowires |
67 wt% |
−51.1 |
3.00 |
8.50 |
4.00 |
10.8 |
4.00 |
23 |
| Fe55Ni45 fiber |
20 vol% |
−6.5 |
1.20 |
0 |
— |
0 |
— |
26 |
| Fe nanowire |
29 vol% |
−47.0 |
2.00 |
6.40 |
1.70 |
1.6 |
1.70 |
37 |
| Polycrystalline iron fibers |
67 wt% |
−16.5 |
2.00 |
3.78 |
2.00 |
0 |
— |
36 |
| CIF-300 |
45 wt% |
−58.1 |
1.43 |
5.66 |
1.44 |
1.8 |
1.78 |
This work |
In general, the impedance matching and attenuation constant (α) significantly affect microwave absorption. MAMs with excellent absorption properties exhibit proper characteristic impedances that are equal/close to that of the free space, thereby reaching zero reflection. In addition, these samples should also present sufficiently strong EM wave attenuation abilities. A delta-function method effectively evaluate the impedance matching degree based on the equation:38,39
| | |
Δ = |sin h2(Kfd) − M|
| (3) |
where
K and
M are determined by
εr and
μr as follows:
| |
 | (4) |
| |
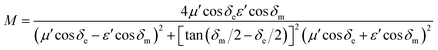 | (5) |
Based on the above equations, a smaller delta value results in better EM impedance matching. Fig. 11 presents the contour plots of the quantified delta for the CIFs synthesized at various pyrolysis temperatures. The green area (Δ < 0.4) of CIF-300 is larger than the other three samples. The green area of CIF-250 and CIF-300 are more concentrated in the thin absorber thickness region as compared to CIF-350 and CIF-400. The RL and the delta values of CIF-300 (Fig. 9b and 11b) exhibit the same trend, indicating that the enhanced microwave absorption properties of CIF-300 possibly due to good EM impedance matching.
 |
| | Fig. 11 Contour plots of calculated delta value for CIFs synthesized at various pyrolysis temperatures: (a) CIF-250, (b) CIF-300, (c) CIF-350, and (d) CIF-400. | |
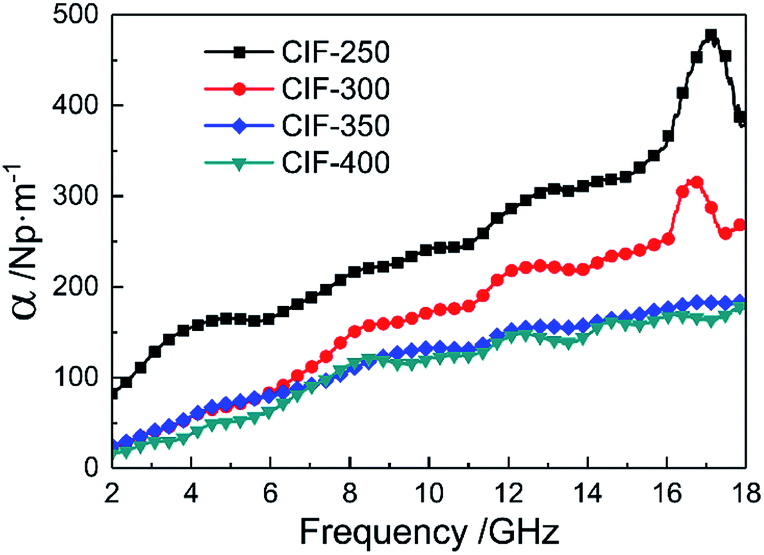
The microwave absorption performance of MAMs is also significantly dependent upon the inside microwave attenuation abilities, expressed as the attenuation constant (α). The α values of the CIFs synthesized at various pyrolysis temperatures were evaluated as follows:32
| |
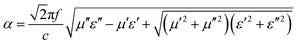 | (6) |
As demonstrated in Fig. 12, the α of all the samples are gradually increased with the increasing of frequency. The values of α decrease with the increasing of pyrolysis temperatures. When the pyrolysis temperatures elevated from 350 °C to 400 °C, the values of α decline slightly. CIF-250 and CIF-300 show larger α than the other two samples, particularly in the high-frequency range, indicating superior attenuation ability for the incident EM waves. Based on these outcomes, CIF-300 shows a balanced impedance matching and enhanced attenuation constants, thus demonstrating excellent microwave absorption performance.
 |
| | Fig. 12 Attenuation constant of CIFs synthesized at various pyrolysis temperatures. | |
4. Conclusions
In summary, the present study synthesized 1D structured CIFs via a carrier gas (Ar) induced flow process. We characterized the phase structure, morphology, static magnetic, and microwave absorption performance of the CIFs. The obtained CIFs with diameters of 100 nm to 300 nm and length–diameter ratios of more than 20 aggregated a large number of nanocrystalline grains. CIF-300 exhibited excellent microwave absorption properties with a filing content of 45 wt%, which presented an optimal reflection loss of −58.1 dB at 13.8 GHz with an absorber thickness of 1.43 mm. Moreover, CIF-300 presented a broad effective absorption bandwidth (RL ≤ −10 dB) of 5.66 GHz (thickness of 1.44 mm) and can be used for practical applications between 3.74 GHz to 18.0 GHz by tuning its thickness within 1.0 mm to 4.0 mm. The results promote the CIFs synthesized at 300 °C for potential MAMs applications with thin thicknesses, wide absorption bandwidths, and strong absorption intensities.
Conflicts of interest
There are no conflicts to declare.
Acknowledgements
This work was supported by the National Natural Science Foundation of China (No. 51905542), Young talents' trust program of Shaanxi Association for Science and Technology of China (No. 20190411), Youth Fund of Rocket Force University of Engineering (No. 2019QNJJ08) and China Postdoctoral Science Foundation (No. 47778). We thank LetPub (www.letpub.com) for its linguistic assistance during the preparation of this manuscript.
References
- B. Quan, X. Liang, G. Ji, Y. Cheng, W. Liu, J. Ma, Y. Zhang, D. Li and G. Xu, J. Alloys Compd., 2017, 728, 1065–1075 CrossRef CAS.
- L. B. Kong, Z. W. Li, L. Liu, R. Huang, M. Abshinova, Z. H. Yang, C. B. Tang, P. K. Tan, C. R. Deng and S. Matitsine, Int. Mater. Rev., 2013, 58, 203–259 CrossRef CAS.
- X. Liang, W. Liu, Y. Cheng, J. Lv, S. Dai, D. Tang, B. Zhang and G. Ji, J. Alloys Compd., 2018, 749, 887–899 CrossRef CAS.
- Z. Qi, L. Chunbo, W. Zhuang, Y. Yang, X. Zhiyong, Z. Haikun and C. Chudong, J. Magn. Magn. Mater., 2019, 479, 337–343 CrossRef CAS.
- C. Ge, L. Wang, G. Liu and H. Chen, J. Magn. Magn. Mater., 2019, 485, 228–235 CrossRef CAS.
- K. Park, J. Han, S. Lee, J. Kim, J. Yi and S. Lee, Compos. Sci. Technol., 2009, 69, 1271–1278 CrossRef CAS.
- L. Long, E. Yang, X. Qi, R. Xie, Z. Bai, S. Qin, C. Deng and W. Zhong, ACS Sustainable Chem. Eng., 2020, 8, 613–623 CrossRef CAS.
- C. Ge, L. Wang, G. Liu and T. Wang, J. Alloys Compd., 2018, 767, 173–180 CrossRef CAS.
- L. Liu, Y. Duan, S. Liu, L. Chen and J. Guo, J. Magn. Magn. Mater., 2010, 322, 1736–1740 CrossRef CAS.
- Y. Duan, G. Wu, S. Gu, S. Li and G. Ma, Appl. Surf. Sci., 2012, 258, 5746–5752 CrossRef CAS.
- O. Khani, M. Z. Shoushtari, K. Ackland and P. Stamenov, J. Magn. Magn. Mater., 2017, 428, 28–35 CrossRef CAS.
- C. Ge, L. Wang, G. Liu, T. Wang and H. Chen, J. Mater. Sci.: Mater. Electron., 2019, 30, 8390–8398 CrossRef CAS.
- Y. Xu, L. Yuan, X. Wang and D. Zhang, J. Alloys Compd., 2016, 676, 251–259 CrossRef CAS.
- W. Wang, J. Guo, C. Long, W. Li and J. Guan, J. Alloys Compd., 2015, 637, 106–111 CrossRef CAS.
- L. Qiao, R. Han, T. Wang, L. Tang and F. Li, J. Magn. Magn. Mater., 2015, 375, 100–105 CrossRef CAS.
- Y. Qing, W. Zhou, F. Luo and D. Zhu, J. Magn. Magn. Mater., 2009, 321, 25–28 CrossRef CAS.
- C. Yin, Y. Cao, J. Fan, L. Bai, F. Ding and F. Yuan, Appl. Surf. Sci., 2013, 270, 432–438 CrossRef CAS.
- A. Wang, W. Wang, C. Long, W. Li, J. Guan, H. Gu and G. Xu, J. Mater. Chem. C, 2014, 2, 3769–3776 RSC.
- H. Nan, Y. Qing, H. Gao, H. Jia, F. Luo and W. Zhou, Compos. Sci. Technol., 2019, 184, 107882 CrossRef CAS.
- Y. Yao, M. Zhu, C. Zhang, Y. Fan and J. Zhan, Adv. Powder Technol., 2018, 29, 1099–1105 CrossRef CAS.
- Y. Qing, H. Nan, H. Jia, D. Min, W. Zhou and F. Luo, J. Mater. Sci., 2019, 54, 4671–4679 CrossRef CAS.
- S. Cho, J. R. Choi, B. M. Jung, U. H. Choi, S. Lee, K. H. Kim and S. Lee, AIP Adv., 2016, 6, 55920 CrossRef.
- X. Shen, F. Song, X. Yang, Z. Wang, M. Jing and Y. Wang, J. Alloys Compd., 2015, 621, 146–153 CrossRef CAS.
- N. A. M. Barakat, K. A. Khalil, I. H. Mahmoud, M. A. Kanjwal, F. A. Sheikh and H. Y. Kim, J. Phys. Chem. C, 2010, 114, 15589–15593 CrossRef CAS.
- Y. Nie, H. He, Z. Zhao, R. Gong and H. Yu, J. Magn. Magn. Mater., 2006, 306, 125–129 CrossRef CAS.
- X. Li, R. Gong, Y. Nie, Z. Zhao and H. He, Mater. Chem. Phys., 2005, 94, 408–411 CrossRef CAS.
- M. Yu, X. Li, R. Gong, Y. He, H. He and P. Lu, J. Alloys Compd., 2008, 456, 452–455 CrossRef CAS.
- M. F. Hassan, M. M. Rahman, Z. P. Guo, Z. X. Chen and H. K. Liu, Electrochim. Acta, 2010, 55, 5006–5013 CrossRef CAS.
- X. Gong, J. You, J. Wang and L. Lu, Spectrosc. Spect. Anal., 2018, 38, 241–242 Search PubMed.
- R. Qiang, Y. Du, D. Chen, W. Ma, Y. Wang, P. Xu, J. Ma, H. Zhao and X. Han, J. Alloys Compd., 2016, 681, 384–393 CrossRef CAS.
- G. Li, The contemporary magnetics, Hefei, University of Science and Technology of China Press, 1st edn., 1991 Search PubMed.
- P. Liu, Z. Yao, J. Zhou, Z. Yang and L. B. Kong, J. Mater. Chem. C, 2016, 4, 9738–9749 RSC.
- Q. Liao, M. He, Y. Zhou, S. Nie, Y. Wang, S. Hu, H. Yang, H. Li and Y. Tong, ACS Appl. Mater. Interfaces, 2018, 10, 29136–29144 CrossRef CAS PubMed.
- H. Lv, G. Ji, W. Liu, H. Zhang and Y. Du, J. Mater. Chem. C, 2015, 3, 10232–10241 RSC.
- L. Long, E. Yang, X. Qi, R. Xie, Z. Bai, S. Qin and W. Zhong, J. Mater. Chem. C, 2019, 7, 8975–8981 RSC.
- Z. Guo, H. Huang, D. Xie and H. Xia, Sci. Rep., 2017, 7, 11331 CrossRef PubMed.
- J. Liu, M. Itoh, M. Terada, T. Horikawa and K. Machida, Appl. Phys. Lett., 2007, 91, 93101 CrossRef.
- N. Wu, X. Liu, C. Zhao, C. Cui and A. Xia, J. Alloys Compd., 2016, 656, 628–634 CrossRef CAS.
- D. Ding, Y. Wang, X. Li, R. Qiang, P. Xu, W. Chu, X. Han and Y. Du, Carbon, 2017, 111, 722–732 CrossRef CAS.
|
| This journal is © The Royal Society of Chemistry 2020 |
Click here to see how this site uses Cookies. View our privacy policy here. 
 Open Access Article
 This Open Access Article is licensed under a Creative Commons Attribution-Non Commercial 3.0 Unported Licence
 *a,
Gu Liu*a,
Kejun Xua,
Long Wanga,
Lei Zhangb and
Xuan Hea
*a,
Gu Liu*a,
Kejun Xua,
Long Wanga,
Lei Zhangb and
Xuan Hea


 4 where tm defines the matching thickness of RL.