 Open Access Article
Propyl acetate/butyronitrile mixture is ideally suited for investigating the effect of dielectric stabilization on (photo)chemical reactions†
Pragya Verma ,
Arnulf Rosspeintner
 and
Tatu Kumpulainen
 *
*
Department of Physical Chemistry, University of Geneva, 30 Quai Ernest Ansermet, Geneva, Switzerland. E-mail: tatu.kumpulainen@unige.ch; Fax: +41 22 379 6518; Tel: +41 22 379 6530
First published on 22nd June 2020
Abstract
Characterization of propyl acetate/butyronitrile (PA/BuCN) mixtures by various spectroscopic techniques is described. The neat solvents have identical viscosities and refractive indices but their dielectric constants differ significantly. Detailed solvatochromic and titration data show that the mixtures do not exhibit specific solute–solvent interactions or significant dielectric enrichment effects. Therefore, the mixtures are ideally suited for investigating the effect of dielectric stabilization on (photo)chemical reactions. Dynamic Stokes shift experiments performed on two push–pull probes demonstrate that the solvation dynamics are significantly decelerated in the mixtures as compared to the neat solvents. Therefore, the mixtures allow for varying both the extent and time scale of the dielectric stabilization in a predictable manner.
Introduction
Variation in chemical reactivity in solutions is often correlated with empirical solvent scales or macroscopic solvent parameters derived from a continuous description of the liquid.1,2 In addition to “static” or equilibrium solvent effects, solvation dynamics play an important role in many ultrafast photochemical reactions in solutions.3–9 Understanding the effect of the macroscopic solvent parameters on chemical reactions is of great fundamental importance but it is challenging to investigate one single parameter at a time. The main problem arises from the fact that most solvents do not have a single property that is different from the properties of other solvents. For example, while studying the effect of increasing dielectric constants, other properties like viscosity and refractive index might also change thus influencing the reaction under study. One solution to overcome this problem is to use solvent mixtures. This approach has been successfully utilized for investigating both chemical and photochemical reactions.10–20Solvent mixtures of varying dielectric constant enable systematic studies on the influence of solvent stabilization on photochemical reactions.18–21 Ideally, other solvent parameters such as viscosity and refractive index should remain constant. In addition, the mixtures should not exhibit any specific hydrogen-bonding (HB) interactions or dielectric enrichment effects that might influence the reactivity. Specific solvent interactions can disrupt hydrogen bonds between the reaction partners or alter the solvent stabilization in a non-systematic way.22–26 On the other hand, solvents with a large difference in the dielectric constants (εr) are particularly prone to dielectric enrichment effects.27–29
A binary mixture between propyl acetate (PA) and butyronitrile (BuCN) is a promising candidate for investigating the effect of dielectric stabilization. The dielectric constant increases from 6.0 to 24.8 upon going from PA to BuCN and varies linearly with the weight fractions of the solvents according to:
| εr = wPA·εr(PA) + (1 − wPA)·εr(BuCN), | (1) |
| Solvent | η (cP) | εr | n | α | β | π* | μ (D) |
|---|---|---|---|---|---|---|---|
| a α, β, and π* are the Kamlet–Taft parameters related to HB donating, HB accepting ability, and dipolarity/polarizability respectively and μ is the dipole moment of the solvent. All parameters were taken from ref. 45. | |||||||
| PA | 0.551 | 6.0 | 1.382 | 0.00 | 0.40 | 0.53 | 1.78 |
| BuCN | 0.549 | 24.8 | 1.382 | 0.00 | 0.45 | 0.63 | 4.07 |
The article is structured as follow: first, we describe the steady-state solvatochromic behavior of betaine-30 (ref. 23) (B30), coumarin 153 (C153), and coumarin 152A (C152A) (Chart 1). The extremely large ground-state dipole moment of ca. 15 D (ref. 31) and the presence of the negatively charged phenolate oxygen render B30 absorption band frequency very sensitive towards both HB donors and dielectric enrichment effects.32,33 On the other hand, B30 is nearly non-fluorescent.34–36 Therefore, the two coumarins were used and their solvatochromism was investigated by using both steady-state absorption and emission. Additionally, we present a detailed investigation on the solvent relaxation parameters utilizing the time-dependent Stokes shift method37 on broadband fluorescence spectra with a sub-100 fs time-resolution.38,39 Time constants for the solvent relaxation were determined for both C153 and C152A in the mixtures. In the third part, we present a detailed investigation on the microscopic viscosity by investigating both the rotational and translational diffusion of C153 in the mixtures. Both of these coefficients depend on the viscosity and hence should remain constant in isoviscous mixtures in the absence of specific solute–solvent interactions.40–42
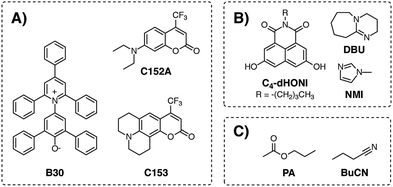 | ||
| Chart 1 Chemical structures of (A) solvatochromic probes, (B) photoacid and organic base, and (C) solvents used in the study. Same abbreviations are used throughout the text. | ||
Since our main goal is to use the mixtures for proton transfer reactions, we demonstrate in the last part that the mixture does not disrupt the HB interactions between the reaction partners and that the dielectric constant has a significant impact on the driving force of the proton-transfer reaction. For this purpose, we use a 1,8-naphthalimide-based photoacid (Chart 1) complexed with either a weak base (N-methylimidazole, NMI) or deprotonated by a strong base (1,8-diazabicyclo[5.4.0]undec-7-ene, DBU).43,44
Experimental section
Materials
The dyes, BBOT and C153 (Radiant Dyes), DCM, C152A and coumarin 6H (Exciton) and B30 (Sigma Aldrich) were of highest available grade and used without further purification. The solvents, n-butyronitrile (99%, Acros Organics, distilled at 154 °C) and propyl acetate (99%, Alfa Aesar) were stored over 3 Å molecular sieves under argon atmosphere to avoid moisture. Synthesis of the 1,8-naphthalimide-based photoacid, C4-dHONI, has been described elsewhere.43 The bases, DBU (99%, Alfa Aesar) and NMI (99%, Sigma Aldrich), were used as received.Experimental methods
Steady-state absorption spectra were recorded using a Varian Cary 50 UV-vis spectrometer and emission spectra using a Horiba Scientific FluoroMax-4 (Jobin Yvon) fluorimeter corrected for the spectral sensitivity using a set of secondary emissive standards.46 The fluorescence anisotropies were measured using a fs single wavelength fluorescence up-conversion setup that has been described in previous publications.47,48 The NMR spectra were recorded on a Bruker Avance III HD-NanoBay 300 MHz spectrometer at a temperature of 298 K. Time-resolved broadband fluorescence spectra were recorded using a setup similarly to those described in ref. 49 and 50. The full width at half-maximum (FWHM) of the cross correlation of the gate with solvent Raman signal was approximately 90 fs. The raw spectra were corrected for the spectral sensitivity with the use of a set of secondary emissive standards46 and subsequently transferred into the transition dipole moment representation.51 The chirp due to group velocity dispersion was determined by measuring the instantaneous response of BBOT in the same solvent. All measurements were performed at room temperature (21 ± 1 °C). A sample cell with a 1 cm optical path length was used for steady-state measurements and with a 1 mm path length for the time-resolved measurements.Data analysis
The transition energies of all probes were determined by fitting the bands with a log-normal function according to:52,53
 | (2) |
 | (3) |
![[small nu, Greek, tilde]](https://www.rsc.org/images/entities/i_char_e0e1.gif) 0 the peak frequency, b the asymmetry parameter and Δx the width parameter. Due to extensive literature data on ET(30) scales,23,45,54 the transition energies of B30 were determined from the absorption spectra in wavenumber and the corresponding ET(30) values of the mixtures were calculated according to:
0 the peak frequency, b the asymmetry parameter and Δx the width parameter. Due to extensive literature data on ET(30) scales,23,45,54 the transition energies of B30 were determined from the absorption spectra in wavenumber and the corresponding ET(30) values of the mixtures were calculated according to:
ET(30) [kcal mol−1] = hc![[small nu, Greek, tilde]](https://www.rsc.org/images/entities/i_char_e0e1.gif) 0NA = 2.8591· 0NA = 2.8591·![[small nu, Greek, tilde]](https://www.rsc.org/images/entities/i_char_e0e1.gif) 0 [cm−1], 0 [cm−1],
| (4) |
![[small nu, Greek, tilde]](https://www.rsc.org/images/entities/i_char_e0e1.gif) 0 is the peak frequency of the lowest-energy transition determined by fitting with the log-normal function.
0 is the peak frequency of the lowest-energy transition determined by fitting with the log-normal function.
The transition energies of the coumarins were determined from the peak frequencies of the log-normal fits in transition dipole moment (TDM) representation since this corresponds to the true lineshape of the underlying transitions.51 This is supported by the bandwidths of the absorption and emission spectra, presented in Fig. S7 (ESI†). The absorption and emission bandwidths are nearly identical in the TDM representation whereas they differ by more than 500 cm−1 in the wavenumber representation.
All transition energies and Stokes shifts are represented as a function of the reaction field factor, Δf, defined as:
 | (5) |
The factor, derived from Onsager's reaction-field theory, accounts for the dielectric stabilization of a non-polarizable point dipole in a spherical cavity due orientational dipole–dipole interactions.55 Since the refractive index of the mixtures is constant, the transition energies are expected to show linear behavior with respect to Δf with slopes proportional to a combination of the ground- and excited-state permanent dipole moments.56,57 Any deviations from linearity would indicate the presence of specific solute–solvent interactions or dielectric enrichment effects. For consistency, all solvent parameters are plotted against Δf and the weight fractions of PA were chosen to be equally spaced in Δf. Relation between Δf and the weight fraction (Fig. S4, ESI†) is nonlinear.
Rotational diffusion times of C153 were determined from the fluorescence anisotropy decays. These decays were calculated from intensities measured at a parallel (I∥) and perpendicular (I⊥) pump polarization with respect to the detected signal according to:
 | (6) |
The rotational times were obtained by fitting the anisotropy decays with a bi-exponential function. The goodness of fit was judged based on the weighted residual and the χr2 value. Translational diffusion coefficients of C153 were determined from the 19F-DOSY NMR experiments (see ESI† for details).
Solvation dynamics were determined from the fs-broadband fluorescence spectra using the time-dependent Stokes shift method.37 The spectra were analyzed globally using the approach discussed in detail in ref. 58. In brief, the fluorescence band is fitted with a time-dependent log-normal function where the dynamic Stokes shift is expected to follow a multi-exponential function.
Results and discussion
Steady-state solvatochromism
The absorption spectra of B30 in the PA/BuCN mixtures are presented in Fig. 1A. The absorption band undergoes a blue shift of ca. 2000 cm−1 upon changing the solvent from neat PA (Δf = 0.39) to neat BuCN (Δf = 0.56), which can be attributed to the well-known strong negative solvatochromism of B30.23 The peak frequencies were converted to ET(30) values according to eqn (4) and are plotted as a function of Δf in Fig. 1B.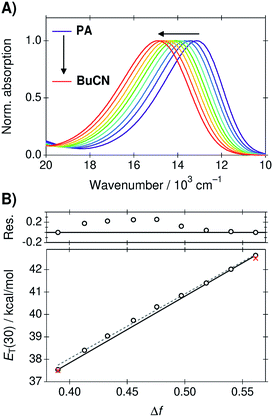 | ||
| Fig. 1 (A) Absorption spectra of B30 in the PA/BuCN solvent mixtures. (B) Corresponding ET(30) values as a function of Δf. The black line represents ideal behavior connecting the two extreme points corresponding to the neat solvents and deviation of the experimental values is shown in the top panel in kcal mol−1. The dashed gray line represents a linear regression line to all points. Red crosses indicate the ET(30) values of the neat solvents taken from ref. 45. | ||
The ET(30) values show a good linear correlation as a function Δf (R2 = 0.997) represented by the dashed gray line in Fig. 1B. Minor deviations are, however, visible at large weight fractions of PA (Δf < 0.5). In the ideal case, the ET(30) values would vary linearly between the extreme points corresponding to the neat solvents represented by the black solid line in Fig. 1B. The solvation energy increases more rapidly in PA rich mixtures but returns to ideal behavior at around Δf = 0.52 corresponding to a nearly 50/50 mixture (wPA = 0.56). Deviation of the experimental values from the ideal behavior is presented in the top panel of Fig. 1B. It should be noted, that B30 is particularly susceptible to both dielectric enrichment as well HB donor interactions. We observed significant deviations from linearity before purification of the solvents. Therefore, the purity of the solvents was confirmed by comparing the measured ET(30) values of the neat solvent to the literature values (red crosses in Fig. 1B) prior any further measurements. After purification the agreement between the measured and literature values was around 0.1 kcal mol−1. Therefore, the observed deviation from linearity is unlikely due to any impurities but can be attributed to the dielectric enrichment. However, the maximum deviation of 0.25 kcal mol−1 at Δf = 0.48 represents only 5% of the total variation and overall linear correlation between the solvation energy and Δf is excellent.
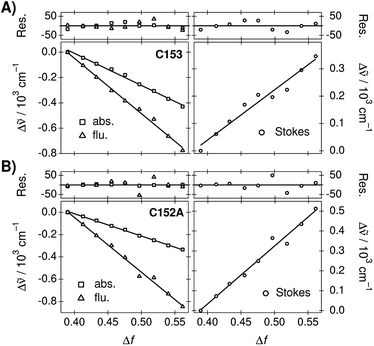
The peak frequencies of the absorption and emission spectra of C153 and C152A were determined in the TDM representation and the Stokes shifts were calculated as a difference between the absorption and emission frequencies. Experimental spectra and spectral parameters are given in ESI.† The peak frequencies and Stokes shifts as a difference to the values determined in neat PA are plotted as a function of Δf in Fig. 2. The negative slopes of the peak frequencies indicate red shifts of the bands whereas the positive slopes of the Stokes shifts indicate an increase.
For both coumarins, the linear correlation between the transition energies and Δf is reasonably good. C153 shows slight scattering of the points, which are overemphasized in the Stokes shifts. Deviations from the linear regression lines are shown in the top panels. However, this largely originates from uncertainties in the fitted peak maxima due to the log-normal function and the deviations do not show any clear patterns. For C153 in particular, the log-normal function is a sub-optimal band shape function in solvents of medium polarity. For C152A, the log-normal function reproduces the spectra better and the spectral shifts are larger resulting in an excellent linear correlation. Therefore, the observed solvatochromism of both compounds can be attributed to non-specific dielectric stabilization.
In summary, dielectric stabilization in the mixtures follows nearly ideal behavior for all compounds investigated. Although slight dielectric enrichment was observed for B30, the linear correlation between the solvation energies and Δf is remarkably good. Therefore, the mixture is ideally suited for controlling the extent of the dielectric stabilization.
Solvation dynamics
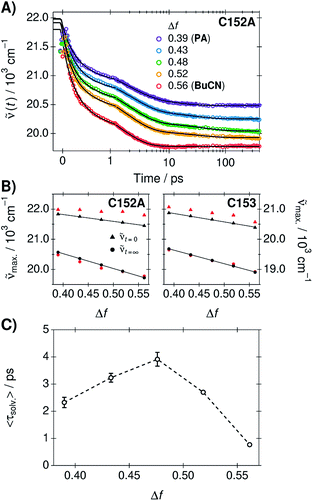
Solvation dynamics were determined from the time-resolved fluorescence spectra of C153 and C152A in the neat solvents and three mixtures using the time-dependent Stokes shift method.37 The spectra were analyzed globally in order to extract the time constants for the dynamic Stokes shifts.37,58 A three-exponential function was required to model the fluorescence peak frequencies in PA and in the mixtures whereas two-exponential function was adequate in BuCN. Experimental spectra, global fits, and weighted residuals are given in ESI.† Time-dependent fluorescence band positions and exponential fits of C152A are presented in Fig. 3A. The amplitudes and lifetimes as an average from the two coumarins are summarized in Table 2. All the individual best-fit parameters are given in ESI.†| Δf | α1 | τ1/ps | α2 | τ2/ps | α3 | τ3/ps | 〈τsolv.〉/ps |
|---|---|---|---|---|---|---|---|
| a Average solvation time was calculated according to 〈τsolv.〉 = Σαiτi. | |||||||
| 0.39 | 0.54 | 0.25 | 0.37 | 2.1 | 0.09 | 15.8 | 2.3 ± 0.2 |
| 0.43 | 0.54 | 0.24 | 0.37 | 2.3 | 0.09 | 25.2 | 3.2 ± 0.2 |
| 0.48 | 0.53 | 0.25 | 0.39 | 2.1 | 0.08 | 36.1 | 3.9 ± 0.3 |
| 0.52 | 0.55 | 0.24 | 0.38 | 2.0 | 0.07 | 27.4 | 2.7 ± 0.1 |
| 0.56 | 0.61 | 0.26 | 0.39 | 1.6 | — | — | 0.8 ± 0.1 |
Similarly to the steady-state spectra, magnitudes of the time-dependent Stokes shifts increase upon increasing Δf, C152A showing slightly larger shifts compared to C153. The relaxed fluorescence band maxima resulting from the global fit decrease linearly with Δf and are within 100 cm−1 from the peak maxima of the steady-state spectra. However, the band maxima of the initial time-zero spectra (![[small nu, Greek, tilde]](https://www.rsc.org/images/entities/i_char_e0e1.gif) t=0) as well as the total shifts (Δ
t=0) as well as the total shifts (Δ![[small nu, Greek, tilde]](https://www.rsc.org/images/entities/i_char_e0e1.gif) tot) are significantly overestimated in the global fits for both compounds. This is largely due to the non-exponential behavior of the spectral shifts at t < 150 fs that is sometimes modeled as a Gaussian decay.26,59,60 In this region, the exponential fit significantly deviates from the experimental band maxima as can be seen in Fig. 3A. Therefore, the total shifts were additionally calculated using the time-zero spectra estimated from the steady-state spectra in non-polar solvent according to a previously published procedure (see ESI† for details and representative spectra).58,61
tot) are significantly overestimated in the global fits for both compounds. This is largely due to the non-exponential behavior of the spectral shifts at t < 150 fs that is sometimes modeled as a Gaussian decay.26,59,60 In this region, the exponential fit significantly deviates from the experimental band maxima as can be seen in Fig. 3A. Therefore, the total shifts were additionally calculated using the time-zero spectra estimated from the steady-state spectra in non-polar solvent according to a previously published procedure (see ESI† for details and representative spectra).58,61
The peak frequencies of the time-zero and relaxed fluorescence estimated from the steady-state spectra (black markers) and those resulting from the global fit (red markers) are presented in Fig. 3B. The total shifts, reflecting the solvation free energy,62 increase linearly with Δf in the estimated spectra whereas the shifts resulting from the global fit are overestimated by ca. 200–300 cm−1. However, the experimental band positions (markers in Fig. 3A) at t = 0 agree within 100 cm−1 with the estimated time-zero spectra. This further supports that the dielectric stabilization follows ideal behavior and is not complicated by specific solute–solvent interactions or dielectric enrichment effects.62
Despite the different magnitude of the total shifts, the time constants and relative amplitudes of the two coumarins are very similar. This demonstrates that the solvation dynamics are independent of the coumarin, in agreement with previous results.58 Therefore, the characteristic solvent relaxation parameters, presented in Table 2, are given as an average of the individual parameters obtained for C153 and C152A. The mean solvation times correspond to amplitude-weighted average lifetimes and are presented in Fig. 3C as a function of Δf.
Surprisingly, the solvation dynamics are significantly decelerated in the mixtures. Due to this unexpected behavior, the experiments were performed in duplicate reproducing the same behavior. The solvent relaxation becomes gradually slower upon increasing the amount of BuCN reaching a maximum at Δf = 0.48 corresponding to wPA = 0.79. The first two lifetimes do not show significant differences, but the third time constant increases significantly in the mixtures. After this point, the solvation dynamics become faster upon increasing fraction of BuCN. In neat BuCN, the solvation dynamics are the fastest and slowest decay component (τ3) disappears. The physical origin of this effect remains unclear and is beyond the scope of the present study. However, similar deceleration has been observed in other binary mixtures where it has been attributed to deceleration of the intrinsic solvent reorientation dynamics or translational components.18,63,64 The rather long time scale of the deceleration observed in PA/BuCN mixtures points towards translational components that likely involve a significant reorientation of the first solvation shell.
Rotational and translational diffusion coefficients
The experimentally measured kinematic viscosity of the mixtures remains constant (Fig. S3, ESI†). However, we wanted to investigate whether molecular effects might influence the diffusion of solutes in the mixtures. Both the rotational and translational diffusion of solutes are related to the macroscopic viscosity of the solvent. Hence, the coefficients are expected to remain constant in solutions of constant viscosity for a specific solute. Deviations from hydrodynamic theories are often used as indicators for specific solute–solvent interactions that increase the friction.42The rotational diffusion coefficient is proportional to the inverse of the rotational correlation time (τrot.). For a spherical molecule, τrot. is directly proportional to the viscosity of solvent according to the Stokes–Einstein–Debye equation:41,42
 | (7) |
 | (8) |
The rotational correlation times of C153 were determined from the fluorescence anisotropy decays in the PA/BuCN mixtures.42 Representative fluorescence decays measured in parallel and perpendicular polarizations together with the constructed anisotropy decay are shown in Fig. S12 (ESI†). The anisotropy decays were analyzed with a bi-exponential function and the best-fit parameters are summarized in Table S9 (ESI†). The bi-exponential decay originates from the non-spherical shape of C153 (ref. 65) but both individual decay times are expected to show linear correlation with viscosity, as has been observed in other binary mixtures.16 The mean rotational correlation times, 〈τrot.〉, were calculated as an amplitude-weighted average lifetime and are presented as a function of Δf in Fig. 4A. The translational diffusion coefficients of C153 were determined from the 19F-DOSY experiments in the PA/BuCN mixtures. Experimental details and representative data are given in ESI.† The diffusion coefficients are presented as a function of Δf in Fig. 4B.
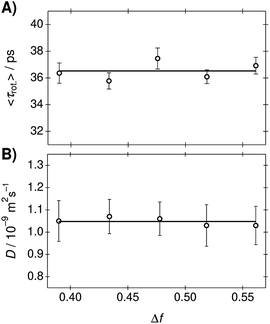 | ||
| Fig. 4 (A) Rotational correlation times and (B) translational diffusion coefficients of C153 in the PA/BuCN mixtures as a function of Δf. The lines indicate the mean values in the mixtures. | ||
Both the rotational correlation times and translational diffusion coefficients are nearly constant in the mixtures. This unambiguously demonstrates that the viscosity of the mixtures remains constant. The invariant rotational correlation times are additionally a further indication for the absence of strong solute–solvent interactions. Both specific interactions and dielectric enrichment has been shown to influence the rotational correlation times.42,66 Our results show that the mixture behaves ideally and does not show any deviations from hydrodynamic theories.
Ground-state association and deprotonation constants
As mentioned in the introduction, our main aim is to use the PA/BuCN mixtures in further studies on bimolecular excited-state proton transfer from a photoacid to organic bases. Therefore, it is crucial that the mixture does not disrupt the HB equilibrium between the reaction partners. To demonstrate this, we determined the association constants between C4-dHONI photoacid and a weak base (NMI) from a titration experiment. NMI forms hydrogen bonds to the hydroxyl groups but is not strong enough to deprotonate the photoacid in the ground state. On the other hand, a strong base (DBU) will deprotonate one of the hydroxyl groups already in the ground state.44 Therefore, the impact of dielectric stabilization on the deprotonation constant can be demonstrated in the presence of a strong base.Since C4-dHONI has two binding sites, a model based on 1![[thin space (1/6-em)]](https://www.rsc.org/images/entities/char_2009.gif) :
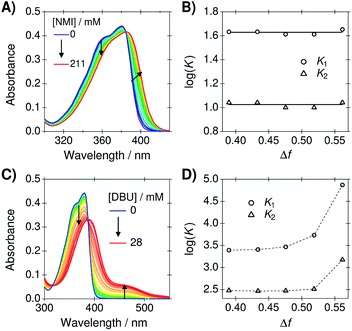
:![[thin space (1/6-em)]](https://www.rsc.org/images/entities/char_2009.gif) 2 host–guest stoichiometry was used. The association constants, K1 and K2, were obtained from the steady-state absorption spectra using a previously described global analysis procedure (see ESI† for details).44 Representative absorption spectra of C4-dHONI upon addition of NMI and DBU in a PA/BuCN mixture with Δf = 0.48 are presented in Fig. 5A and C and the association or deprotonation constants as a function of Δf in all the mixtures in Fig. 5B and D.
2 host–guest stoichiometry was used. The association constants, K1 and K2, were obtained from the steady-state absorption spectra using a previously described global analysis procedure (see ESI† for details).44 Representative absorption spectra of C4-dHONI upon addition of NMI and DBU in a PA/BuCN mixture with Δf = 0.48 are presented in Fig. 5A and C and the association or deprotonation constants as a function of Δf in all the mixtures in Fig. 5B and D.
The absorption spectra of C4-dHONI shows a broadening and a red shift upon addition of NMI. We have previously shown that NMI forms neutral hydrogen-bonded 1:1 and 1:2 complexes with C4-dHONI.44 The association constants, K1 and K2, determined from the global analysis remain constant in the mixtures. This clearly demonstrates that the solvent mixtures do not influence the HB equilibrium between the reaction partners. Therefore, the mixtures could be additionally used to investigate the effect of dielectric constant on different HB association reactions.
The absorption spectra upon addition of DBU show a significant decrease of the neutral band around 380 nm and an appearance of a long-wavelength band at 450 nm. This has been attributed to a deprotonation of a single hydroxyl group by the strong base followed by HB association of another base molecule on the remaining hydroxyl group of C4-dHONI. This is due to the fact that deprotonation of the first hydroxyl group significantly increases the pKa of the second. The deprotonation constants, K1, increase drastically upon increasing Δf, being 30 times higher in BuCN compared to PA. This shows that the reaction free energy for proton transfer reactions significantly decreases (more negative ΔG) upon increasing Δf. On the other hand, the association constant for the binding of a second DBU, K2, remains nearly constant in neat PA and the mixtures but increases by a factor of four neat BuCN. This further demonstrates that the mixtures do not significantly influence HB equilibrium. The increase in BuCN might originate from incomplete description of the experimental spectra by the association model because different ion pair species (contact and non-contact) can further complicate the spectral behavior in polar solvents.44 In any case, the impact of the dielectric stabilization on the ground-state deprotonation constant is very clear. The next step is to investigate the impact on photoinduced excited-state proton-transfer reactions and work in this direction is under way in our laboratory.
Conclusions
We have used a variety of spectroscopic techniques to characterize several properties of propyl acetate/butyronitrile binary mixtures. Refractive index and viscosity of the mixtures is constant whereas the dielectric constant varies linearly with the weight fractions of the solvents. Detailed solvatochromic studies on three push–pull probes demonstrate that the dielectric stabilization is mostly accounted by the bulk dielectric properties and is not complicated by specific solute–solvent interactions or dielectric enrichment effects. Furthermore, the mixtures do not disrupt hydrogen-bonding equilibrium between the reaction partners. Therefore, the mixtures are ideally suited for investigating the effect of dielectric stabilization on chemical or photochemical reactions. Interestingly, the solvation dynamics are significantly slower in the mixtures as compared to the neat solvents. This additionally enables controlling the time scale of the dielectric stabilization in a predictable manner. Hence the mixtures can be used to investigate both static and dynamic solvent effects on chemical reactivity in a wide variety of systems.Conflicts of interest
There are no conflicts to declare.Acknowledgements
We acknowledge Prof. Eric Vauthey (UniGE) and Prof. Günther Grampp (TU Graz) for the use of their laboratory equipment. Robin Nussbaum is acknowledged for performing some of the solvatochromic studies, Dr Bert Bakker (UvA) for the synthesis of the photoacid and Marion Pupier (UniGE) for the NMR measurements. This research was financially supported by the University of Geneva and The Swiss National Science Foundation through grant no. PZ00P2_174116.Notes and references
- Solvent Effects and Chemical Reactivity, ed. O. Tapia and J. Bertrán, Kluwer Academic Publishers, Dordrecht, 2002 Search PubMed.
- C. Reichardt, Solvents and Solvent Effects in Organic Chemistry, Wiley-VCH Verlag GmbH & Co., Weinheim, 3rd edn, 2003 Search PubMed.
- B. Bagchi, Annu. Rev. Phys. Chem., 1989, 40, 115–141 CrossRef CAS.
- M. J. Weaver and G. E. McManis, Acc. Chem. Res., 1990, 23, 294–300 CrossRef CAS.
- P. F. Barbara, G. C. Walker and T. P. Smith, Science, 1992, 256, 975–981 CrossRef CAS PubMed.
- H. Heitele, Angew. Chem., Int. Ed., 1993, 32, 359–377 CrossRef.
- P. M. Kiefer and J. T. Hynes, J. Phys. Chem. A, 2002, 106, 1834–1849 CrossRef CAS.
- T. Kumpulainen, B. Lang, A. Rosspeintner and E. Vauthey, Chem. Rev., 2017, 117, 10826–10939 CrossRef CAS PubMed.
- T. Kumpulainen, A. Rosspeintner, B. Dereka and E. Vauthey, J. Phys. Chem. Lett., 2017, 8, 4516–4521 CrossRef CAS PubMed.
- E. Tommila, Acta Chem. Scand., 1959, 13, 1019–1030 CrossRef.
- E. Niki, Y. Kamiya and N. Ohta, Bull. Chem. Soc. Jpn., 1969, 42, 3224–3229 CrossRef CAS.
- H. Kwart and P. A. Silver, J. Org. Chem., 1975, 40, 3019–3026 CrossRef CAS.
- R. A. Ransdell and C. C. Wamser, J. Phys. Chem., 1992, 96, 10572–10575 CrossRef CAS.
- P. M. Mancini, G. Fortunato, C. Adam, L. R. Vottero and A. J. Terenzani, J. Phys. Org. Chem., 2002, 15, 258–269 CrossRef CAS.
- C. A. Rumble and M. Maroncelli, J. Chem. Phys., 2018, 148, 193801 CrossRef PubMed.
- G. Angulo, M. Brucka, M. Gerecke, G. Grampp, D. Jeannerat, J. Milkiewicz, Y. Mitrev, C. law Radzewicz, A. Rosspeintner, E. Vauthey and P. Wnuk, Phys. Chem. Chem. Phys., 2016, 18, 18460–18469 RSC.
- J. Gardecki and M. Maroncelli, Chem. Phys. Lett., 1999, 301, 571–578 CrossRef CAS.
- G. Angulo, J. Jedrak, A. Ochab-Marcinek, P. Pasitsuparoad, C. Radzewicz, P. Wnuk and A. Rosspeintner, J. Chem. Phys., 2017, 146, 244505 CrossRef PubMed.
- S. Richert, A. Rosspeintner, S. Landgraf, G. Grampp, E. Vauthey and D. R. Kattnig, J. Am. Chem. Soc., 2013, 135, 15144–15152 CrossRef CAS PubMed.
- H. M. Hoang, T. B. V. Pham, G. Grampp and D. R. Kattnig, J. Phys. Chem. Lett., 2014, 5, 3188–3194 CrossRef CAS PubMed.
- D. R. Kattnig, A. Rosspeintner and G. Grampp, Angew. Chem., Int. Ed., 2008, 47, 960–962 CrossRef CAS PubMed.
- D. McMorrow and M. Kasha, J. Phys. Chem., 1984, 88, 2235–2243 CrossRef CAS.
- C. Reichardt, Chem. Rev., 1994, 94, 2319–2358 CrossRef CAS.
- O. K. Abou-Zied, R. Jimenez, E. H. Z. Thompson, D. P. Millar and F. E. Romesberg, J. Phys. Chem. A, 2002, 106, 3665–3672 CrossRef CAS.
- P. Zhou, M. R. Hoffmann, K. Han and G. He, J. Phys. Chem. B, 2015, 119, 2125–2131 CrossRef CAS PubMed.
- J. L. Pérez-Lustres, F. Rodriguez-Prieto, M. Mosquera, T. A. Senyushkina, N. P. Ernsting and S. A. Kovalenko, J. Am. Chem. Soc., 2007, 129, 5408–5418 CrossRef PubMed.
- P. Suppan, J. Chem. Soc., Faraday Trans. 1, 1987, 83, 495–509 RSC.
- J. G. Dawber, J. Ward and R. A. Williams, J. Chem. Soc., Faraday Trans. 1, 1988, 84, 713–727 RSC.
- N. K. Petrov, High Energy Chem., 2006, 40, 22–34 CrossRef CAS.
- M. J. Kamlet, J. L. M. Abboud, M. H. Abraham and R. W. Taft, J. Org. Chem., 1983, 48, 2877–2887 CrossRef CAS.
- M. C. Beard, G. M. Turner and C. A. Schmuttenmaer, J. Phys. Chem. A, 2002, 106, 878–883 CrossRef CAS.
- C. Lerf and P. Suppan, J. Chem. Soc., Faraday Trans., 1992, 88, 963–969 RSC.
- M. Rosés, C. Ràfols, J. Ortega and E. Bosch, J. Chem. Soc., Perkin Trans. 2, 1995, 1607–1615 RSC.
- E. Åkesson, G. C. Walker and P. F. Barbara, J. Chem. Phys., 1998, 95, 4188–4194 CrossRef.
- N. E. Levinger, A. E. Johnson, G. C. Walker and P. F. Barbara, Chem. Phys. Lett., 1992, 196, 159–165 CrossRef CAS.
- V. Kharlanov and W. Rettig, J. Phys. Chem. A, 2009, 113, 10693–10703 CrossRef CAS PubMed.
- M. L. Horng, J. A. Gardecki, A. Papazyan and M. Maroncelli, J. Phys. Chem., 1995, 99, 17311–17337 CrossRef CAS.
- R. Schanz, S. Kovalenko, V. Kharlanov and N. Ernsting, Appl. Phys. Lett., 2001, 79, 566 CrossRef CAS.
- L. Zhao, J. L. P. Lustres, V. Farztdinov and N. P. Ernsting, Phys. Chem. Chem. Phys., 2005, 7, 1716–1725 RSC.
- J. T. Edward, J. Chem. Educ., 1970, 47, 261–270 CrossRef CAS.
- G. T. Evans and D. Kivelson, J. Chem. Phys., 1986, 84, 385 CrossRef CAS.
- M. L. Horng, J. A. Gardecki and M. Maroncelli, J. Phys. Chem. A, 1997, 101, 1030–1047 CrossRef CAS.
- T. Kumpulainen, B. H. Bakker, M. Hilbers and A. M. Brouwer, J. Phys. Chem. B, 2015, 119, 2515–2524 CrossRef CAS PubMed.
- T. Kumpulainen, B. H. Bakker and A. M. Brouwer, Phys. Chem. Chem. Phys., 2015, 17, 20715–20724 RSC.
- Y. Marcus, The Properties of Solvents, Wiley, Chichester, 1st edn, 1998 Search PubMed.
- J. A. Gardecki and M. Maroncelli, Appl. Spectrosc., 1998, 52, 1179–1189 CrossRef CAS.
- A. Morandeira, L. Engeli and E. Vauthey, J. Phys. Chem. A, 2002, 106, 4833–4837 CrossRef CAS.
- G. Duvanel, J. Grilj, H. Chaumeil, P. Jacques and E. Vauthey, Photochem. Photobiol. Sci., 2010, 9, 908–915 RSC.
- X.-X. Zhang, C. Würth, L. Zhao, U. Resch-Genger, N. P. Ernsting and M. Sajadi, Rev. Sci. Instrum., 2011, 82, 063108 CrossRef PubMed.
- M. Gerecke, G. Bierhance, M. Gutmann, N. P. Ernsting and A. Rosspeintner, Rev. Sci. Instrum., 2016, 87, 053115 CrossRef PubMed.
- G. Angulo, G. Grampp and A. Rosspeintner, Spectrochim. Acta, Part A, 2006, 65, 727–731 CrossRef PubMed.
- R. D. B. Fraser and E. Suzuki, Anal. Chem., 1969, 41, 37–39 CrossRef CAS.
- P. F. Rusch and J. P. Lelieur, Anal. Chem., 1973, 45, 1541–1543 CrossRef CAS.
- V. G. Machado, R. I. Stock and C. Reichardt, Chem. Rev., 2014, 114, 10429–10475 CrossRef CAS PubMed.
- L. Onsager, J. Am. Chem. Soc., 1936, 58, 1486–1493 CrossRef CAS.
- E. Lippert, Z. Naturforsch., A: Phys. Sci., 1955, 10, 541–545 Search PubMed.
- N. Mataga, Y. Kaifu and M. Kolzumi, Bull. Chem. Soc. Jpn., 1956, 29, 465–470 CrossRef CAS.
- T. Kumpulainen, A. Rosspeintner and E. Vauthey, Phys. Chem. Chem. Phys., 2017, 19, 8815–8825 RSC.
- R. Jimenez, G. R. Fleming, P. V. Kumar and M. Maroncelli, Nature, 1994, 369, 471–473 CrossRef CAS.
- X.-X. Zhang, M. Liang, N. P. Ernsting and M. Maroncelli, J. Phys. Chem. B, 2013, 117, 4291–4304 CrossRef CAS PubMed.
- R. S. Fee and M. Maroncelli, Chem. Phys., 1994, 183, 235–247 CrossRef CAS.
- G. van der Zwan and J. T. Hynes, J. Phys. Chem., 1985, 89, 4181–4188 CrossRef CAS.
- F. Cichos, A. Willert, U. Rempel and C. von Borczyskowski, J. Phys. Chem. A, 1997, 101, 8179–8185 CrossRef CAS.
- B. M. Luther, J. R. Kimmel and N. E. Levinger, J. Chem. Phys., 2002, 116, 3370 CrossRef CAS.
- R. L. Christensen, R. C. Drake and D. Phillips, J. Phys. Chem., 1986, 90, 5960–5967 CrossRef CAS.
- C. Qiu and G. J. Blanchard, J. Phys. Chem. B, 2015, 119, 1986–1993 CrossRef CAS PubMed.
Footnote |
| † Electronic supplementary information (ESI) available: Additional experimental details, characterization of the macroscopic solvent properties, supplementary experimental data, fits and parameters. See DOI: 10.1039/d0ra04525j |
| This journal is © The Royal Society of Chemistry 2020 |

