DOI:
10.1039/D0RA04371K
(Paper)
RSC Adv., 2020,
10, 22432-22439
Facile fabrication of hierarchical p-Ag2O/n-Nb2O5 heterojunction microspheres with enhanced visible-light photocatalytic activity
Received
16th May 2020
, Accepted 5th June 2020
First published on 11th June 2020
Abstract
Constructing p–n heterojunction is an efficient strategy to improve the photocatalytic efficiency. Here, we report a hierarchical Ag2O/Nb2O5 heterojunction composite as a novel and efficient visible-light driven photocatalyst. Hierarchical Nb2O5 microspheres were prepared by a hydrothermal method, and then the in situ growth of Ag2O nanoparticles on their surfaces was realized by a simple deposition method. Structural and textural features of the Ag2O/Nb2O5 composites were investigated, revealing that Ag2O nanoparticles were well distributed on the surface of Nb2O5 microspheres. Photocatalytic degradation of rhodamine B (RhB) was significantly enhanced by Ag2O/Nb2O5 photocatalysts under visible light. The optimal Ag/Nb molar ratio was determined to be 0.15![[thin space (1/6-em)]](https://www.rsc.org/images/entities/char_2009.gif) :1, which yielded a 21.8 times faster degradation rate constant than plain Nb2O5 microspheres and had excellent stability for at least 4 catalytic cycles. The superior photocatalytic performance of Ag2O/Nb2O5 photocatalyst can be ascribed to the hierarchical superstructure as well as the heterojunction between Ag2O and Nb2O5, which facilitated the separation of photogenerated charge carriers. This work has potential application in the future for solving environmental pollution.
:1, which yielded a 21.8 times faster degradation rate constant than plain Nb2O5 microspheres and had excellent stability for at least 4 catalytic cycles. The superior photocatalytic performance of Ag2O/Nb2O5 photocatalyst can be ascribed to the hierarchical superstructure as well as the heterojunction between Ag2O and Nb2O5, which facilitated the separation of photogenerated charge carriers. This work has potential application in the future for solving environmental pollution.
1. Introduction
Environmental pollution has been an extremely serious problem recently. As one of the most valid and promising techniques, semiconductor photocatalysts can decompose organic pollutants into simple, non-hazardous CO2 and H2O under aqueous conditions with the assistance of solar energy, and thus received widespread attention.1,2 Metal oxide semiconductor materials such as TiO2, ZnO, Fe2O3, Nb2O5 are used frequently in photocatalytic process.3–6 Among these semiconductors, Nb2O5 has been widely investigated for photodegradation,7 gas sensing,8 electrochromic materials,9 photoelectrodes,10 water splitting,11,12 solar cells,13 and lithium ion batteries14 owing to its advantageous properties, such as higher photocatalytic activity, nontoxicity, and high stability under light irradiation. However, analogous to TiO2, the low absorption of visible light and the rapid recombination of photoinduced hole–electron pairs hamper its photocatalytic efficiency, thus restricting their practical applications.15,16 Interestingly, combining Nb2O5 with narrow band-gap semiconductors to form a heterostructure provides a promising way to enhance the visible-light responsive activity.17 p-Type Ag2O is an attractive visible-light driven photocatalyst for the degradation of organic pollutants due to its high efficiency, easy preparation and eco-friendliness.18 It has been demonstrated that the p–n heterojunctions of Ag2O with other n-type oxide semiconductors could efficiently enhance the visible-light induced photocatalytic activity, such as Ag2O/TiO2,19,20 Ag2O/TaON,21 Ag2O/Bi2WO6,22 Ag2O/NaTaO3,23 and so on.24–26 The photogenerated electrons can move to the conduction band of n-type semiconductor and photogenerated holes can move to the valence band of p-type Ag2O which promote an interfacial electron transfer process and reduce the charge recombination in the semiconductor.27 Moreover, the coexistence of Ag2O and semiconductor maintains the photocatalytic stability of the Ag2O.28
The photocatalytic activity is also related with the size, shape, surface area, morphology and the dimension of the catalysts.29 Nanometer-scaled Nb2O5 based catalysts, such as nanoparticles.30 nanorods,31 nanoneedles,32 nanowires,33 nanofibers,34 nanosheets35 and microspheres10 exhibit promising photoelectrochemical performance. Recently, many studies found that three-dimensional hierarchical microsphere self-assembled from one dimension nanorods, nanowires, nanotubes, etc., are highly desired due to their high surface-to-volume ratio, high organic pollutant adsorption, and excellent incident light scattering within the structures.36–38 In addition, the three-dimensional microstructures can be completely separated and recovered from the treated aqueous solution after photocatalysis reaction. Zhai et al. reported flower-like hierarchical Nb2O5 microspheres self-assembled by nanorods as well as their electrochemical performances in detail.39
Currently studies of the fabrication and photocatalysis performance of Ag2O/Nb2O5 system are extremely scanty, particularly, there is no report on the hierarchical heterostructural microspheres of such system. In the present work, a series of hierarchical Ag2O/Nb2O5 heterojunction microspheres were prepared using a simple hydrothermal and deposition method. The photocatalytic activities of these heterojunctions were evaluated by the degradation of rhodamine B (RhB) under visible light irradiation. Furthermore, a possible mechanism for the enhanced photocatalytic activity of Ag2O/Nb2O5 heterojunction was proposed.
2. Experimental methods
2.1 Material
Analytical reagents of NbCl5, rhodamine B (RhB), oxalic acid dihydrate, triethylamine, AgNO3 and NaOH were utilized as primeval materials. The above were all purchased from the Chinese Chemical Reagent factory. All experimental water used was deionized water.
2.2 Synthesis of hierarchical Nb2O5 microspheres
Hierarchical Nb2O5 microspheres were prepared hydrothermally. In a typical procedure, 0.2 g of NbCl5 was added into 40 mL of deionized water under vigorous stirring to form a white floccule, then 10 mL of 1 M oxalic acid aqueous solution was added into the suspension and stirred till it became transparent. Finally, 0.7 mL of triethylamine was added dropwise and the reaction mixture was continuously stirred for 1 h. The solution was transferred into a 100 mL Teflon lined autoclave and kept at 200 °C for 24 h. The precipitate was then collected by filtration, washed with deionized water 5 times and then dried in an air dry oven at 60 °C, and hierarchical Nb2O5 microspheres (denoted as HMNb) were obtained by annealing the dried precipitate at 600 °C for 2 h.
2.3 Fabrication of Ag2O/Nb2O5 heterojunction microspheres
Hierarchical Ag2O/Nb2O5 heterojunction microspheres were fabricated by chemical deposition. Typically, the as-prepared HMNb (0.5 mmol, 133 mg) were dispersed into 15 mL of deionized water in a 50 mL beaker by ultrasonication for 30 min. AgNO3 (0.15 mmol, 25.5 mg) was then added, and the suspension was stirred at room temperature for 1 h. Then, 15 mL of 0.4 M NaOH aqueous solution was added dropwise into the suspension under magnetic stirring. After stirring for 1 h, the obtained dark brown Ag2O/Nb2O5 sample with Ag/Nb molar ratio of 0.15/1 (denoted as HMAgNb-15) collected by centrifugation was washed with deionized water and dried at 60 °C for 8 h. Similarly, three other Ag2O/Nb2O5 composites with different Ag/Nb molar ratios (0.05/1, 0.1/1, 0.2/1) were prepared and denoted as HMAgNb-5, HMAgNb-10 and HMAgNb-20, respectively. The synthesis scheme of HMAgNb was displayed in Fig. 1. Pure Ag2O was synthesized following the same procedures without addition of Nb2O5.
 |
| | Fig. 1 The preparation process of hierarchical Ag2O/Nb2O5 heterojunction microspheres. | |
2.4 Characterization
The morphology and composition of samples were measured by scanning electron microscopy (SEM, Hitachi SU8010) and transmission electron microscopy (TEM, JEM-2100F JEOL). Powder X-ray diffraction (XRD) data were acquired using a Rigaku ULTIMA IV diffractometer. The elemental compositions and electronic states of elements of the sample were analyzed by X-ray photoelectron spectroscopy (XPS, K-ALPHA, Thermo Scientific). The textural properties of the materials were analyzed by a nitrogen adsorption analyzer apparatus (Micromeritics ASAP2460). The ultraviolet-visible diffuse reflectance spectra (UV-Vis DRS) of samples were recorded on a spectrophotometer (Shimadzu UV-2600). A F-4600 spectrophotometer (Hitachi) was deployed to obtain the photoluminescence (PL) spectra, and the excitation wavelength used in the test for PL lifetime was 325 nm.
2.5 Photocatalytic activity experiments
The photocatalytic performances of all catalysts for the degradation of RhB were evaluated under visible light (300 W xenon lamp, λ > 420 nm). The temperature of the reaction system was kept at 25 ± 2 °C by cycling water. Typically, 0.1 g of catalyst was added into 100 mL of RhB (10 mg L−1) solution. The suspension was magnetically stirred for 30 min before the light irradiation. During the irradiation, approximately 2 mL of solution was sampled at defined time intervals and centrifuged. The RhB concentration in the solution was analyzed by the absorption at 554 nm using a UV-1801 spectrophotometer. The degradation rate of the RhB solution was calculated using the following equation:| | |
η = [(C0 − Ct)/C0] × 100%
| (1) |
where η is the decomposition efficiency, C0 is the initial concentration of the RhB and Ct is the concentration of the RhB at given reaction time [t (min)].
3. Results and discussion
3.1 Structure and morphology
Crystallinities of the HMNb and HMAgNb composites with different Ag/Nb molar ratio were analyzed using XRD as shown in Fig. 2a. For HMNb, the sharp diffraction peaks suggested that the as-synthesized Nb2O5 sample was well crystallized. The peaks at 22.6°, 28.4°, 28.9°, 36.6°, 46.1°, 50.0°, 50.9°, 55.4°, 56.4° and 58.8° correspond to the (001), (180), (200), (181), (002), (0160), (380), (202), (381) and (2160) planes, which was in good agreement with the orthorhombic Nb2O5 (JCPDS no. 30-0873). For Ag2O/Nb2O5 composites, the XRD patterns of HMAgNb-5 is similar to that of HMNb. No characteristic peaks of Ag2O was detected probably because of low content of Ag2O in HMAgNb-5 composites. The XRD patterns of HMAgNb-10, HMAgNb-15 and HMAgNb-20 could be attributed to a combination of Nb2O5 and Ag2O. The diffraction peak observed at 2θ = 32.8° could be well indexed as the (111) plane of cubic phase Ag2O (JCPDS no. 41-1104). The intensity of Ag2O peak enhanced gradually when the Ag/Nb molar ratio increased. Similar phenomenon was also reported in an earlier literature.40 Moreover, The peak observed at 2θ = 38.2° correspond to the (111) plane of cubic phase metallic Ag (JCPDS no. 41-1104).
 |
| | Fig. 2 (a) XRD patterns of the HMNb, HMAgNb-5, HMAgNb-10, HMAgNb-15, HMAgNb-20 and standard XRD pattern of Nb2O5 (JCPDS no. 30-0873). (b) XPS survey of the HMAgNb-15. (c–e) High-resolution XPS spectra for the Ag 3d, Nb 3d, and O 1s. | |
The electronic state and the composition of HMAgNb composites were investigated using the XPS detection. Fig. 2b presented a full range XPS spectrum of HMAgNb-15, revealing only Nb, O, Ag and a carbon peak. The trace amount of C was attributed to the adventitious hydrocarbon from the XPS instrument itself. The high-resolution XPS spectra of Ag 3d were shown in Fig. 2c, and the Ag 3d spectra consisted of two individual peaks at about 373.7 and 367.7 eV, which were attributed to Ag 3d3/2 and Ag 3d5/2 binding energy, respectively. The Ag 3d3/2 peak was further divided into two different peaks at 373.7 and 374.7 eV, and the Ag 3d5/2 peak was divided into two different peaks at 367.7 and 368.30 eV. The peaks at 373.7 and 367.7 eV were attributed to Ag+ of Ag2O, while the peaks at 374.4 and 368.3 eV were assigned to metallic Ag.41 The as-constructed Ag2O structure could promote the migration of photoinduced electrons and absorbance of visible light photons, consequently improving the separation efficiency of charge carriers and the visible light driven photocatalytic performance.42 Moreover, the peak at 365.2 eV corresponded to Nb 3p3/2 of Nb2O5.43 The XPS spectra of Nb 3d indicated two peaks at 207.3 eV and 210.1 eV, as shown in Fig. 2d, which corresponded to the typical binding energies for Nb 3d5/2 and Nb 3d3/2 in Nb2O5.32 These results indicated that Nb and Ag existed as Nb2O5, Ag2O and metallic Ag in the prepared composites, which supported the XRD result. Fig. 2e showed that the O 1s core-level spectra fitted well to three peaks at the binding energies of 530.4, 532.0 and 533.3 eV, which were related to the Nb–O bond in Nb2O5, the Ag–O bond in Ag2O and the O–H bond of surface-absorbed water, respectively.20,44,45
SEM was used to investigate the morphology of the resulting samples. Fig. 3a revealed that HMNb showed uniform microspheres with diameters of ∼2 μm and these microspheres were composed of relatively smooth Nb2O5 nanorods. These nanorods radiating from the center of the microsphere, were geometrically uniform without particulate impurities. The length of Nb2O5 nanorods was about 1 μm with a diameter of 50 nm. The illustrative SEM and high resolution SEM (HRSEM) images of HMAgNb-15 was shown in Fig. 3b and c. After the surface decoration with Ag2O nanoparticles, HMAgNb-15 composites remained the shape of microsphere self-assembled by nanorods (Fig. 3b). Fig. 3c showed that Ag2O nanoparticles anchored onto the surface of the nanorods. Fig. 3d was the corresponding energy dispersive X-ray spectroscopy of the sample shown in Fig. 3b, which showed that the obtained microspheres were composed of the elements Nb, O, and Ag. Fig. 3e–g correspond to the EDX elemental mapping images of Nb, O, and Ag, which showed the distribution of the Ag elements on the surface was homogeneous, confirming that Ag2O nanoparticles were successfully decorated onto the Nb2O5 microspheres.
 |
| | Fig. 3 (a) SEM image of HMNb. (b) SEM and (c) HRSEM images of HMAgNb-15 and (d–g) its corresponding EDS pattern and elemental mapping images of O, Nb, Ag. | |
TEM and high resolution TEM (HRTEM) images were used to further confirm the formation of HMAgNb-15. The illustrative TEM image of HMAgNb-15 heterostructure was shown in Fig. 4a, which also displayed Nb2O5 microsphere assembled by nanorods and the Ag2O nanoparticles were covering the surface of microspheres. High magnification image of the same sample (Fig. 4b) illustrated that Ag2O nanoparticles of size 5–20 nm were tightly coupled on the Nb2O5 nanorod surface to form heterostructure, which was beneficial to electron transmission between two phases.46 In the HRTEM lattice image (Fig. 4c) of HMAgNb-15, the interplanar spacing of 0.314 nm corresponded to the (180) plane of orthorhombic Nb2O5,39 while 0.278 nm corresponded to (111) plane of Ag2O.21
 |
| | Fig. 4 (a) TEM image of HMNb-15. (b and c) HRTEM images of HMAgNb-15. | |
N2 adsorption–desorption analysis was used to determine the specific surface area of HMAgNb-15, and the result was shown in Fig. 5. The adsorption–desorption isotherm curves displayed type-IV isotherm with type-H3 hysteresis loop at the relative pressure (P/P0) ranging from 0.4–1.0, demonstrating the mesoporous texture of the hierarchical microspheres. According to the Brunauer–Emmett–Teller (BET) method, the specific surface area of HMAgNb-15 was calculated to be 30.25 m2 g−1. The high surface area of Ag2O/Nb2O5 heterojunction could be attributed to its hierarchical structure. Moreover, the inset in Fig. 5 displayed the pore-size distribution calculated by the Barrett–Joyner–Halenda (BJH) method, which showed the pores were mainly in the range of 5–30 nm, which was favorable for catalysis.47
 |
| | Fig. 5 N2 adsorption and desorption isotherms of the HMAgNb-15, illustrated with pore size distribution curve. | |
3.2 UV-vis DRS
The optical properties of a semiconductor photocatalytic material have an important relationship with its band structure, which is one of the significant factors for predicting their photocatalytic performance.48 The UV-Vis spectra of HMNb and HMAgNb composites were depicted in Fig. 6a. It could be seen that a typical absorption characteristic of the wide band gap semiconductor with an edge about 400 nm depicted in the absorption spectrum of HMNb, which had high absorption in the UV region but relatively low absorption in visible light region. In contrast, the HMAgNb composites had the higher absorption in both UV and visible region than plain Nb2O5. Moreover, the absorption intensity of HMAgNb composites gradually enhanced as the Ag+ content increased. The corresponding energy gap could be obtained according to a plot of the transformed Kubelka–Munk function versus the energy of the exciting light hν = A(hν − Eg)1/2. As shown in Fig. 6b, the Eg values of HMNb-5, HMAgNb-10, HMAgNb-15 and HMAgNb-20 were estimated to be 2.78 eV, 2.51 eV, 2.41 eV and 2.06 eV, respectively, which were lower than the plain Nb2O5 (∼3.01 eV). This suggested that the synthetized HMAgNb composites had smaller band gap than plain Nb2O5, which was the precondition of effective photocatalytic activity in visible region. The band edge positions (conduction band edge potential, ECB; valence band edge potential, EVB) of HMNb were determined by the following equations:where, X was the electronegativity of the semiconductor. E0 was a constant (∼4.5 eV). According to the above equations, the EVB and ECB of HMNb were estimated to be 3.30 eV and 0.29 eV. In addition, according to the literature, the EVB and ECB of Ag2O were 1.44 eV and 0.14 eV, respectively.17
 |
| | Fig. 6 (a) UV-vis DRS spectra, (b) corresponding band gap and (c) PL spectra of HMNb and HMAgNbs with different Ag/Nb mole ratios. | |
3.3 PL analysis
PL spectra were applied to investigate the separation efficiency of photogenerated electrons and holes in the HMAgNb heterojunction together with that of plain Nb2O5 for comparison (Fig. 6c). All samples exhibited an emission peak centered at about 530 nm, which was similar to the reported value in the literature.7 The intensity of PL for Ag2O/Nb2O5 composites was lower than that of plain Nb2O5, which revealed the lower recombination rate of electron–hole pairs and hence higher separation efficiency in Ag2O/Nb2O5 than in plain Nb2O5. When the recombination rate decreases, more photogenerated charge carriers can participate in the photochemical transformation, resulting in the enhancement of photocatalytic activity.49 With increased Ag content, the PL intensity decreased and reached a minimum value at Ag/Nb molar ratio of 0.15/1. When the Ag content exceeded this value, the PL intensities increased remarkably. We speculated that the reason was that the Ag2O incorporated into the Nb2O5 could act as the electron-trapped agent to promote the electron–hole separation at low concentration, but as the recombination center when the Ag concentration exceeded the threshold and began to aggregate.
3.4 Photocatalytic performance
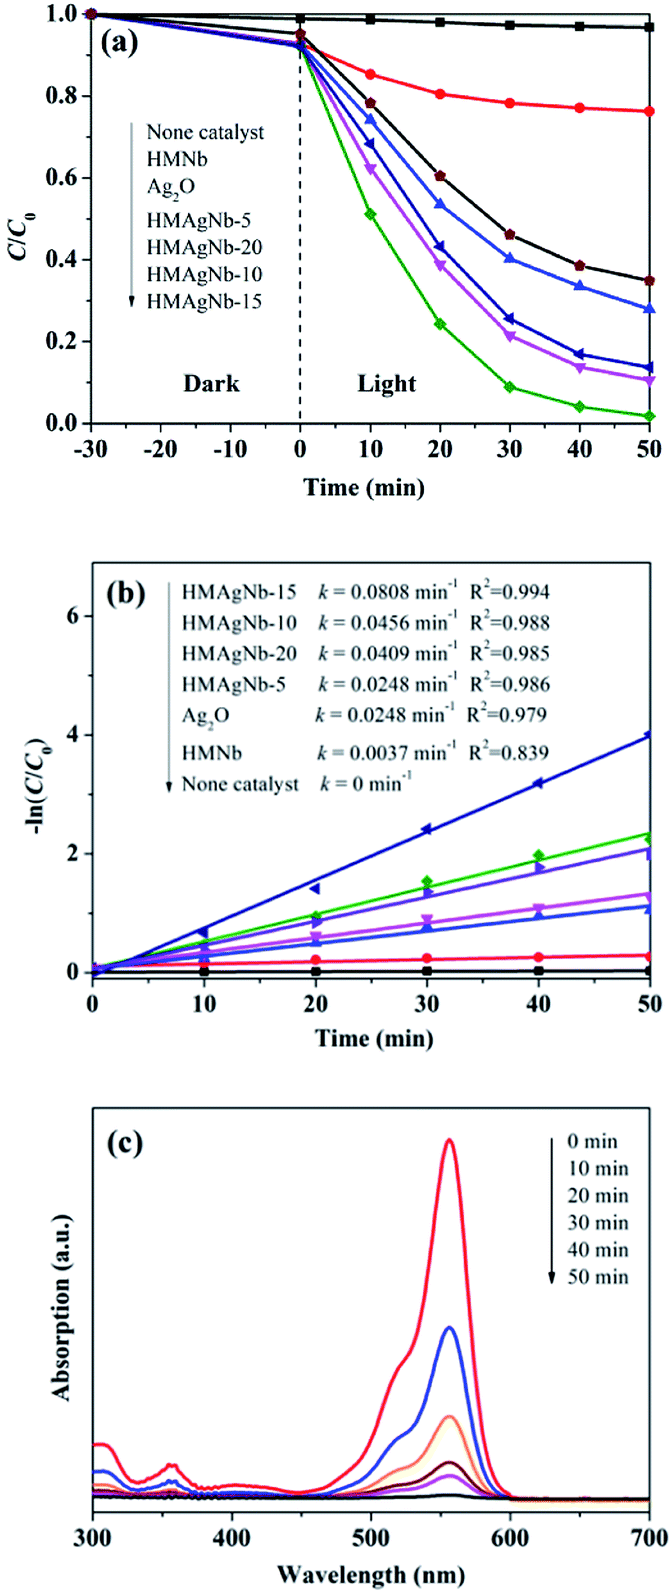
Fig. 7a showed photocatalytic activity of as-prepared HMNb, Ag2O and HMAgNb composites with different molar ratio of Ag/Nb in the degradation of RhB. The blank test suggested that RhB was very stable without catalysts under visible light. Pure Nb2O5 and Ag2O showed low photocatalytic activity under visible light, which degradation percentage of RhB were 23.7% and 65.1% after 50 min irradiation, respectively. It was observed that all HMAgNb heterojunction remarkably enhanced activities compared with plain HMNb and Ag2O, and the RhB degradation efficiencies of HMAgNb-5, HMAgNb-10, HMAgNb-15 and HMAgNb-20 after 50 min of reaction reached up to 72.1%, 89.4%, 98.2% and 87.3%, respectively. HMAgNb-15 had the highest activity among all Ag2O/Nb2O5 heterojunction. By contrast, the loading of too low or too high content of Ag2O could not efficiently promote the separation of charges, resulting in an unsatisfactory activity, which was similar to previous reports.21 In addition, the photocatalysis degradation kinetic reaction can be described by pseudo-first-order kinetics, ln(C/C0) = −kt, where k is the apparent first-order rate constant and t is the irradiation time. The variations in −ln(C/C0) as a function of irradiation time were given in Fig. 7b. The rate constants of HMAgNb-5, HMAgNb-10, HMAgNb-15 and HMAgNb-20 were determined to be 0.0248 min−1, 0.0456 min−1, 0.0808 min−1 and 0.0407 min−1, respectively. As expected, HMAgNb-15 achieved the highest rate constant, which was approximately 21.8 times and 3.3 times higher than that of HMNb (0.0037 min−1) and Ag2O (0.0248 min−1), respectively. Fig. 7c showed the absorption spectra of the RhB aqueous solution with the reaction time in the presence of HMAgNb-15. Obviously, a decrease in intensity of the absorption peak of RhB (main peak at 554 nm) could be clearly observed with prolong the reaction time to about 50 min, which indicated that the RhB molecules were gradually degraded.50
 |
| | Fig. 7 (a) Photocatalytic degradation of RhB over HMAgNb, Ag2O and HMAgNbs with different Ag/Nb mole ratios under visible light irradiation. (b) Corresponding pseudo first-order plots and rate constant k over various samples. (c) Absorption spectra of RhB solution with different irradiation times using HMAgNb-15 as photocatalyst. | |
To investigate the photocatalytic stability of Ag2O/Nb2O5 heterojunction, four cycles of photodegradation of RhB were conducted using HMAgNb-10 and HMAgNb-15 catalyst as models. The recovered Ag2O/Nb2O5 nanostructures were reused in the next cycle. Fig. 8 showed that there was no significant reduction of the photocatalytic degradation efficiency after four repeated cycles. This proved that the as-synthesized Ag2O/Nb2O5 heterojunction catalysts were not only effective but also highly stable, and thus should be a good candidate for the photocatalytic degradation of RhB under visible light.
 |
| | Fig. 8 Recycled performances in the presence of Ag2O/Nb2O5 heterojunction microspheres for photodegradation of RhB. | |
3.5 Degradation mechanism
On the basis of the above analyses, three major reasons may account for the outstanding photocatalytic property of the Ag2O/Nb2O5 heterojunction. Firstly, the hierarchical superstructures of the HMAgNb heterojunction (Fig. 3 and 4) could enhance the absorption of light via multiple reflection and supply more transport paths and catalytic sites, promoting the photocatalytic degradation. Secondly, the photoabsorption range of HMAgNb was substantially broadened from the UV to visible-light regime as shown in Fig. 6a. Undoubtedly, this broadening facilitates the absorption and utilization of more visible light, and as a result the production of more photogenerated hole–electron pairs under visible-light irradiation. Last but not least, the formation of the p–n heterojunction between Ag2O and Nb2O5 is an effective architecture for the highly efficient charge collection and separation (Fig. 9). Due to the fact that the Fermi level of Ag2O is lower than that of Nb2O5, when p-type Ag2O and n-type Nb2O5 are in contact, a p–n junction structure forms and the Fermi levels of p-type Ag2O and n-type Nb2O5 tend to move up and move down, respectively. Thus, quasi-Fermi levels for each semiconductor are generated and an equilibrium state forms. Consistent with the change of the Fermi level, the whole energy band of p-type Ag2O raises up, while that of n-type Nb2O5 lowers. As a result, the CB of Nb2O5 becomes further lower than that of Ag2O. Meanwhile, a space-charge region at the interfaces from n-type Nb2O5 to p-type Ag2O is established.23 Under visible light irradiation, electrons and holes are produced in Ag2O and Nb2O5. Afterwards, the photogenerated electrons in the CB of Ag2O tend to transfer to that of Nb2O5, while photogenerated holes in the VB of Nb2O5 tend to transfer to that of Ag2O. Such a transfer process is beneficial to the separation of electrons and holes.51 Additionally, the formation of metallic Ag via the decomposition of partial Ag2O can further facilitate electron migration to retard the recombination of charge carriers.52 Consequently, the separation of electron–hole pairs can be greatly boosted, which is verified by the PL characterization (Fig. 6c). The photogenerated electrons reduce O2 to produce ˙O2− radicals, further degrading RhB into small molecules, e.g., H2O and CO2. Meanwhile, the photogenerated holes concentrated in the VB of Ag2O can directly decompose RhB. As a result, the photocatalytic activity of the Ag2O/Nb2O5 p–n heterojunction is improved greatly.
 |
| | Fig. 9 Schematic of the possible reaction mechanism of the photocatalytic procedure. | |
4. Conclusions
Hierarchical Ag2O/Nb2O5 heterojunction microspheres comprised of nanorods assembled Nb2O5 microspheres and homogeneously distributed Ag2O nanoparticles were prepared via a simple hydrothermal and deposition method. These heterojunctions showed enhanced photocatalytic activity than plain Nb2O5 for the degradation of RhB. The Ag2O/Nb2O5 heterojunction microspheres with the Ag/Nb molar of 0.15/1 exhibited the highest activity among the as-prepared samples. The exceptional photocatalytic performance of Ag2O/Nb2O5 is predominantly due to the hierarchical superstructure and the formation of the heterojunction, facilitating the efficient separation of photogenerated charge carriers. The recycling experiment demonstrated the stability of Ag2O/Nb2O5 heterojunction microspheres, proving the usefulness of reported catalysts for organic pollutants degradation. We expect these heterojunctions should contribute significantly in the field of pollution treatment and be useful to related industry.
Conflicts of interest
There are no conflicts declare.
Acknowledgements
This work was financially supported by the Natural Science Foundation of the Jiangsu Higher Education Institutions of China (No. 18KJB610016), the Qing Lan Project of Jiangsu Province of China, Nantong Science and Technology Program of China (No. JC2019160 and No. JC2018080).
References
- S. Zhu and D. Wang, Adv. Energy Mater., 2017, 7, 1700841 CrossRef.
- S. Li, S. Hu, K. Xu, W. Jiang, J. Liu and Z. Wang, Nanomaterials, 2017, 7, 22 CrossRef PubMed.
- S. Ho, J. C. Yu and S. Lee, Chem. Commun., 2006, 10, 1115 RSC.
- U. Shaislamov and H. Lee, CrystEngComm, 2018, 20, 7492 RSC.
- L. Zhu, L. Wang, N. Bing, C. Huang, L. Wang and G. Liao, ACS Appl. Mater. Interfaces, 2013, 5, 12478 CrossRef CAS PubMed.
- W. Zhao, W. Zhao, G. Zhu, T. Lin, F. Xu and F. Huang, Dalton Trans., 2016, 45, 3888 RSC.
- J. Bai, J. Xue, R. Wang, Z. Zhang and S. Qiu, Dalton Trans., 2018, 47, 3400 RSC.
- R. A. Kadir, R. A. Rani, M. M. Y. A. Alsaif, J. Z. Ou, W. Wlodarski, A. P. O'Mullane and K. Kalantar-zadeh, ACS Appl. Mater. Interfaces, 2015, 7, 4751 CrossRef PubMed.
- D. D. Yao, R. A. Rani, A. P. O'Mullane, K. Kalantar-zadeh and J. Z. Ou, J. Phys. Chem. C, 2014, 118, 476 CrossRef CAS.
- S. Guo, X. Zhang, Z. Zou, G. Gao and L. Liu, J. Mater. Chem. A, 2014, 2, 9236 RSC.
- H. Huang, J. Zhou, J. Zhou and M. Zhu, Catal. Sci. Technol., 2019, 9, 3373 RSC.
- H. Huang, C. Wang, J. Huang, X. Wang, Y. Du and P. Yang, Nanoscale, 2014, 6, 7274 RSC.
- R. Ghosh, M. K. Brennaman, T. Uher, M. R. Ok, E. T. Samulski, L. E. McNeil, T. J. Meyer and R. Lopez, ACS Appl. Mater. Interfaces, 2011, 3, 3929 CrossRef CAS PubMed.
- L. Lou, X. Kong, T. Zhu, J. Lin, S. Liang, F. Liu, G. Cao and A. Pan, Sci. China Mater., 2019, 62, 465 CrossRef CAS.
- F. A. Qaraah, S. A. Mahyoub, M. E. Hafez and G. Xiu, RSC Adv., 2019, 9, 39561 RSC.
- M. Naguib, I. N. Ivanov, J. K. Keum, Z. Qin, Z. Guo and Z. Wu, ChemSusChem, 2018, 11, 688 CrossRef.
- R. G. Marques, A. M. Ferrari-Lima, V. Slusarski-Santana and N. R. C. Fernandes-Machado, J. Environ. Manage., 2017, 195, 242 CrossRef CAS PubMed.
- J. Ahmad and K. Majid, Adv. Compos. Hybrid Mater., 2018, 1, 374 CrossRef CAS.
- O. A. Zelekew and D. H. Kuo, Phys. Chem. Chem. Phys., 2016, 18, 4405 RSC.
- B. Liu, L. Mu, B. Han, J. Zhang and H. Shi, Appl. Surf. Sci., 2017, 396, 1596 CrossRef CAS.
- S. Li, S. Hu, W. Jiang, Y. Liu, J. Liu and Z. Wang, Mol. Catal., 2017, 435, 135 CrossRef CAS.
- J. Zhang, H. Liu and Z. Ma, Mol. Catal., 2016, 424, 37 CrossRef CAS.
- S. Yang, D. Xu, B. Chen, B. Luo, X. Yan, L. Xiao and W. Shi, Appl. Surf. Sci., 2016, 383, 214 CrossRef CAS.
- Y. Cui, H. Sun and P. Guo, Nanotechnology, 2020, 31, 245702 CrossRef PubMed.
- B. Das, B. Das, N. Das, S. Pal, B. Das, S. Sarkar and K. K. Chattopadhyay, Appl. Surf. Sci., 2020, 515, 145958 CrossRef CAS.
- G. Fan, B. Du, J. Zhou, W. Yu, Z. Chen and S. Yang, Appl. Catal., B, 2020, 265, 118610 CrossRef.
- D. Sarkar, C. K. Ghosh, S. Mukherjee and K. K. Chattopadhyay, ACS Appl. Mater. Interfaces, 2013, 5, 331 CrossRef CAS PubMed.
- A. Taufik, V. Paramarta, S. P. Prakoso and R. Saleh, J. Phys.: Conf. Ser., 2017, 820, 12017 CrossRef.
- Y. Jiang, J. Scott and R. Amal, Appl. Catal., B, 2012, 126, 290 CrossRef CAS.
- G. Falk, M. Borlaf, T. Bendo, A. P. N. D. Oliveira, J. B. R. Neto and R. Moreno, J. Am. Ceram. Soc., 2016, 99, 1968 CrossRef CAS.
- H. Wen, Z. Liu, J. Wang, Q. Yang, Y. Li and J. Yu, Appl. Surf. Sci., 2011, 257, 10084 CrossRef CAS.
- J. Xue, R. Wang, Z. Zhang and S. Qiu, Dalton Trans., 2016, 45, 16519 RSC.
- Z. Zhang, G. Zhang, L. He, L. Sun, X. Jiang and Z. Yun, CrystEngComm, 2014, 16, 3478 RSC.
- S. Qi, L. Fei, R. Zuo, Y. Wang and Y. Wu, J. Mater. Chem. A, 2014, 2, 8190 RSC.
- H. Luo, M. Wei and K. Wei, Mater. Chem. Phys., 2010, 120, 6 CrossRef CAS.
- Z. Zheng, B. Huang, X. Qin, X. Zhang and Y. Dai, Chem.–Eur. J., 2010, 16, 11266 CrossRef CAS PubMed.
- Z. Wang, J. Hou, C. Yang, S. Jiao, K. Huang and H. Zhu, Phys. Chem. Chem. Phys., 2013, 15, 3249 RSC.
- P. Hu, D. Hou, Y. Wen, B. Shan, C. Chen, Y. Huang and X. Hu, Nanoscale, 2015, 7, 1963 RSC.
- J. Zhai, Y. Wu, X. Zhao and Q. Yang, J. Alloys Compd., 2017, 715, 275 CrossRef CAS.
- S. Li, S. Hu, K. Xu, W. Jiang, J. Hu and J. Liu, Mater. Lett., 2017, 188, 368 CrossRef CAS.
- C. Tan, Z. Zhang, Y. Qu and L. He, Langmuir, 2017, 33, 5345 CrossRef CAS PubMed.
- H. Yu, R. Liu, X. Wang, P. Wang and J. Yu, Appl. Catal., B, 2012, 111–112, 326 CrossRef CAS.
- H. Dong, G. Chen, J. Sun, Y. Feng, C. Li and C. Lv, Chem. Commun., 2014, 50, 6596 RSC.
- M. M. Rahman, M. M. Alam and A. M. Asiri, Nanoscale Adv., 2019, 1, 696 RSC.
- B. Boruah, R. Gupta, J. M. Modak and G. Madras, Nanoscale Adv., 2019, 1, 2748 RSC.
- J. Xue, S. Ma, Y. Zhou, Z. Zhang, X. Wu and C. She, RSC Adv., 2015, 5, 3122 RSC.
- X. Li, J. G. Yu and M. Jaroniec, Chem. Soc. Rev., 2016, 45, 2603 RSC.
- Y. Cheng, Y. Yang, Z. Jiang, L. Xu and C. Liu, Nanomaterials, 2020, 10, 797 CrossRef CAS PubMed.
- M. Xu, L. Han and S. Dong, ACS Appl. Mater. Interfaces, 2013, 5, 12533 CrossRef CAS PubMed.
- J. Wu and T. Zhang, J. Photochem. Photobiol., A, 2004, 162, 171 CrossRef CAS.
- F. Wang, Q. Li and D. Xu, Adv. Energy Mater., 2017, 7, 1700529 CrossRef.
- S. Li, L. Mo, Y. Liu, H. Zhang, Y. Ge and Y. Zhou, Nanomaterials, 2018, 8, 914 CrossRef.
|
| This journal is © The Royal Society of Chemistry 2020 |
Click here to see how this site uses Cookies. View our privacy policy here. 
 Open Access Article
 This Open Access Article is licensed under a Creative Commons Attribution-Non Commercial 3.0 Unported Licence
 ab,
Ya Li
ab,
Ya Li