
 Open Access Article
 This Open Access Article is licensed under a Creative Commons Attribution-Non Commercial 3.0 Unported Licence
Facile preparation of porous sheet–sheet hierarchical nanostructure NiO/Ni–Co–Mn–Ox with enhanced specific capacity and cycling stability for high performance supercapacitors
Ying Zhang ab,
Ruidong Xu*ab,
Ziyang Qinb,
Suyang Fengab,
Wenbin Wangb,
Chen Chenb and
Ao Jub
ab,
Ruidong Xu*ab,
Ziyang Qinb,
Suyang Fengab,
Wenbin Wangb,
Chen Chenb and
Ao Jub
aState Key Laboratory of Complex Nonferrous Metal Resources Clean Utilization, Kunming University of Science and Technology, Kunming 650093, China. E-mail: rdxupaper@aliyun.com; Fax: +86 871 65161278; Tel: +86 871 65160072
bFaculty of Metallurgical and Energy Engineering, Kunming University of Science and Technology, Kunming 650093, China
First published on 12th June 2020
Abstract
NiO, Ni–Co–Mn–Ox and NiO/Ni–Co–Mn–Ox on nickel foam substrates were prepared via a chemical bath deposition–calcination. The thermodynamic behavior was observed by TG/DTA. The chemical structure and composition, phase structure and microstructures were tested by XPS, XRD, FE-SEM and TEM. The electrochemical performance was measured by CV, GCD and EIS. The mechanism for formation and enhancing electrochemical performance is also discussed. Firstly, the precursors such as NiOOH, CoOOH and MnOOH grow on nickel foam substrates from a homogeneous mixed solution via chemical bath deposition. Thereafter, these precursors are calcined and decomposed into NiO, Co3O4 and MnO2 respectively under different temperatures in a muffle furnace. Notably, NiO/Ni–Co–Mn–Ox on nickel foam substrates reveals a high specific capacity with 1023.50 C g−1 at 1 A g−1 and an excellent capacitance retention with 103.94% at 5 A g−1 after 3000 cycles in 2 M KOH, its outstanding electrochemical performance and cycling stability are mainly attributed to a porous sheet–sheet hierarchical nanostructure and synergistic effects of pseudo-capacitive materials and excellent redox reversibility. Therefore, this research offers a facile synthesis route to transition metal oxides for high performance supercapacitors.
1. Introduction
Supercapacitors have attracted wide attention for intermittent energy source application such as hybrid electricity-propelled vehicles, portable electronics, and memory back-up systems.1–3 There are two types of capacitor according to the energy storage principle.4,5 One is an electrical double-layer capacitor (EDLC) which stores energy through electrostatic charge separation on electrode/electrolyte surfaces, and active carbon, carbon nanotube and graphene etc., are typical EDLC electrode materials.6–11 The other is a pseudocapacitor which stores its charges via reversible and fast faradaic redox reaction at the electrode material's interface, and its typical electrode materials include metal hydroxide,12,13 metal oxide,14–18 metal sulphide,5,19,20 metal phosphide,21,22 and conductive polymer.23–25 In addition, there are also reports about the use of black phosphorus,26 metal–organic frameworks,27 and MXenes.28A supercapacitor possesses high power density, rapid charge and discharge rate, and durable cycling ability.29,30 Its potential application has inspired a great deal of interest in high-performance electrode materials such as multiple transition metal oxides. Typically, honeycomb-like NiCo2O4@NF exhibits a specific capacity of 646.6 F g−1 at 1 A g−1.31 Three-dimensional (3D) NiCo2O4 nanoflowers exhibit a specific capacity of 543 F g−1 at 1 A g−1 and a capacitance retention of 90.6% at 3 A g−1 after 1000 cycles in 3 M KOH.32 Three-dimensional Ni–Co–Mn LDH nanoflakes with a hierarchical and porous structure deliver a specific capacity of 2012.5 F g−1 at 1 A g−1 and a capacitance retention of 75.0% at 10 A g−1 in 1 M KOH.33 Another hierarchical Ni–Co–Mn ternary oxide nanosheet was synthesized via a two-step strategy involving chemical bath deposition and thermal annealing, and it delivers a specific capacity of 715.1 C g−1 at 1 A g−1 in 1 M KOH.34 A facile method to design Co3O4–MnO2–NiO ternary hybrid 1D nanotube arrays has been reported, which stores charge as high as 2020 C g−1 (equivalent specific capacity of ∼2525 F g−1) and delivers a capacitance retention of 80% at 12.2 A g−1 after 5700 cycles in 1 M KOH.35
Low energy density, low specific capacity, or poor cycling stability are the main problems limiting the use of transition metal oxides in supercapacitors. In our research, deposits of NiO, Ni–Co–Mn–Ox, and NiO/Ni–Co–Mn–Ox were prepared on nickel foam substrates via a chemical bath deposition–calcination. The relationships among chemical structure and composition, phase structures, microstructures, thermodynamic behavior and electrochemical performance are discussed. Notably, NiO/Ni–Co–Mn–Ox on nickel foam substrate exhibits a high specific capacity (1023.50 C g−1 at 1 A g−1) and excellent capacitance retention (103.94% at 5 A g−1 after 3000 cycles in 2 M KOH). Its outstanding electrochemical performance and cycling stability are attributed mainly to a porous sheet–sheet hierarchical nanostructure, the synergistic effects of pseudo-capacitive materials and excellent reversibility.
2. Experimental section
2.1 Preparation for deposition of NiO and Ni–Co–Mn–Ox
Analytical grade chemical reagents including nickel sulfate (NiSO4·6H2O), potassium persulfate (K2S2O8), cobaltous sulfate (CoSO4·7H2O), manganese sulfate (MnSO4·H2O), ammonium hydroxide (NH3·H2O) and hydrochloric acid (HCL), were used to the deposition of NiO and Ni–Co–Mn–Ox.Deposition of NiO, Ni–Co–Mn–Ox, and NiO/Ni–Co–Mn–Ox on nickel foam substrates was performed via a chemical-bath deposition–calcination, as shown in Fig. 1. In which, nickel foam is substrate, NiO is an intermediate layer, and Ni–Co–Mn–Ox is topmost layer. The formation mechanism of Ni–Co–Mn–Ox is as follows.36–38
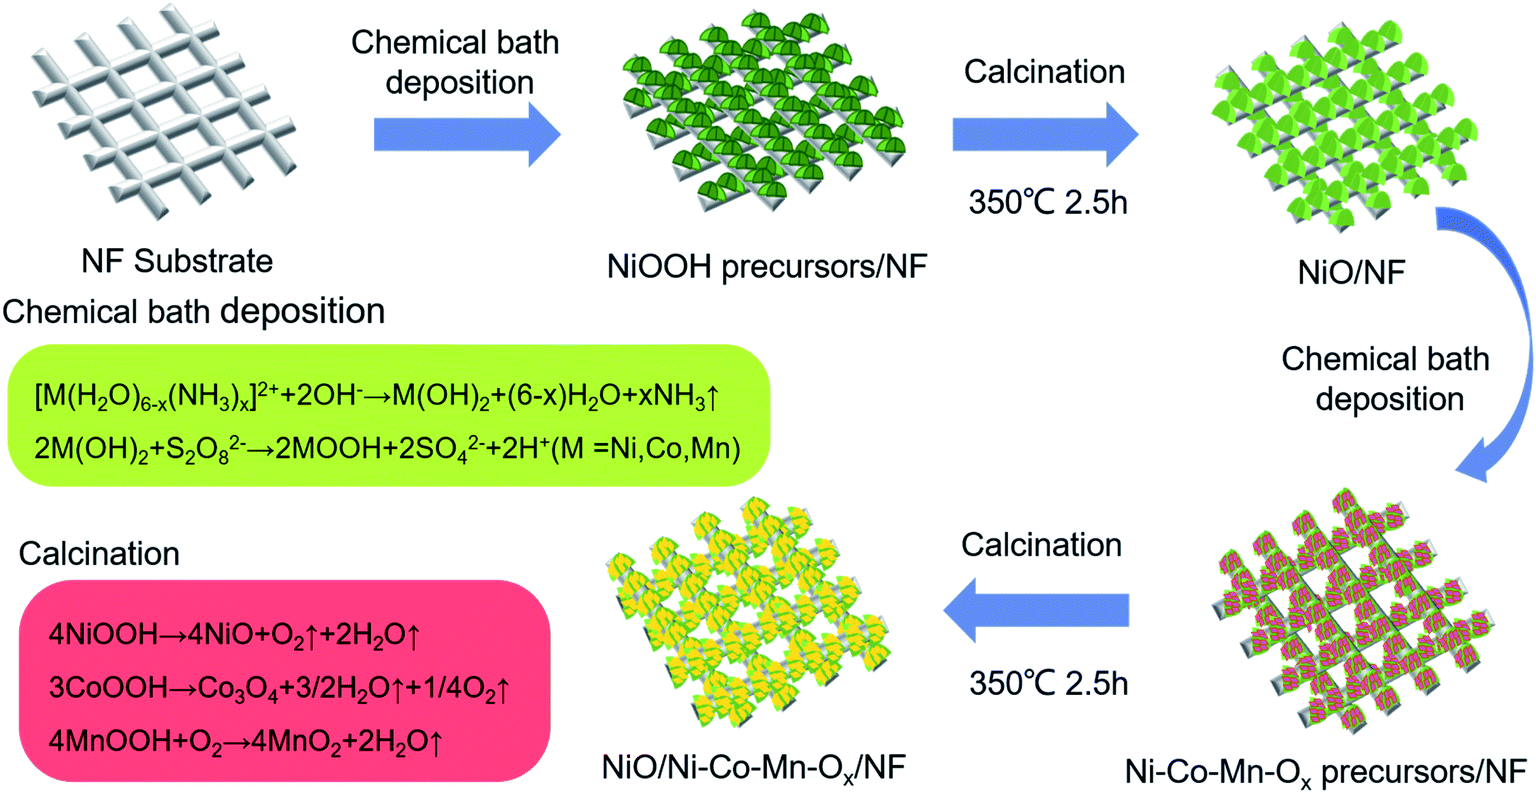 | ||
| Fig. 1 Schematic illustration for preparing NiO and Ni–Co–Mn–Ox deposits on nickel foam (NF) substrates. | ||
Firstly, during the course of the chemical bath deposition, precursors such as NiOOH, CoOOH and MnOOH grew on the surface and the interior of NF substrates in a homogeneous mixed solution through the following reactions: [M(H2O)6−x(NH3)x]2+ + 2OH− → M(OH)2 + (6−x)H2O + xNH3 where M = Ni, Co, or Mn, and 2M(OH)2 + S2O82− → 2MOOH + 2SO42− + 2H+ where M = Ni, Co, or Mn. Secondly, NiOOH, CoOOH and MnOOH precursors were calcined at different temperatures in a muffle furnace, those were decomposed to NiO, Co3O4, and MnO2 through the following reactions: 4NiOOH → 4NiO + O2↑ + 2H2O↑, 3CoOOH → Co3O4 + 3/2H2O↑ + 1/4O2↑ and 4MnOOH + O2 → 4MnO2 + 2H2O↑. Thereafter, a porous sheet–sheet hierarchical composite nanostructure was obtained.
Before the chemical bath deposition of NiOOH precursors or Ni–Co–Mn–Ox precursors (NiOOH, CoOOH, or MnOOH), a pre-treatment process was performed as follows. The NF substrate (1.0 cm × 2.0 cm, and 0.1 cm thick) was immersed in 3 mol L−1 HCl solution and subjected to ultrasonic cleaning for 30 min to remove surface oxide layer. Then it was put in deionized water and anhydrous ethanol to obtain pre-treated NF substrate.
With the NF substrate prepared, 0.016 mol NiSO4·6H2O and 0.008 mol K2S2O8 were dissolved in 40 mL of deionized water with stirring for 10 min to form a homogeneous mixed solution. Thereafter, chemical-bath deposition of NiOOH precursors were performed as follows. The pre-treated NF was placed (vertical) into the homogeneous mixed solution, to which was added 25 wt% NH3·H2O until pH value reached 8.5. After 40 min, the NF loaded with NiOOH precursors was removed from the homogeneous mixed solution, cleaned with deionized water and dried in a vacuum drying oven at 60 °C for 2 h. Finally, calcination of the NiOOH precursors was performed. Dried NiOOH precursors on NF substrates were placed in a muffle furnace with heating at 10 °C min−1 until up to 350 °C. After 2.5 h, the deposit of NiO was obtained on NF substrate.
Next, 0.008 mol NiSO4·6H2O, 0.008 mol CoSO4·7H2O, 0.006 mol MnSO4·H2O, and 0.006 mol K2S2O8 were dissolved in 40 mL of deionized water with stirring for 10 min until a homogeneous mixed solution was prepared. Thereafter, a chemical bath deposition of Ni–Co–Mn–Ox precursors was performed. The pre-treated NF was placed in a vertical orientation in the mixed solution, to which was added 25 wt% NH3·H2O until pH value reached 9.0. After 30 min, the NF loaded with Ni–Co–Mn–Ox precursors was removed from the solution, cleaned with deionized water and dried in a vacuum drying oven at 60 °C for 2 h. Finally, calcination was performed, the dried Ni–Co–Mn–Ox precursors on NF substrates were placed into a muffle furnace with heating at 2 °C min−1 until up to 350 °C. After 2.5 h, a Ni–Co–Mn–Ox deposit was obtained and it consisted of mixed phases of NiO, Co3O4, and MnO2.
Thereby, NiO/NF, Ni–Co–Mn–Ox/NF and NiO/Ni–Co–Mn–Ox/NF were prepared for further characterization, and the loading mass of NiO/Ni–Co–Mn–Ox was about 1.4–1.6 mg cm−2.
2.2 Characterization of structure and microstructure
The surface microstructures and components of NiO, Ni–Co–Mn–Ox and NiO/Ni–Co–Mn–Ox were measured via field-emission scanning electron microscopy (FE-SEM) and recorded on a FEI Nova Nano scanning electron microscope 450 equipped with an energy-dispersive X-ray (EDS) system at 15 kV. More of the microscopic morphology and structure were examined using transmission electron microscopy (TEM) images and high-resolution TEM (HRTEM) images. The phase structures were measured by powder X-ray diffraction (XRD) patterns recorded on a Rigaku D/Max-2200 diffractometer with Cu Kα radiation. The chemical structure and composition were examined using X-ray photoelectron spectroscopy (XPS) spectra recorded on a PHI5000 multifunctional X-ray photoelectron spectrometer. This was followed by thermogravimetric/differential thermal analysis (TG/DTA) performed using a synchronous thermal analyser and recorded on a NETZSCH (STA449F3).2.3 Electrochemical measurements
The cyclic voltammetry (CV) and electrochemical impedance spectroscopy (EIS) of NiO/NF, Ni–Co–Mn–Ox/NF, and NiO/Ni–Co–Mn–Ox/NF were measured using an electrochemical workstation recorded on PARSTAT2273. The galvanostatic charge–discharge (GCD) and cycling stability performance were determined by a CHI760E electrochemical workstation. Among these electrochemical measurements, a standard three-electrode process was performed, in which the prepared sample was used as the working electrode, a saturated calomel electrode (SCE) was used as reference electrode, and platinum foil was used as the counter electrode. The reference electrode and the working electrode were linked by a Luggin capillary filled with agar and potassium chloride. The distance between the capillary and the working electrode was about 2d (where d is the diameter of the capillary). In this case, 2 M KOH aqueous solution was used as electrolyte, and its temperature was maintained at 25 °C.The specific capacity (C, C g−1) was calculated by the following formula:39,40
| C = I × t/m | (1) |
3. Results and discussion
3.1 Surface morphology and microstructure
SEM images of NF, NiO/NF, Ni–Co–Mn–Ox/NF and NiO/Ni–Co-MnOx/NF are shown in Fig. 2(a–d). The surface elemental mappings of Ni, Co, Mn and O for NiO/Ni–Co–MnOx/NF are shown in Fig. 2(e–i).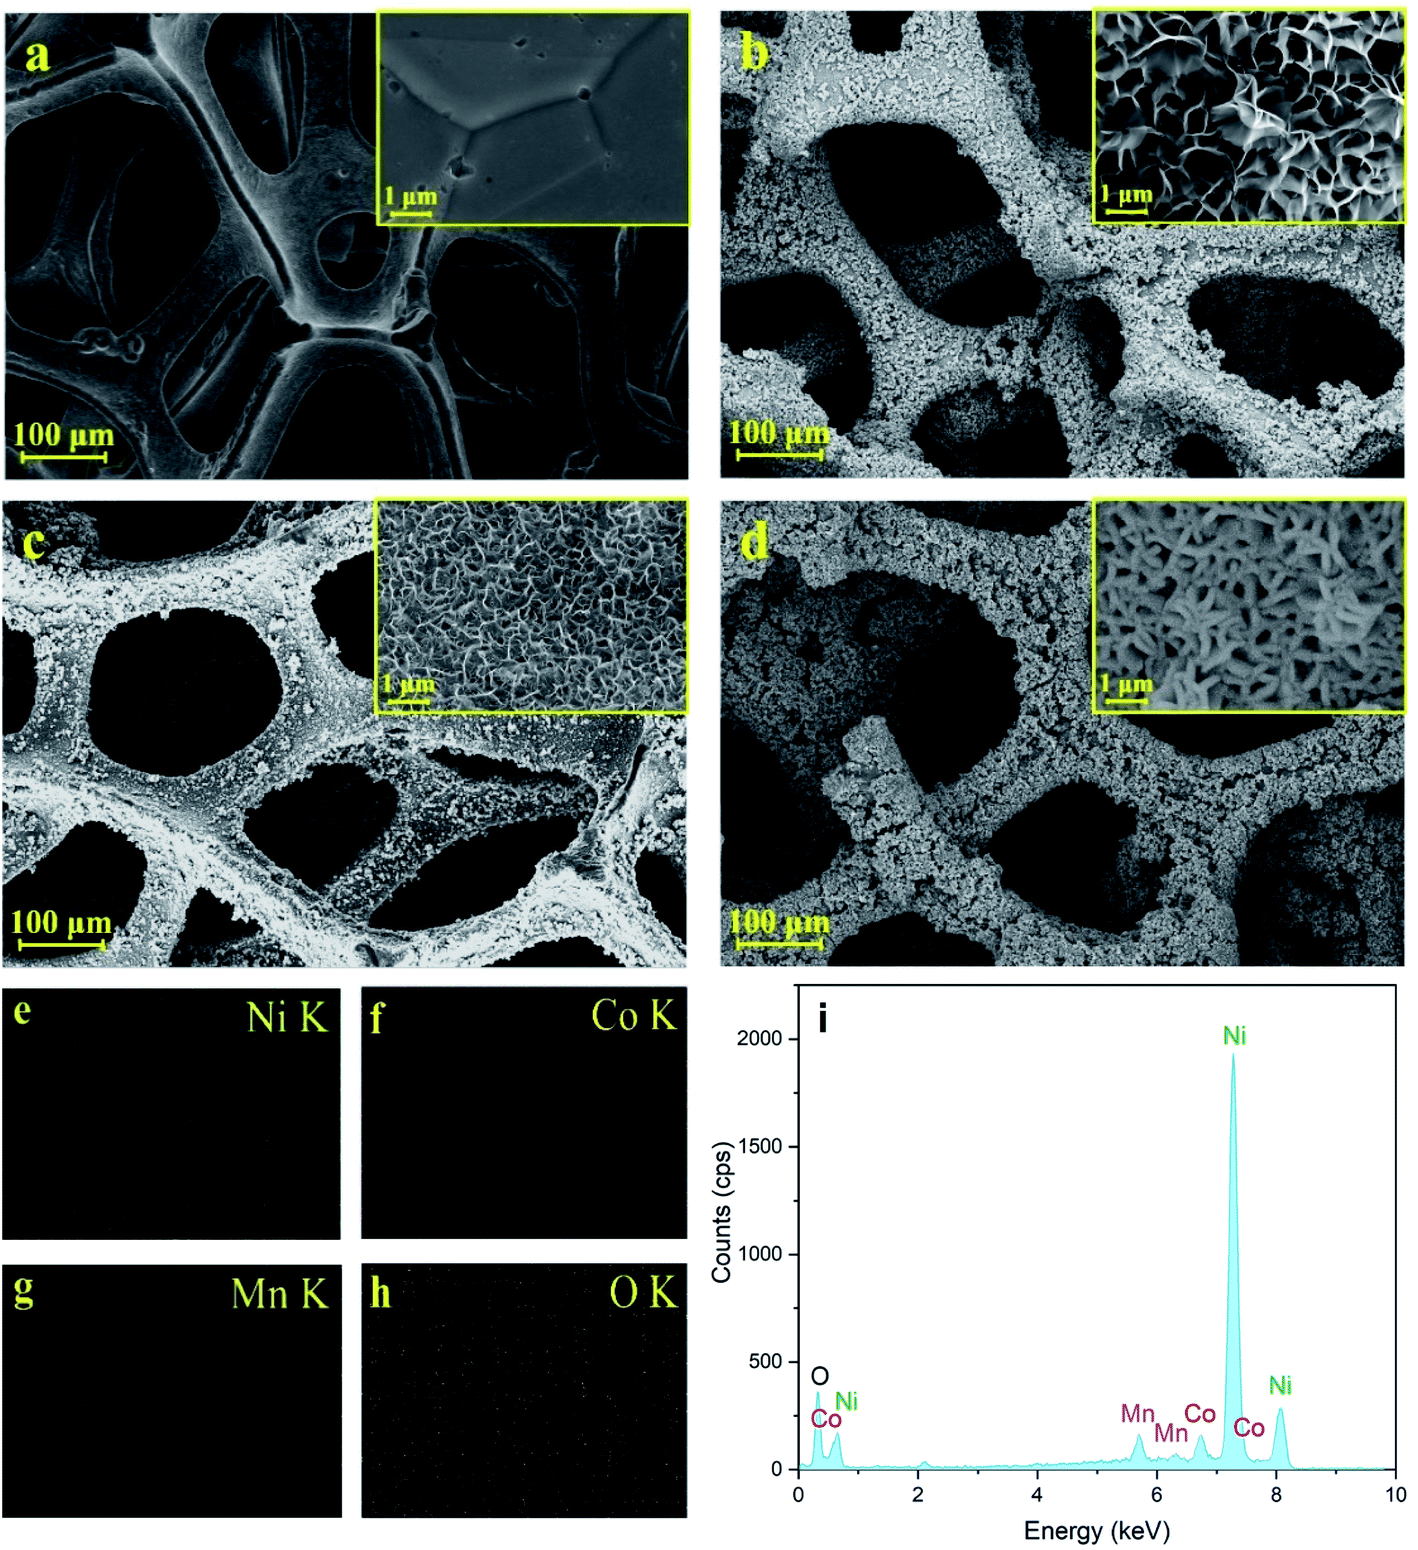 | ||
| Fig. 2 SEM images of (a) NF, (b) NiO/NF, (c) Ni–Co–Mn–Ox/NF and (d) NiO/Ni–Co–Mn–Ox/NF. (e–h) Elemental distribution mappings and (i) EDS spectra of NiO/Ni–Co–Mn–Ox. | ||
As shown in Fig. 2(a), NF substrate has a grid structure and a relatively smooth surface. Fig. 2(b–d) shows that NiO, Ni–Co–Mn–Ox and NiO/Ni–Co–Mn–Ox deposits are formed both on the outside and inside of NF substrates. Thus, some regular grid micropores exist on the surface and also inside of these deposits. More specifically, such deposits form a porous sheet–sheet hierarchical composite structure. After chemical-bath deposition of 30–40 min and calcination of 2.5 h at 350 °C, these micropores are still not filled completely by NiO or Ni–Co–Mn–Ox deposits. This porous sheet–sheet hierarchical composite structure can help to eliminate the internal stress generated in the crystals. It can also promote the formation of an embedded structure, strengthening the junction between the prepared deposits and NF substrates. Fig. 2(e–i) shows that elements such as Ni, Co, Mn and O are present and distributed uniformly over the surface of the deposits with an unknown phase structure.
To avoid the influence of NF substrates on phase structures, the prepared NiO, Ni–Co–Mn–Ox and NiO/Ni–Co–Mn–Ox deposits were stripped from the substrate surface after calcination. Thereafter, the samples were measured by XRD and XPS. The results are shown in Fig. 3.
 | ||
| Fig. 3 (a) XRD patterns of NiO, Ni–Co–Mn–Ox and NiO/Ni–Co–Mn–Ox deposits; XPS spectrum of Ni–Co–Mn–Ox deposit with (b) Ni 2p, (c) Co 2p and (d) Mn 2p. | ||
It can be seen from Fig. 3(a) that the main diffraction peaks of NiO appear at 37.2°, 43.3°, 62.4°, 75.4° and 79.4°, and their corresponding diffraction crystal planes are (101), (012), (110), (113) and (202) in accordance with the standard card (JCPDS no. 44-1159). For Ni–Co–Mn–Ox deposit, there are diffraction peaks of Co3O4 at 19.0°, 31.2°, 36.9°, 59.3° and 65.2° except those of NiO at 43.3° and 62.4°, and their corresponding diffraction crystal planes are (111), (220), (311), (511), and (440) in accordance with the standard card (JCPDS no. 43-1003). It is also clear from NiO/Ni–Co–Mn–Ox deposit that the diffraction peaks of NiO and Co3O4 are similar to those of Ni–Co–Mn–Ox deposit. However, the diffraction peak of NiO is obviously strengthened at 43.3°, indicating that the growth rate of NiO in the Ni–Co–Mn–Ox precursor is faster than that in the NiOOH precursor. Additionally, the peak characteristic of manganese oxide is not observed, which may be due to its low content.
To further verify the chemical structure and composition of elements Ni, Co, Mn and O, X-ray photoelectron spectroscopy (XPS) was employed and the results are shown in Fig. 3(b–d). As shown in Fig. 3(b), the peaks at 854.09 eV and 871.58 eV are attributed to Ni 2p3/2 and Ni 2p1/2 separated from in the Ni 2p region. It also can be seen from Fig. 3(b) that the difference value of the binding energy between Ni 2p3/2 edge and Ni 2p1/2 is 17.49 eV, suggesting the existence of NiO. Meanwhile, the peaks at 856.01 eV and 873.57 eV correspond to the binding energy of Ni3+. According to the results in Fig. 3(a) and 4(f), it can be seen that the characteristic peaks and diffraction rings of Ni2O3 were not observed. Therefore, it can be concluded that Ni2O3 may exist only in trace amounts in the Ni–Co–Mn–Ox deposit. Co 2p spectra in Fig. 3(c) shows that the peaks at 780.33 eV (Co 2p3/2) and 795.53 eV (Co 2p1/2) are observed, demonstrating that Co3O4 has been obtained from CoOOH precursor. Mn 2p spectra in Fig. 3(d) presents the peaks at 641.85 eV (Mn 2p3/2) and 653.53 eV (Mn 2p1/2) are obvious, and the difference value of their binding energy is 11.68 eV, which is consistent with MnO2.41,42
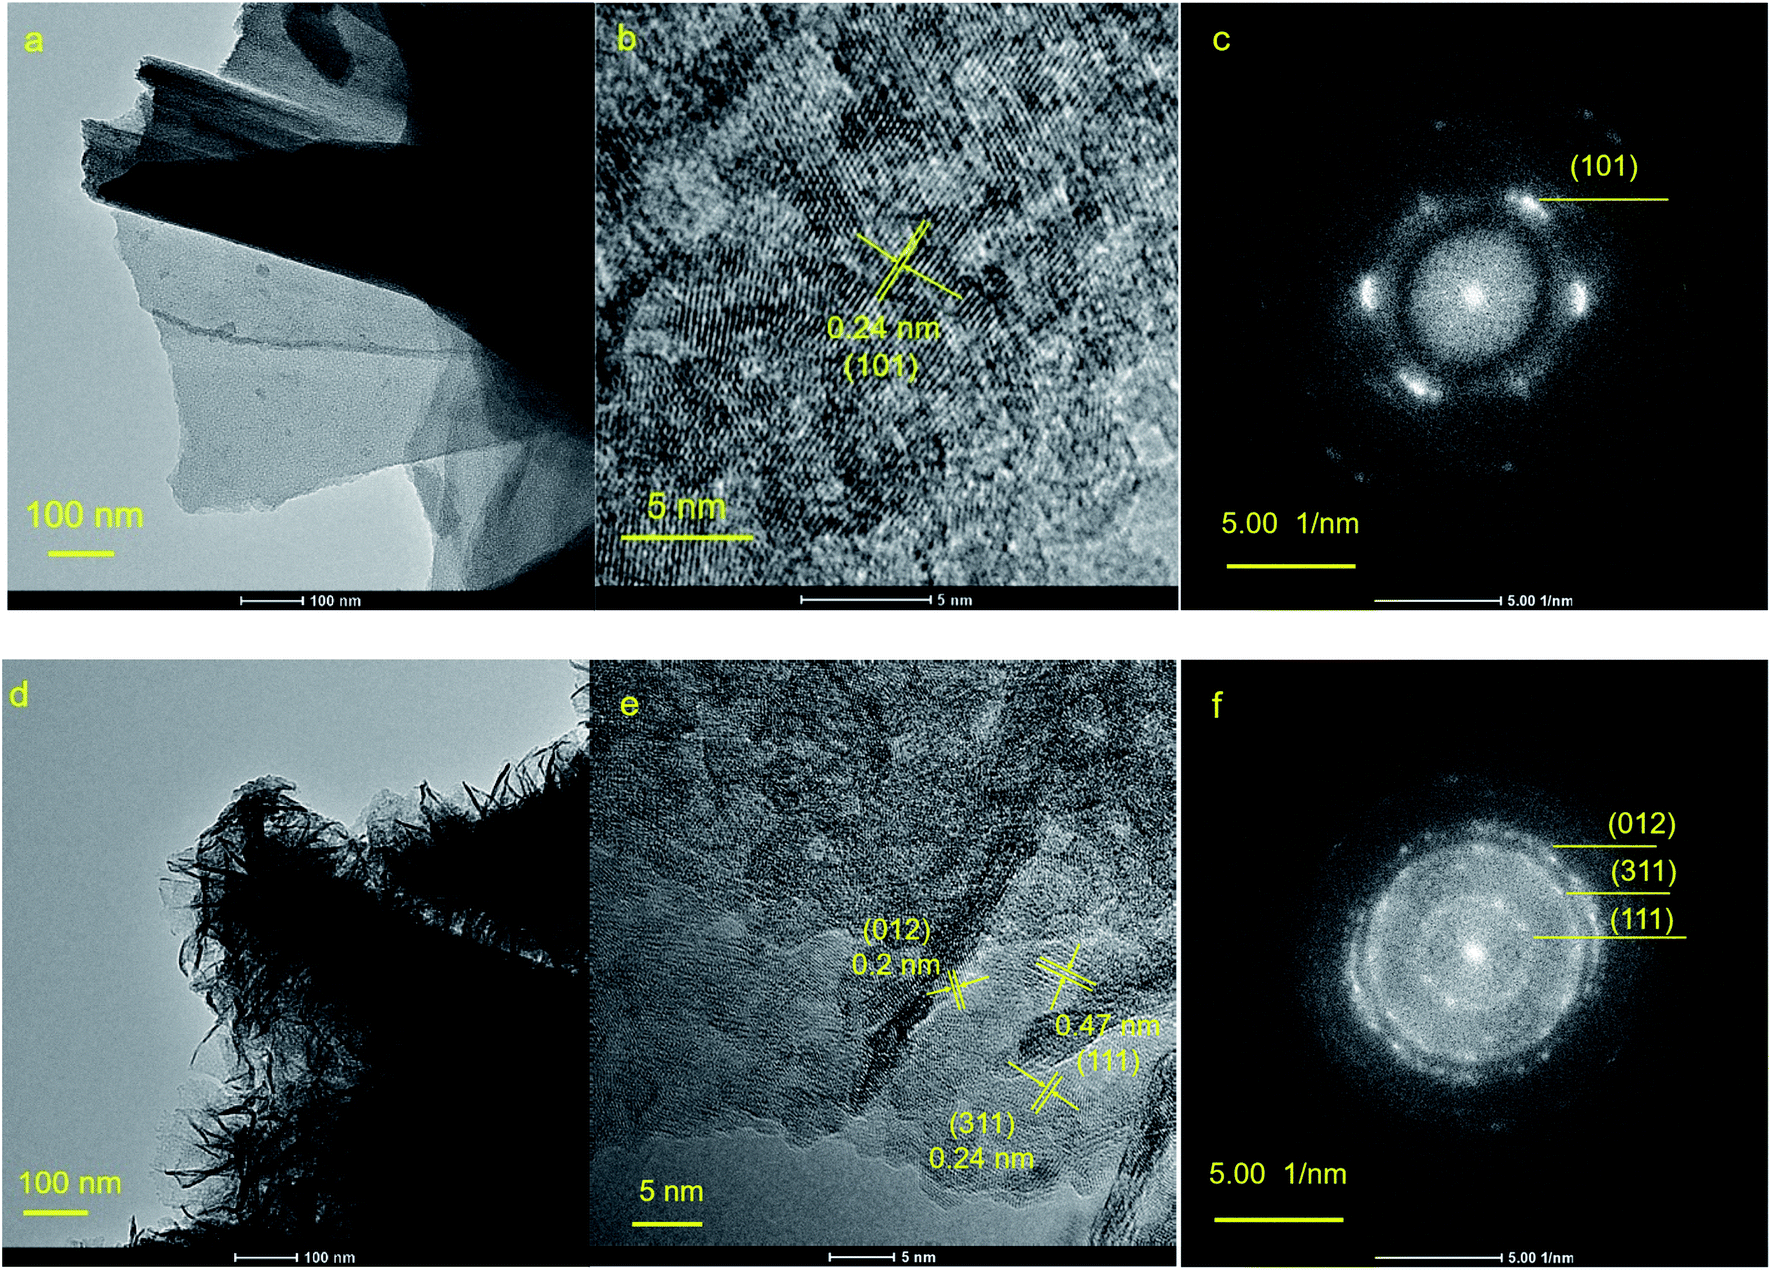 | ||
| Fig. 4 (a) Low magnification TEM image, (b) HRTEM image and (c) SAED image of NiO; (d) low magnification TEM image, (e) HRTEM image and (f) SAED image of NiO/Ni–Co–Mn–Ox. | ||
TEM images of NiO and NiO/Ni–Co–Mn–Ox deposits are shown in Fig. 4. Fig. 4(a) and (d) are low magnification TEM images of NiO and NiO/Ni–Co–Mn–Ox deposits, which shows that a porous sheet–sheet hierarchical nanostructure has been obtained and Ni–Co–Mn–Ox deposit can form on the surface of NiO deposit. The HRTEM image of NiO in Fig. 4(b) shows well-defined lattice fringes with a lattice spacing of ∼0.24 nm corresponding to (101) crystal plane of NiO. In HRTEM image of NiO/Ni–Co–Mn–Ox in Fig. 4(e), it is obvious that a distinct set of the lattice fringes with a lattice spacing of ∼0.20 nm are indexed to (012) crystal planes of NiO, and those of ∼0.24 nm are indexed to (311) crystal planes of Co3O4. In addition, there are also lattice fringes with a lattice spacing of ∼0.47 nm corresponding to (111) crystal planes of MnO2. The selected-area electron diffraction (SAED) patterns in Fig. 4(c) and (f) show that NiO and NiO/Ni–Co–Mn–Ox nanoflakes have a polycrystalline structure. The diffraction rings on (101) and (012) crystal planes indicate NiO phase and the diffraction rings on (311) and (111) crystal planes indicate the Co3O4 phase and MnO2 phase, respectively.43,44 Therefore, above results show that NiO, Co3O4, and MnO2 have been obtained successfully via a chemical bath deposition–calcination method, and NiO/Ni–Co–Mn–Ox deposit is a porous sheet–sheet hierarchical nanostructure consisting of NiO, Co3O4 and MnO2 mixed phases.
3.2 Thermogravimetric/differential thermal analysis
To avoid the influence of NF substrate on the thermal analysis of the deposits, NiOOH precursors or Ni–Co–Mn hydroxide precursors were stripped from the surface of NF substrates for calcination. Thereafter, TG/DTA was carried out from room temperature to 450 °C. During the course of calcination, the growth rate of crystals was accelerated with increase of heating rate, leading to instability of the growing structure and the weakening of its properties. Therefore, the heating rate for NiOOH precursors was controlled at 10 °C min−1 and that of Ni–Co–Mn–Ox precursors was controlled at 2 °C min−1.The TG/DTA curves of NiOOH precursors adn Ni–Co–Mn hydroxide precursors are shown in Fig. 5.
 | ||
| Fig. 5 TG/DTA curves of (a) NiOOH precursors and (b) Ni–Co–Mn hydroxide precursors stripped from the surface of NF substrates. | ||
As can be seen from Fig. 5(a), when heating temperature rises from 100 °C to 190 °C, NiOOH precursors exhibit a first weight loss (accompanied by a −9.62% mass change). This is mainly caused by volatilization of the physical–chemical bond water in the precursors. Moreover, the value of the endothermic peak is the largest when the sample is heated at 123.3 °C, indicating that the volatilization rate is the fastest. Thereafter, when heating temperature rises from 190 °C to 450 °C, NiOOH precursors exhibit a second weight loss (mass change of −13.71%). The highest endothermic peak occurs at 328.4 °C, indicating that NiOOH precursors have been decomposed to NiO and its decomposition rate is the fastest.
As can be seen from Fig. 5(b), when heating temperature rises from 100 °C to 160 °C, Ni–Co–Mn hydroxide precursors exhibit a first weight loss (−11.73% mass change). The highest endothermic peak occurs at 125.4 °C, which is also mainly caused by the volatilization of physical–chemical bond water in the precursors. When heating temperature rises from 160 °C to 310 °C, Ni–Co–Mn hydroxide precursors exhibit a second weight loss (−11.98% mass change). The highest endothermic peak occurs at 282.7 °C, indicating that CoOOH precursors have been decomposed to Co3O4 and the formation rate of Co3O4 is the fastest. When heating temperature rises from 310 °C to 370 °C, a third weight loss (−7.88% mass change) occurs, and the highest endothermic peak appears at 353.6 °C, which indicates that NiOOH precursors have been decomposed to NiO and the formation rate of NiO is fastest at 353.6 °C. Moreover, compared with pure NiOOH precursors, the decomposition temperature required for Ni–Co–Mn hydroxide precursors is higher. Thereafter, when heating temperature rises sequentially from 370 °C to 400 °C, there occurs a trace amount of mass loss and a very small endothermic peak at 390 °C, which is caused by the decomposing of MnOOH precursors to MnO2.
3.3 Electrochemical performance
To study the electrochemical performance of NiO/NF, Ni–Co–Mn–Ox/NF and NiO/Ni–Co–Mn–Ox/NF, their CV, EIS and GCD curves were measured, and specific capacity and cycling stability were obtained. The CV curves of NiO/NF, Ni–Co–Mn–Ox/NF and NiO/Ni–Co–Mn–Ox/NF are shown in Fig. 6(a), and the CV curves of NiO/Ni–Co–Mn–Ox/NF at different scan rates are shown in Fig. 6(b). | ||
| Fig. 6 (a) CV curves of NiO/NF, Ni–Co–Mn–Ox/NF and NiO/Ni–Co–Mn–Ox/NF at a scan rate 10 mV s−1, (b) CV curves of NiO/Ni–Co–Mn–Ox/NF at different scan rates. | ||
As shown in Fig. 6(a), a pair of redox peaks appear on the CV curves of NiO/NF, Ni–Co–Mn–Ox/NF and NiO/Ni–Co–Mn–Ox/NF. Different from the rectangular curve of the general electric double-layer capacitor, these redox peaks show obvious battery characteristics, indicating that the following faradaic reactions have occurred:45–48
NiO + OH− ![[left over right harpoons]](https://www.rsc.org/images/entities/char_21cb.gif) NiOOH + e− NiOOH + e−
| (2) |
|
Co3O4 + OH− + H2O 3CoOOH + e−
| (3) |
|
CoOOH + OH− CoO2 + H2O + e−
| (4) |
|
MnO2 + H+ + e− MnOOH
| (5) |
|
MnO2 + K+ + e− MnOOK
| (6) |
Generally, the area enclosed by CV curves is related to specific capacity.49 It can be seen from Fig. 6(a) that the enclosed area of NiO/Ni–Co–Mn–Ox/NF is the largest among the three kinds of materials, indicating that its specific capacity is also the highest.
As shown in Fig. 6(b), there are also faradaic reactions for NiO/Ni–Co–Mn–Ox/NF at different scan rates, which displays excellent redox reversibility. Typically, the redox peak current increases with the rise of scanning rate from 5 mV s−1 to 100 mV s−1, while the oxidation and reduction potentials move to higher and lower potential directions respectively due to polarization effects at high scanning rate. The increase of scanning rate affects the diffusion rate of OH− in 2 M KOH, leading to a decrease in the utilization of active substances, which is not good for redox reactions.48
GCD curves of NiO/NF, Ni–Co–Mn–Ox/NF and NiO/Ni–Co–Mn–Ox/NF at a current density of 2 A g−1 are shown in Fig. 7(a). The GCD curves of NiO/Ni–Co–Mn–Ox/NF at different current densities are shown in Fig. 7(b) and its specific capacity is shown in Fig. 7(c).
 | ||
| Fig. 7 (a) GCD curves of NiO/NF, Ni–Co–Mn–Ox/NF and NiO/Ni–Co–Mn–Ox/NF at a current density of 2 A g−1 (b) GCD curves and (c) specific capacity of NiO/Ni–Co–Mn–Ox/NF at different current densities. (d) Nyquist plots of NiO/NF, Ni–Co–Mn–Ox/NF and NiO/Ni–Co–Mn–Ox/NF at a current density of 5 A g−1. | ||
Fig. 7(a) shows that GCD curves have obvious nonlinear characteristics accompanied by redox reactions, indicating that a specific capacity is generated by faradaic reactions rather than an electrical double layer. Moreover, the change of redox peaks can be observed by means of voltage platforms. According to formula (1), the specific capacity of NiO/NF, Ni–Co–Mn–Ox/NF and NiO/Ni–Co–Mn–Ox/NF at a current density of 2 A g−1 was calculated and the results are 413.44 C g−1, 740.06 C g−1, and 978.56 C g−1, respectively. The specific capacity of NiO/Ni–Co–Mn–Ox/NF is obviously greater than that of the other two materials, the main reason is that NiO/Ni–Co–Mn–Ox/NF has a porous sheet–sheet hierarchical nanostructure and the synergistic effect between NiO and Ni–Co–Mn–Ox, leading to an enhancement of its specific capacity.
Fig. 7(b) and (c) show that the specific capacity of NiO/Ni–Co–Mn–Ox/NF is 1023.50 C g−1, 978.56 C g−1, 934.62 C g−1, 905 C g−1 and 855 C g−1 at the current density of 1 A g−1, 2 A g−1, 3 A g−1, 5 A g−1 and 10 A g−1, respectively. Typically, the specific capacity tends to decrease with increasing the current density (Fig. 7(c)), the reason is that at high current density, the diffusion rate of OH− is decreased in 2 M KOH, leading to increase in the ionic diffusion and migration resistance, so that the faradaic reactions cannot be conducted adequately by the active substances.
The alternating current impedance reflects the ion or charge transfer property of the prepared samples; Nyquist plots of NiO/NF, Ni–Co–Mn–Ox/NF and NiO/Ni–Co–Mn–Ox/NF are shown in Fig. 7(d). These impedance plots consist of a semicircle in the high-frequency region and a line in the low-frequency region. Internal resistance (Rs), including ionic resistance of the electrolyte, intrinsic resistance of the prepared samples, and contact resistance between the prepared deposit and the NF foam substrate are considered the reasons for the intersection of the semicircle with X axis.50 The diameter of the semicircle represents the charge transfer resistance (Rct) in the redox reaction, which is related to the electrical conductivity of the prepared sample. The linear curve represents the Warburg resistance (Zw) caused by the diffusion and transport of ions inside the electrode.
According to equivalent circuit model shown in the inset of Fig. 7(d), fitting analysis shows that Rs values of NiO/NF, Ni–Co–Mn–Ox/NF and NiO/Ni–Co–Mn–Ox/NF are 0.22 Ω, 0.16 Ω, and 0.19 Ω, respectively. Moreover, Rct value of NiO/Ni–Co–Mn–Ox/NF is 0.20 Ω, which is between the values of 0.26 Ω for NiO/NF and 0.16 Ω for Ni–Co–Mn–Ox/NF. Additionally, the regions of Zw for Ni–Co–Mn–Ox/NF and NiO/Ni–Co–Mn–Ox/NF are shorter than that for NiO/NF, indicating that compared to NiO/NF and Ni–Co–Mn–Ox/NF, NiO/Ni–Co–Mn–Ox/NF has a better ion diffusion or charge transfer rate in 2 M KOH.51
The capacitance retention is calculated by the ratio of the capacity of N charge–discharge cycles to the capacity of the first charge–discharge cycle. Namely, RC = CN/C1 × 100%. Where, CN is the capacity of N charge and discharge cycles, and N = 50, 100, 150,…, 3000. C1 is the capacity of the first charge and discharge cycle. At a current density of 5 A g−1, the cycling performances of NiO/NF, Ni–Co–Mn–Ox/NF and NiO/Ni–Co–Mn–Ox/NF were measured after 3000 charge–discharge cycles in 2 M KOH, as shown in Fig. 8. It is obvious that with the increase of cycle numbers, the specific capacity of NiO/NF, Ni–Co–Mn–Ox/NF and NiO/Ni–Co–Mn–Ox/NF first increases and then decreases. The main reason is at the early stage of charge–discharge cycles, the prepared sample surface is not fully activated due to insufficient contact with the KOH electrolyte. After several charge–discharge cycles, the activation degree of the prepared sample surface reaches the maximum, thereby generating the highest specific capacity. Later, the structure of the prepared sample is destroyed and the active substances fall from the surface, causing its specific capacity decrease due to the high-frequency migration of ions at the interface between the prepared sample surface and the electrolyte.
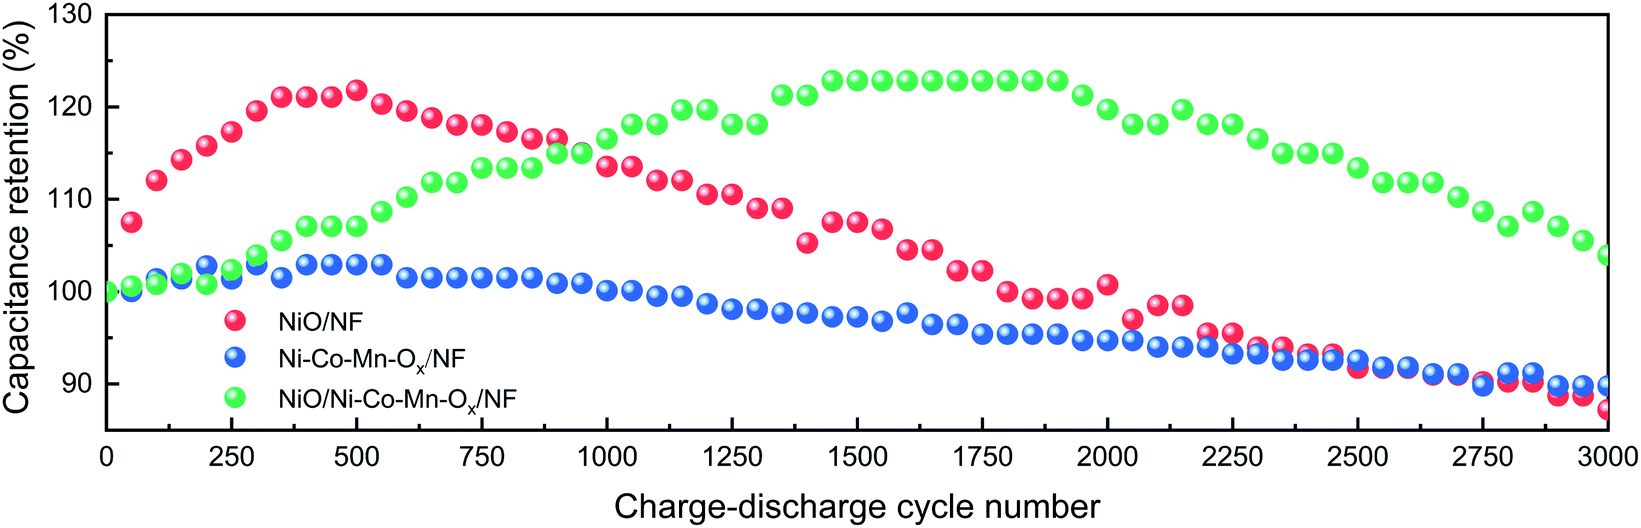 | ||
| Fig. 8 Cycling performances of NiO/NF, Ni–Co–Mn–Ox/NF and NiO/Ni–Co–Mn–Ox/NF at a current density of 5 A g−1. | ||
Fig. 8 shows that compared with NiO/NF and Ni–Co–Mn–Ox/NF, NiO/Ni–Co–Mn–Ox/NF needs more charge–discharge cycles to achieve the highest specific capacity, the main reason is that its porous sheet–sheet hierarchical nanostructure is a complex spatial structure and more charge–discharge cycles are required to achieve full activation. Similarly, such a composite spatial structure also improves its cycling stability. For example, the capacitance retention for NiO/Ni–Co–Mn–Ox/NF is 122.85% after 1550–1950 cycles and 103.94% after 3000 cycles in 2 M KOH. In contrast, those for NiO/NF and Ni–Co–Mn–Ox/NF are only 87.22% and 89.79%, respectively, after 3000 cycles.
The specific capacity and capacitance retention of some transition metal oxides are listed in Table 1.
| Material | Method | Specific capacity | Capacitance retention (cycles) | Reference |
|---|---|---|---|---|
| Ni–Co–Mn oxide (nanoflake) | Microwave irradiation | 1151 F g−1 | 106.5% (5000) | 52 |
| Ni–Co–Mn oxide (nanosheet) | Chemical bath deposition | 715.1 C g−1 | 94.5% (6000) | 34 |
| Co3O4–MnO2–NiO (nanotube) | Electrodeposition | 2020 C g−1 | 80% (5700) | 35 |
| MnO2/Ni–Co–Mn oxide (nanorod@nanoflake) | Hydrothermal | 675 F g−1 | 83% (3000) | 53 |
| NiO/Co3O4/MnO2 (double-shelled tremella-like) | Hydrothermal | 792.5 F g−1 | 91.3% (1000) | 54 |
| NiCo2O4/MnO2 (nanosheet) | Electrodeposition | 913.6 F g−1 | 87.1% (3000) | 55 |
| MnO2/NiCo2O4 (core/shell nanospheres) | Microemulsion | 1127.27 F g−1 | 96.3% (10![[thin space (1/6-em)]](https://www.rsc.org/images/entities/char_2009.gif) 000) 000) |
56 |
| NiO/Ni–Co–Mn–Ox/NF (porous sheet–sheet hierarchical structure) | Chemical bath deposition | 1023.50 C g−1 | 103.94% (3000) | This work |
It can be seen from Table 1 that Ni–Co–Mn oxides (nanoflake/nanosheet) prepared by microwave irradiation or chemical bath deposition deliver specific capacity with 1151 F g−1 or 715.1 C g−1, and their corresponding capacitance retention is 106.5% after 5000 cycles or 94.5% after 6000 cycles. Typically, Co3O4–MnO2–NiO nanotube prepared by electrodeposition have the highest specific capacity with 2020 C g−1, while its capacitance retention is only 80% after 5700 cycles. For MnO2/Ni–Co–Mn oxide (nanorod@nanoflake) or NiO/Co3O4/MnO2 (double-shelled, tremella-like) prepared by the hydrothermal method, their specific capacities with 675 F g−1 and 792.5 F g−1 are both lower, and the corresponding capacitance retention with 83% after 3000 cycles and 91.3% after 1000 cycles are also worse. In addition, NiCo2O4/MnO2 nanosheets prepared by electrodeposition deliver lower specific capacity with 913.6 F g−1 and capacitance retention with 87.1% after 3000 cycles. MnO2/NiCo2O4 core/shell nanospheres prepared by the microemulsion method has better capacitance retention with 96.3% after 10000 cycles and specific capacity with 1127.27 F g−1.
In this research, the prepared NiO/Ni–Co–Mn–Ox/NF delivers a higher specific capacity with 1023.50 C g−1 at a current density of 1 A g−1 and excellent capacitance retention with 103.94% at 5 A g−1 after 3000 cycles in 2 M KOH, indicating an outstanding electrochemical performance for high-performance supercapacitors. The mechanism for enhancing the electrochemical performance is as follows: transition metal oxides such as NiO, Co3O4, and MnO2 are all pseudo-capacitive materials with high theoretical specific capacity (2573 F g−1, 3560 F g−1, and 1380 F g−1, respectively), this appears to indicate that a relatively high specific capacity is exhibited due to synergistic effects when these constituents are combined. Meantime, NF substrate is porous and NiO/Ni–Co–Mn–Ox deposit also has a special porous sheet–sheet hierarchical nanostructure, such structure greatly shortens the diffusion channels of current carrier in KOH solution, which is good for electrochemical activity. Additionally, the excellent redox reversibility and obvious faradaic battery characteristics of NiO/Ni–Co–Mn–Ox promotes faradaic reactions between NiO, Co3O4 and OH− or MnO2, H+ and K+ in 2 M KOH, enhancing its electrochemical performance.
4. Summary
NiO, Ni–Co–Mn–Ox, and NiO/Ni–Co–Mn–Ox on NF substrates have been prepared using a chemical-bath deposition–calcination. Firstly, precursors such as NiOOH, CoOOH, and MnOOH grow on NF substrates from a homogeneously mixed solution via chemical-bath deposition. Thereafter, these precursors were calcined and decomposed to NiO, Co3O4, and MnO2, respectively at different temperatures in a muffle furnace. Among these three materials, NiO/Ni–Co–Mn–Ox/NF exhibits a higher specific capacity with 1023.50 C g−1 at 1 A g−1 and excellent capacitance retention with 103.94% at 5 A g−1 after 3000 cycles in 2 M KOH, which is mainly attributed to a porous sheet–sheet hierarchical nanostructure, synergistic effects of pseudo-capacitive materials and excellent redox reversibility. The prepared samples may be an ideal electrode material for high-performance supercapacitors.Conflicts of interest
There are no conflicts to declare.Acknowledgements
The authors gratefully acknowledge the financial support of the National Natural Science Foundation of China (Project No. 51874154), the Key Project of Yunnan Province Science and Technology Plan of China (Project No. 2014FA024), the Specialized Research Fund for the Doctoral Program of the Ministry of Education of China (Project No. 20125314110011), and the Analysis and Measurement Fund (2018M20172102028) of Kunming University of Science and Technology.References
- S. Zheng, X. Li, B. Yan, Q. Hu, Y. Xu, X. Xiao, H. Xue and H. Pang, Adv. Energy Mater., 2017, 7, 1602733 CrossRef.
- M. Conte, Fuel Cells, 2010, 10, 806–818 CrossRef CAS.
- J. Cherusseri, N. Choudhary, K. S. Kumar, Y. Jung and J. Thomas, Nanoscale Horiz., 2019, 4, 840–858 RSC.
- A. L. Brisse, P. Stevens, G. Toussaint, O. Crosnier and T. Brousse, Materials, 2018, 11, 1178 CrossRef PubMed.
- S. Sahoo, R. Mondal, D. J. Late and C. S. Rout, Microporous Mesoporous Mater., 2017, 244, 101–108 CrossRef CAS.
- Z. Yang, J. Tian, Z. Yin, C. Cui, W. Qian and F. Wei, Carbon, 2019, 141, 467–480 CrossRef CAS.
- R. Dubey and V. Guruviah, Ionics, 2019, 25, 1419–1445 CrossRef CAS.
- R. Lei, H. Ni, R. Chen, H. Gu and B. Zhang, Electrochem. Commun., 2018, 93, 20–24 CrossRef CAS.
- R. Lei, H. Ni, R. Chen, H. Gu, H. Zhang and S. Dong, J. Colloid Interface Sci., 2018, 532, 622–629 CrossRef CAS PubMed.
- L. Huang, D. Santiago, P. Loyselle and L. Dai, Small, 2018, 14, 1800879 CrossRef PubMed.
- S. Wang, N. Liu, J. Su, L. Li, F. Long, Z. Zou, X. Jiang and Y. Gao, ACS Nano, 2017, 11, 2066–2074 CrossRef CAS PubMed.
- T. Nguyen, M. Boudard, M. J. Carmezim and M. F. Montemor, Sci. Rep., 2017, 7, 39980 CrossRef CAS PubMed.
- X. Yu, S. Yun, J. S. Yeon, P. Bhattacharya, L. Wang, S. W. Lee, X. Hu and H. S. Park, Adv. Energy Mater., 2018, 8, 1702930 CrossRef.
- R. S. Kate, S. A. Khalate and R. J. Deokate, J. Alloys Compd., 2018, 734, 89–111 CrossRef CAS.
- Z. Wang, Y. Long, D. Cao, D. Han and F. Gu, Electrochim. Acta, 2019, 307, 341–350 CrossRef CAS.
- W. Hong and L. Lin, J. Power Sources, 2019, 435, 226797 CrossRef CAS.
- Z. Huang, Z. Zhang, X. Qi, X. Ren, G. Xu, P. Wan, X. Sun and H. Zhang, Nanoscale, 2016, 8, 13273–13279 RSC.
- R. Lei, H. Zhang, W. Lei, D. Li, Q. Fang, H. Ni and H. Gu, Mater. Lett., 2019, 249, 140–142 CrossRef CAS.
- M. Govindasamy, S. Shanthi, E. Elaiyappillai, S. F. Wang, P. M. Johnson, H. Ikeda, Y. Hayakawa, S. Ponnusamy and C. Muthamizhchelvan, Electrochim. Acta, 2019, 293, 328–337 CrossRef CAS.
- W. He, Z. Liang, K. Ji, Q. Sun, T. Zhai and X. Xu, Nano Res., 2018, 11, 1415–1425 CrossRef CAS.
- X. Li, A. M. Elshahawy, C. Guan and J. Wang, Small, 2017, 13, 1701530 CrossRef PubMed.
- S. Liu, K. V. Sankar, A. Kundu, M. Ma, J.-Y. Kwon and S. C. Jun, ACS Appl. Mater. Interfaces, 2017, 9, 21829–21838 CrossRef CAS PubMed.
- J. Sun, Y. Huang, C. Fu, Z. Wang, Y. Huang, M. Zhu, C. Zhi and H. Hu, Nano Energy, 2016, 27, 230–237 CrossRef CAS.
- G. Cai, P. Darmawan, M. Cui, J. Wang, J. Chen, S. Magdassi and P. S. Lee, Adv. Energy Mater., 2016, 6, 1501882 CrossRef.
- Z. Yang, J. Ma, B. Bai, A. Qiu, D. Losic, D. Shi and M. Chen, Electrochim. Acta, 2019, 322, 134759 CrossRef.
- P. Nakhanivej, X. Yu, S. K. Park, S. Kim, J. Y. Hong, H. J. Kim, W. Lee, J. Y. Hwang, J. E. Yang, C. Wolverton, J. Kong, M. Chhowalla and H. S. Park, Nat. Mater., 2019, 18, 156–162 CrossRef CAS PubMed.
- X. Liu, C. Guan, Y. Hu, L. Zhang, A. M. Elshahawy and J. Wang, Small, 2018, 14, 1702641 CrossRef PubMed.
- W. Yuan, L. Cheng, H. Wu, Y. Zhang, S. Lv and X. Guo, Chem. Commun., 2018, 54, 2755–2758 RSC.
- P. Asen, S. Shahrokhian and A. I. zad, J. Electroanal. Chem., 2018, 823, 505–516 CrossRef CAS.
- N. Ahmed, B. A. Ali, M. Ramadan and N. K. Allam, ACS Appl. Energy Mater., 2019, 2, 3717–3725 CrossRef CAS.
- D. R. Kumar, K. R. Prakasha, A. S. Prakash and J.-J. Shim, J. Alloys Compd., 2020, 836, 155370 CrossRef CAS.
- R. B. Waghmode and A. P. Torane, J. Mater. Sci.: Mater. Electron., 2016, 27, 6133–6139 CrossRef CAS.
- X. Zheng, X. Han, X. Zhao, J. Qi, Q. Ma, K. Tao and L. Han, Mater. Res. Bull., 2018, 106, 243–249 CrossRef CAS.
- S. Chen, G. Yang and H. Zheng, Electrochim. Acta, 2016, 220, 296–303 CrossRef CAS.
- A. K. Singh, D. Sarkar, K. Karmakar, K. Mandal and G. G. Khan, ACS Appl. Mater. Interfaces, 2016, 8, 20786–20792 CrossRef CAS PubMed.
- X. H. Xia, J. P. Tu, J. Zhang, X. L. Wang, W. K. Zhang and H. Huang, Sol. Energy Mater. Sol. Cells, 2008, 92, 628–633 CrossRef CAS.
- D. Chen, F. Giroud and S. D. Minteer, J. Electrochem. Soc., 2014, 161, F933–F939 CrossRef CAS.
- M. Figlarz, J. Guenot and F. Fievet-Vincent, J. Mater. Sci., 1976, 11, 2267–2270 CrossRef CAS.
- S. Vijayakumar, S. Nagamuthu and K.-S. Ryu, Electrochim. Acta, 2017, 238, 99–106 CrossRef CAS.
- Y. Zhu, Q. Zong, Q. Zhang, H. Yang, W. Du, Q. Wang, J. Zhang and H. Wang, Electrochim. Acta, 2020, 334, 135589 CrossRef CAS.
- X. Feng, Y. Huang, C. Li, Y. Xiao, X. Chen, X. Gao and C. Chen, Electrochim. Acta, 2019, 308, 142–149 CrossRef CAS.
- V. H. Nguyen, V. C. Tran, D. Kharismadewi and J.-J. Shim, Mater. Lett., 2015, 147, 123–127 CrossRef CAS.
- P. Jiang, Q. Wang, J. Dai, W. Li and Z. Wei, Mater. Lett., 2017, 188, 69–72 CrossRef CAS.
- C. Xiong, T. Li, A. Dang, T. Zhao, H. Li and H. Lv, J. Power Sources, 2016, 306, 602–610 CrossRef CAS.
- K. Ma, F. Liu, M. Zhang, X. Zhang and J. P. Cheng, Electrochim. Acta, 2017, 225, 425–434 CrossRef CAS.
- C. Yuan, X. Zhang, L. Su, B. Gao and L. Shen, J. Mater. Chem., 2009, 19, 5772–5777 RSC.
- I. G. Casella and M. Gatta, J. Electroanal. Chem., 2002, 534, 31–38 CrossRef CAS.
- X. Liu, G. Chen, H. Guan, C. Dong, X. Xiao and Y. Wang, Electrochim. Acta, 2016, 189, 83–92 CrossRef CAS.
- X. Lu, M. Yu, G. Wang, T. Zhai, S. Xie, Y. Ling, Y. Tong and Y. Li, Adv. Mater., 2013, 25, 267–272 CrossRef CAS PubMed.
- Y. Yuan, J. Lin, D. Zhang, S. Yin, Y. Zhao, J. Yang, Y. Chen and S. Y. Guo, Electrochim. Acta, 2017, 227, 303–309 CrossRef CAS.
- P. Birke, F. Salam, S. Döring and W. Weppner, Solid State Ionics, 1999, 118, 149–157 CrossRef CAS.
- C. Lamiel, V. H. Nguyen, D. R. Kumar and J.-J. Shim, Chem. Eng. J., 2017, 316, 1091–1102 CrossRef CAS.
- H. Wang, Q. Zhao, X. Wang, Y. Zhang, J. Gao, Y. Fu, X. Yang and H. Shu, RSC Adv., 2014, 4, 42910–42916 RSC.
- H. Wang, Q. Ren, D. J. L. Brett, G. He, R. Wang, J. Key and S. Ji, J. Power Sources, 2017, 343, 76–82 CrossRef CAS.
- Y. Zhang, B. Wang, F. Liu, J. Cheng, X.-W. Zhang and L. Zhang, Nano Energy, 2016, 27, 627–637 CrossRef CAS.
- Y. Zhou, L. Ma, M. Gan, M. Ye, X. Li, Y. Zhai, F. Yan and F. Cao, Appl. Surf. Sci., 2018, 444, 1–9 CrossRef CAS.
| This journal is © The Royal Society of Chemistry 2020 |