 Open Access Article
One-pot HTST synthesis of responsive fluorescent ZnO@apo-enzyme composite microgels for intracellular glucometry†
Ruyue Lana,
Huijiao Liua,
Lin Zhua,
Fan Lua,
Qingshi Wub and
Weitai Wu *a
*a
aState Key Laboratory for Physical Chemistry of Solid Surfaces, Collaborative Innovation Center of Chemistry for Energy Materials, The Key Laboratory for Chemical Biology of Fujian Province, Department of Chemistry, College of Chemistry and Chemical Engineering, Xiamen University, Xiamen, Fujian 361005, China. E-mail: wuwtxmu@xmu.edu.cn
bCollege of Chemical Engineering and Materials Science, Quanzhou Normal University, Quanzhou, Fujian 362000, China
First published on 15th July 2020
Abstract
Responsive fluorescent microgels, that can selectively, reversibly, and rapidly convert the fluctuation in intracellular glucose level into fluorescence signal, have the potential use for intracellular glucometry to promote the understanding of physiology. Herein, we report one-pot synthesis of such a responsive fluorescent composite microgels, which is made of a representative apo-enzyme, apo-glucose oxidase (apo-GOx), interpenetrated in a composite gel network that is comprised of ZnO quantum dots covalently bonded onto crosslinked poly(ethylene glycol) dimethacrylate. The key of this one-pot synthesis is applying a high-temperature short-time heating (HTST) method, so that the naturally dynamic profile of apo-GOx can be maintained and harnessed on the composite microgels to allow the highly selective response to glucose over a glucose concentration range of 0–20 mM. While the composite microgels can undergo volume phase transitions and convert both an increase and a decrease in glucose concentration into fluorescence signal shortly (<1 s), the changes in average hydrodynamic diameter and fluorescence of the composite microgels can be fully reversible even after twenty cycles of adding/removing glucose, indicating a reversible and rapid time response to the glucose concentration variations. With the composite microgels as biosensors, the fluorescence of the composite microgels embedded in the model cancer cells B16F10 can be modulated in response to intracellular glucose level variations, which are derived from a change in glucose concentration in the culture medium by an external supply, or that can be triggered by biochemical reactions (with the β-galactosidase catalysed hydrolysis of lactose as a model reaction for achieving increased glucose levels, and the GOx catalysed oxidation of glucose for achieving decreased glucose levels).
Introduction
Stimuli responsiveness in material design is burgeoning and is providing the basis for diversely novel and advanced systems.1–8 Bioresponsive materials focus particular attention because they can mimic natural biofeedback-controlled systems, by changing their structure and function on receiving an external stimuli that is derived from a fine change in their surrounding environment. Glucose-responsive materials, which can adapt to the fluctuation in the glucose concentration in milieu, pioneer this area with the promising challenging applications in biology and medicine.9–16 While an irregular concentration of glucose in human blood or urine is known to imply a biological dysfunction, the changes in the glucose level within the cells are indicative of many cellular processes.17–24 For instance, glucose plays a key role in energy metabolism and biosynthesis in the cells of most mammalians and could thus potentially be used in cancer therapy to restrict cancer-cell growth.21 Yet how cells sense and adapt to changes in the glucose level is not well understood so far. Traditionally, intracellular glucose levels have predominantly been determined using destructive assays, including enzymatic assays and mass spectrometry; such assays can only provide dynamic information when carried out with the parallel samples and have a limited temporal resolution.20,23,24 Alternatively, isotopes have been used to monitor glucose transport activity, but they cannot measure glucose uptake in a few living cells and have a limited spatial resolution.17,21,22 In this respect, the ability to routinely monitor the changes of intracellular glucose level is quite limited. The challenge of preparing the cell internalizable and remotely interrogatable biosensors that can provide dynamic information of intracellular glucose level remains to be solved, and glucose-responsive materials hold great potential of providing a structural and functional basis for such a system.Materials with glucose-responsive fluorescent properties hold exceptional promise for the use in intracellular glucometry.25–27 With appropriate choice of optical labels, fluorescent biosensors can in theory be excited and the emission interrogated externally. Frommer's group is possibly the first one to develop fluorescent biosensors for measuring intracellular glucose level.18,28–31 In a typical biosensor developed, the glucose-binding protein (GBP) is terminally coupled with a cyan version of green fluorescent protein (GFP) and a yellow version of GFP. Such a fluorescent biosensor detected the glucose-induced conformational change in GBP via the fluorescence resonance energy transfer (FRET) between two fluorescent protein variants. An analog fluorescent biosensor was developed later by replacing GBP with a glucose indicator protein, which was synthesized by the site-directed mutagenesis of GBP at its 16th amino acid residues.32 With those fluorescent proteins as biosensors for intracellular glucometry, the image acquisition parameters are needed to be optimized to obtain highest possible data quality.30,31 Although even at low signal-to-noise levels (using little excitation) qualitative data can be obtained, quantitative analysis requires the highest possible signal-to-noise ratio (using high excitation). However, too-high excitation can lead to photobleaching of organic fluorophores. As the two fluorophores can have differential photobleaching sensitivity, the change in their ratio might be misinterpreted as a FRET change caused by a glucose level change. In comparison with organic fluorophores, the advantages of inorganic quantum dots (QDs), including continuous absorption, tunable emission, and stability, are significant.33 Recent work functionalized QDs with small molecular phenylboronic acids, which can bind to both 1,2-cis- and 5,6-cis-diols of glucose to form the five-/six-membered boronic cyclic ester;34 the use of QDs in intracellular glucometry involved glucose-mediated assembly and that QD fluorescence was modulated via the reversible covalent bonding of glucose to phenylboronic acids on the surface of the QDs.35 Unfortunately, the non-glucose induced aggregation (e.g., self-aggregation, and polysaccharides/proteins induced aggregation) of QDs is inevitable, which often leads to the additional changes in fluorescence during glucose monitoring and therefore a rapid decay in sensing abilities.
Polymer microgels, colloidal particles having a gel structure internally, offer several advantages over the others to immobilize optical labels: structurally stable, dispersible, tunable dimension, fast response kinetics, and unique physical properties common to living tissues (e.g., a soft and rubbery consistency, and a low interfacial tension with water or biological fluids).36–58 Different methods have been developed to synthesize glucose-responsive fluorescent microgels by integrating the poly(phenylboronic acid) gels with optical labels: (i) physical wrapping dyes or inorganic QDs with microgels; (ii) covalent bonding organic fluorophores or the ligands capped on QDs to polymer chains of microgels; (iii) in situ growth and physical confine of QDs inside already synthesized polymer microgels.41–46,52–57 While the optical labels exhibit unique optical properties,33 the poly(phenylboronic acid) gels can bind to glucose and undergo volume phase transitions in response to changes in glucose concentration in milieu,36–57 to modify the physicochemical environment of the optical labels immobilized inside. Thus, these composite microgels with the optical labels immobilized in the poly(phenylboronic acid) gels, combining the properties from both optical labels and responsive polymer gels, should offer possibilities for external switching and manipulation. No doubt substantial progress has been made, and the composite microgels as biosensors have been reported for the fluorescent detection of glucose, but very much centered on the macrorealm use.41–46,52–57 Only a recent work employed the composite microgels in the intracellular glucometry.58 These composite microgels were comprised of ZnO QDs covalently bonded to a loosely-crosslinked poly(acrylamide), which was interpenetrated in a highly-crosslinked poly(phenylboronic acid). Chemically covalent bonding of QDs directly to polymers can suppress the instability of the resultant composite microgels to achieve long-term cycling even under extreme environments.33,58 While the second scale response time has been determined for an individual composite microgel particle at an increasing glucose concentration,45,58 unfortunately, it typically took a long time for the composite microgels to reach deswelling equilibrium with a decreasing glucose concentration,27 making it potential use in monitoring changes of intracellular glucose levels in an increase manner, but difficult for that in a decrease manner. In addition, although phenylboronic acid is widely referred in literature as the best synthetic ligand identified for binding of glucose in aqueous media, it would preferentially bind to non-glucose saccharides (in particular, the stereoisomers of glucose, including fructose, galactose and mannose) that also contain the cis-diols, leading to poor glucose selectivity.27,34 Clearly, in order to meet the criteria of the respective applications in cells ultimately, it is crucial to exploit new systems of the selective, reversible, and rapid trigger modes as close to the physiological conditions as possible.
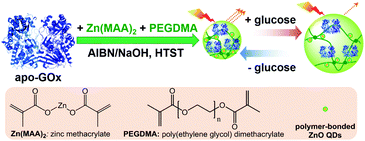
In this work, we aim to develop a class of glucose-responsive composite microgels using natural dynamic protein apo-enzyme as the glucose-recognition moiety. Apo-enzyme is an inactive (not metabolizing) form of an enzyme with the coenzyme being removed. Apo-enzyme is still able to bind the substrate, but not transform it; the binding of substrate could result in enzymatic conformational changes.59–63 Herein, as schematically depicted in Scheme 1, we commence our study by one-pot immobilization of a representative apo-enzyme, apo-glucose oxidase (apo-GOx), in a chemically-crosslinked ZnO@polymer network made from a organometallic precursor zinc methacrylate (Zn(MAA)2) and a crosslinker poly(ethylene glycol) dimethacrylate (PEGDMA). The use of apo-GOx as the glucose-recognition moiety can offer at least two advantages: apo-GOx is highly selective to β-D-glucose, and the non-covalent bindings (involving charge–dipole and hydrogen-bond interactions) of apo-GOx to glucose should make the association/dissociation fully reversible in the normally physiological relevant range of 0–20 mM, making it suitable for monitoring the physiological glucose concentrations.64 However, with organometallic precursor as a reactant in one-pot synthesis, the harsh synthetic conditions reported previously (hydrolysis of organometallic moieties using organic solvents, or thermolysis for hours at ≥60 °C)65–71 have certain limitation in exploiting the natural dynamic proteins to generate the responsive composite microgels, because those proteins suffer from instabilities in the synthesis owing to the denaturation issue when subjected to the non-physiological concentrations of most organic solvents, or exposed long-time to elevated temperature, resulting in a loss of responsiveness. We overcome this problem in one-pot synthesis of the as proposed ZnO@apo-enzyme composite microgels in water, by applying a high-temperature short-time heating (HTST) method. The HTST method is known to be a key development in food industry. For instance, most milk today is pasteurized by the HTST method. While the heat might affect the taste of the milk, HTST treatment seems to well retain protein profile with the protein patterns of HTST-treated milk similar to the raw milk, indicating a negligible denaturation of the proteins.72,73 Under this rational design, the integration of apo-GOx should make the ZnO@apo-enzyme composite microgels responsive to glucose. We show that while ZnO QDs as the optical labels can provide fluorescence, the proposed composite microgels can adapt to a surrounding medium of varied glucose concentrations, convent the fluctuation in glucose concentration into fluorescent signals. This feature should underlie potential of the composite microgels as glucose biosensors for prospective applications.
Experimental
Materials
Human serum albumin (HSA) was purchased from TCI (Tokyo Chemical Industry), and other chemicals were purchased from Aldrich. PEGDMA (Mn ∼ 550 g mol−1) was purified from neutral Al2O3, and 2,2′-azobisisobutyronitrile (AIBN) was purified by recrystallization from ethanol. HSA, Zn(MAA)2, D(+)-glucose, β-D-lactose, D(−)-fructose, D(+)-mannose, D(+)-galactose, dextran (Mr ∼ 6000), dextran (Mr ∼ 40![[thin space (1/6-em)]](https://www.rsc.org/images/entities/char_2009.gif) 000), dextran (Mr ∼ 100
000), dextran (Mr ∼ 100![[thin space (1/6-em)]](https://www.rsc.org/images/entities/char_2009.gif) 000), ribonuclease B (RNase B) from bovine pancreas (13
000), ribonuclease B (RNase B) from bovine pancreas (13![[thin space (1/6-em)]](https://www.rsc.org/images/entities/char_2009.gif) 700 dalton), GOx from Aspergillus niger, β-galactosidase from Escherichia coli, and 3-fluoro-1,2-phenylene bis(3-hydroxybenzoate) 3-hydroxy-benzoic acid 1,1′-(3-fluoro-1,2-phenylene) ester (WZB117; glucose transporter inhibitor IV) were used as received without further purification. The water used in all experiments was of Millipore Milli-Q grade.
700 dalton), GOx from Aspergillus niger, β-galactosidase from Escherichia coli, and 3-fluoro-1,2-phenylene bis(3-hydroxybenzoate) 3-hydroxy-benzoic acid 1,1′-(3-fluoro-1,2-phenylene) ester (WZB117; glucose transporter inhibitor IV) were used as received without further purification. The water used in all experiments was of Millipore Milli-Q grade.
Preparation of apo-GOx
The pH of an ammonium sulfate solution (saturated, 25%) was adjusted to ca. 1.4 by using H2SO4. A GOx solution (containing 50.0 mg GOx in 5.0 mL of 2.5 mol L−1 sodium acetate) was added drop-wisely to the acidified ammonium sulfate solution (5.0 mL) in an ice bath. After 2 h of stirring, the coenzyme (flavin adenine dinucleotide, FAD) can be split off from the enzyme GOx, and the yellow supernatant was removed after centrifugation (13![[thin space (1/6-em)]](https://www.rsc.org/images/entities/char_2009.gif) 000 rpm, 15 min, and 4 °C) (Thermo Electron Co. SORVALL® RC-6 PLUS centrifuge; the same below).59–63 The precipitate was re-dissolved and then neutralized by adding sodium acetate. The neutralized solution was subjected three more cycles of acidified salt treatment, centrifugation and neutralization. Finally, the protein was washed three times by using the sodium phosphate solution (10.0 mM, pH = 6.8). The apo-GOx was redispersed in the sodium phosphate solution (20.0 mL; to yield 2.500 g L−1) and storaged in at 0 °C.
000 rpm, 15 min, and 4 °C) (Thermo Electron Co. SORVALL® RC-6 PLUS centrifuge; the same below).59–63 The precipitate was re-dissolved and then neutralized by adding sodium acetate. The neutralized solution was subjected three more cycles of acidified salt treatment, centrifugation and neutralization. Finally, the protein was washed three times by using the sodium phosphate solution (10.0 mM, pH = 6.8). The apo-GOx was redispersed in the sodium phosphate solution (20.0 mL; to yield 2.500 g L−1) and storaged in at 0 °C.
Microgels synthesis
Zn(MAA)2 (1.00 mmol), apo-GOx (10.00 mmol) and PEGDMA (0.20 mmol) was dissolved in water (25.0 mL) in a 100 mL flask equipped with a stirrer, a nitrogen gas inlet, a thermometer, and a condenser, in an ice-water bath of ca. 4.0 °C. The mixture was stirred, and AIBN (0.41 mmol) was added. After stirring for 5 min, the water bath of 4.0 °C was quickly replaced by another water bath of 70.0 °C (pre-heating), under otherwise the same conditions (the flask kept unmoved); after heating for 1 min, NaOH (50.0 μL; 5.00 M in water) was added into the reaction system and reacted for another 1 min. Then, the water bath of 70.0 °C was quickly replaced by the water bath of 4.0 °C, to cool the reaction system for 5 min; subsequently, the water bath of 4.0 °C was quickly replaced by the water bath of 70.0 °C, to heat the reaction system for 1 min. After another 29 cycles of cooling (4.0 °C; 5 min) and heating (70.0 °C; 1 min), the reaction system was cooled rapidly to room temperature (ca. 25 °C). The product was purified by centrifugation (20![[thin space (1/6-em)]](https://www.rsc.org/images/entities/char_2009.gif) 000 rpm, 30 min, and 25 °C), and dialysis (Spectra/Por® molecularporous membrane tubing, cutoff 12
000 rpm, 30 min, and 25 °C), and dialysis (Spectra/Por® molecularporous membrane tubing, cutoff 12![[thin space (1/6-em)]](https://www.rsc.org/images/entities/char_2009.gif) 000–14
000–14![[thin space (1/6-em)]](https://www.rsc.org/images/entities/char_2009.gif) 000) against water.
000) against water.
Laser light scattering (LLS) studies
Standard Laser Light Scattering (LLS) spectrometer (BI-200SM) equipped with a BI-9000 AT digital time correlator (Brookhaven Instruments, Inc.) and a Mini-L30 diode laser (30 mW, 637 nm) as the light source was used. All measurements were made in the 5.0 mM phosphate buffer solutions (PBS) of pH = 7.4. The very dilute composite microgel dispersions (10.0 μg mL−1) were passed through the Millipore Millex-HV filters (pore size 0.80 μm) to remove dust before LLS measurements. In Dynamic LLS (DLS), the Laplace inversion of each measured intensity–intensity time correlation function in a dilute dispersion can lead to a line-width distribution G(Γ). For a purely diffusive relaxation, Γ is related to the translational diffusion coefficient D by (Γ/q2)C→0,q→0 = D, so that G(Γ) can be converted to a translational diffusion coefficient distribution and the average hydrodynamic diameter (〈Dh〉) distribution by using the Stokes–Einstein equation, 〈Dh〉 = (kBT/3πη)/D, where kB, T, and η are the Boltzmann constant, absolute temperature, and solvent viscosity, respectively.74Adsorption experiments
Adsorption of HSA, dextran and RNase B on ZnO@apo-enzyme composite microgels was carried out by mixing HSA, dextran and RNase B in PBS (5.0 mM, pH = 7.4) (V = 5.0 mL) at a given concentration (C0 = 44.0 g L−1) to mass (mmicrogels = 50.0 mg) of the composite microgels in tubes at 37.0 °C. After maintained for 24 h to reach equilibrium, the mixture was centrifuged (20![[thin space (1/6-em)]](https://www.rsc.org/images/entities/char_2009.gif) 000 rpm, 37 °C, and 30 min) and washed by water for twice. The HSA/dextran/RNase B-microgel complexes were collected and redispersed in PBS (5.0 mL) for analysing effect of adsorption of HSA/dextran/RNase B on the composite microgels. Moreover, the HSA/dextran/RNase B concentration in the supernatant, CE, was determined by using UV-vis absorption, based on a linear calibration curve (R2 > 0.99) measured using the solutions with the known concentrations under the same conditions, for the calculation of surface density d of the protein:
000 rpm, 37 °C, and 30 min) and washed by water for twice. The HSA/dextran/RNase B-microgel complexes were collected and redispersed in PBS (5.0 mL) for analysing effect of adsorption of HSA/dextran/RNase B on the composite microgels. Moreover, the HSA/dextran/RNase B concentration in the supernatant, CE, was determined by using UV-vis absorption, based on a linear calibration curve (R2 > 0.99) measured using the solutions with the known concentrations under the same conditions, for the calculation of surface density d of the protein:
 | (1) |
Photoluminescence (PL) properties
ZnO@apo-enzyme composite microgel dispersion was adjusted to an appropriate concentration of 10.0 μg mL−1 for measurements. To study glucose-responsive optical properties, PL spectra were recorded in 5.0 mM PBS of pH = 7.4 at 37.0 °C and at different glucose concentrations ([Glu]). The experiments were repeated for five times at each glucose concentration, and the average PL intensity at 546 nm (I) and emission maximum position (λ) were used for constructing model. For the interference tests, different interferents at appropriate amounts were mixed into the glucose solutions.Kinetics measurements
The glucose-responsive kinetics measurements were measured from changes in PL intensity at 546 nm on a spectrofluorometer (Jobin Yvon Co. FluoroMax®-4) equipped with a magnetic stirrer, a thermoelectric temperature controller (LFI-3751), and a syringe pump. Typically, a scheduled amount of glucose solution was injected and mixed with the composite microgel dispersion (3.0 mL). The change in PL intensity of the mixture was recorded as time evolved, with the interval set to 0.02 s. To study the effect of the particle concentration on the characteristic response time τsensing, kinetic measurements were carried out for the composite microgels of the concentration in the range of 5–200 μg mL−1. Each kinetic curve represents an average of at least five consecutive mixing trials.Cell internalization and intracellular glucometry
Glass base dishes (35 mm) were treated with 0.1% poly-L-lysine in 100 mM PBS for 60 min. The solution was aspirated and the dishes were washed with PBS three times. The mouse melanoma B16F10 cells (2 × 10⁶ cells per dish) were plated on glass coverslips at 80% confluence in sugar-free Dulbecco's Modified Eagle's Medium (DMEM) containing 10% fetal bovine serum (FBS), 1% penicillin-streptomycin. Next day the composite microgels was diluted in serum/sugar free media (200.0 μL sample plus 1.6 mL serum free media). The cells were incubated with the composite microgels in the following two manners: (1) incubated for 2 h and sugar-free DMEM (200 μL) was added; (2) incubated for 2 h and DMEM (200.0 μL) of different glucose concentrations were added. The finial concentration of the composite microgels for cell culture is ca. 10.0 μg mL−1. After the addition, the sample was incubated for another 4 h. Control dish contained 2.0 mL of serum/sugar free media. After the incubation, the samples were washed with serum/sugar free media for cellular imaging.In a preliminary study, the PL intensity was monitored, and the experiment was conducted by replacing the serum/sugar free media with fresh DMEM (2.0 mL, containing 1.0 mM glucose) in a glass dish containing the composite microgels stained cells; then, the media was replace with fresh sugar-free DMEM (2.0 mL); finally, the media was replace with fresh DMEM (2.0 mL, containing 1.0 mM glucose and 60.0 μM WZB117). Control dish contained 2.0 mL of DMEM without WZB117 in the last step.
To simulate an environment of increase glucose concentration, the biochemical stimulus was conducted by quickly replacing the serum/sugar free media with fresh sugar-free DMEM (1.8 mL), lactose solution (100.0 μL; in sugar-free DMEM), and β-galactosidase solution (100.0 μL; in sugar-free DMEM) in a glass dish containing the composite microgels stained B16F10 cells. The temperature of the culture medium was maintained at 37.0 °C during the experiment. Control dishes contained the composite microgels stained B16F10 cells plus lactose (plus 100.0 μL sugar-free DMEM), the composite microgels stained B16F10 cells plus β-galactosidase (plus 100.0 μL sugar-free DMEM), and the composite microgels stained B16F10 cells plus galactose (plus 100.0 μL sugar-free DMEM), respectively. To simulate an environment of decrease glucose concentration, the serum/sugar free media was replaced with the fresh sugar-free DMEM (1.8 mL), glucose solution (100.0 μL; in sugar-free DMEM), and GOx solution (100.0 μL; in sugar-free DMEM) in a glass dish containing the composite microgels stained B16F10 cells; control dishes contained the composite microgels stained B16F10 cells plus glucose (plus 100.0 μL sugar-free DMEM), the composite microgels stained B16F10 cells plus GOx (plus 100.0 μL sugar-free DMEM), and the composite microgels stained B16F10 cells plus gluconic acid (plus 100 μL sugar-free DMEM), respectively.
Live cell imaging was performed on a confocal laser scanning microscopy (LEICA TCS SP2 AOBS™) equipped with a HC PL APO CS 20× 0.7 DRY len, and a Linkam THMS 600 stage. A UV (405 nm) light was used as the light source. Laser power at the sample plane was 10 mW for all experiments at 37.0 °C. A high-resolution Hamamatsu C9100-02 CCD camera was used for acquiring cell images. For PL intensity change, the fluorescence signal was obtained from fluorescence images by summing the PL intensities of all the pixels within a single cell (n = 5, mean ± s.d.); while for the change on emission maximum position, the fluorescence signal was readed from microscope by creating the lambda series and analysing the spectra by using the standard LCS software through a stack dialog window.
The glucose resolution (δ[Glu]cell) was evaluated by:58
 | (2) |
 | (3) |
Other characterizations
pH values were measured on a Mettler Toledo SevenEasy pH meter. UV-vis absorption spectra were recorded on a Varian Cary 5000 UV-vis-NIR spectroscopy. IR spectra were recorded on a Thermo Electron Corporation Nicolet 380 Fourier transform infrared spectrometer. TEM images were taken on a JEOL JEM-2100 transmission electron microscope at an accelerating voltage of 200 kV.Results and discussion
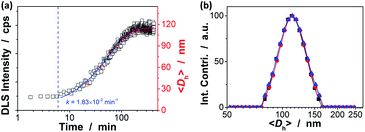
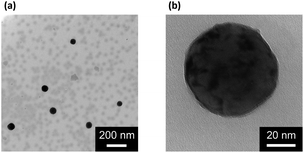
Our strategy to the one-pot synthesis of the ZnO@apo-enzyme composite microgels involves free radical copolymerization of a organometallic precursor Zn(MAA)2 with a oligomer crosslinker PEGDMA in the presence of apo-GOx, which simultaneously involves in situ growth of ZnO QDs. The one-pot synthesis of ZnO@polymer nanoparticles with ZnO QDs covalently bonded to polymers, such as poly(methacrylate)-co-poly(ethylene glycol) methyl ether methacrylate, has been established by the in situ polymerization and ZnO formation from Zn(MAA)2.67 Recently, the temperature-responsive ZnO@polymer composite microgels were synthesized by in situ polymerization and ZnO formation from Zn(MAA)2, PEGDMA, and oligo(ethylene glycol) methyl ether methacrylate; in addition, metallic Au was further growth into these composite microgels to integrate fluorescence of ZnO, surface plasmon resonance of Au, and thermosensitivity of the microgel into a single nano-object.68 Different from the synthesis conditions for ZnO@polymer composites reported in previously that employ continuous heating at for hours at ≥60 °C, the HTST method is used in the one-pot synthesis of the ZnO@apo-enzyme composite microgels. To the best of our knowledge, the HTST method is barely used in the synthesis of polymers. The HTST method is better known in the flow synthesis of inorganic nanoparticles, where an aqueous metal salt stream is mixed with another preheated reactant streams for the fast initial heating, followed by rapid heating of reactant streams to allow ripening of the nanoparticles in a reactor before finally quenching the reaction by cooling.75,76 In this context, we realize the potential use of the HTST method in the one-pot synthesis of responsive composite microgels from organometallic precursors and natural dynamic proteins. We monitored the whole synthesis process using dynamic light scattering (DLS). As shown in Fig. 1a, two stages can be observed after addition of the initiator into the reaction mixture: (i) DLS intensity kept nearly the same in the first ca. 6 min, and then (ii) increased gradually and reached stable within the reaction time of 187 min (the proposed ZnO@apo-enzyme composite microgels were harvested at this time; the prolongation in the reaction time shown in Fig. 1 just is used to confirm the fact that the reaction can be completed in the reaction time of 187 min). It is possible that after initiating the free radical copolymerization and forming polymer-bonded ZnO at 70.0 °C, ZnO@poly(PEGDMA-co-MAA) fragments formed at the early stage of reaction would form very tiny nuclei; with the reaction proceeded subsequently, more ZnO@poly(PEGDMA-co-MAA) fragments were added onto the initially formed nuclei, leading to continuous growth in size of the microgel until the reaction was completed.67,68 Based on the evolution of the DLS intensity, the apparent rate constant k of 1.83 × 10⁻² min−1 was derived from the fitting of the second-stage of the time-domain DLS intensity with an exponential growth (1st-order kinetic). The kinetic evolution was substantiated by DLS study on the average hydrodynamic diameter, 〈Dh〉, vs. the reaction time (Fig. 1a). The 〈Dh〉 for the ZnO@apo-enzyme composite microgels was approximately 112 nm, as measured at 37.0 °C (Fig. 1b). The DLS size distribution shows only a single peak for the narrowly distributed microgels, with polydispersity index μ2/〈Γ〉2 ≤ 0.005. Moreover, typical TEM images shown in Fig. 2 indicate a sphere-like morphology of the composite microgels.UV-vis absorbance spectral comparison between the purified GOx, apo-GOx, and the ZnO@apo-enzyme composite microgels was used to identify the composition of the samples (Fig. 3a). In a typical UV-vis absorbance spectrum of GOx, the characteristic profile displays a peak centred at ca. 278 nm (due to the aromatic amino acid residues of apo-enzyme), together with another two characteristic humps at ca. 380 nm and ca. 452 nm (due to the coenzyme FAD).59–64 In the absorbance spectra of apo-GOx and the ZnO@apo-enzyme composite microgels, the absorption at ca. 278 nm from the aromatic amino acid residues is well inherited, whereas the absorption at 330–500 nm disappears, indicating that FAD has been removed. The successful integration of ZnO QDs manifests as new hump at ca. 328 nm in the absorbance spectrum of the ZnO@apo-enzyme composite microgels. As the size of ZnO QDs is directly related to the excitonic peak in the UV-vis absorption spectrum, the size of ZnO QDs immobilized in the composite microgels can be estimated by the empirical function reported by Meulenkamp.77 The typical λ1/2 of ZnO QDs (Fig. 3a), the wavelength at which UV-vis absorption is 50% of that at the excitonic peak (or shoulder), is determined as ca. 349 nm for the composite microgels, from which the average size of ZnO QDs was calculated to be ca. 3.6 nm. Since the polymer chains occupy more than 80% of the dried particle volume and TEM image is a 2D projection for a 3D distribution of ZnO QDs inside the composite microgels, the structure of the immobilized QDs cannot be seen clearly (Fig. 2). The formation of ZnO QDs is also confirmed by XRD (Fig. S1 in ESI†). Moreover, in IR spectrum of the composite microgels (Fig. 3b), the characteristic bands for those bridging coordination modes of acetate group with Zn appears at ca. 1600 cm−1 (C![[double bond, length as m-dash]](https://www.rsc.org/images/entities/char_e001.gif) O) and 1443 cm−1 (C–O),67,68 indicating that ZnO QDs were tethered to the gel network chains via covalent bonds. The signal at ca. 1723 cm−1 is assigned for the –COOR groups, and the broad band at 1090 cm−1 (C–O–C) is associated with the PEGDMA chains. The characteristic amide I band of apo-GOx at ca. 1655 cm−1 is consistent with that for α-helix-rich structure of apo-enzyme in GOx.64,78,79 The composite microgels showed good stability, with the DLS size distribution kept nearly the same before and after 3 days' dialysis, or after dialysis and then 3 months' storage at room temperature (Fig. 1b; also see below). More importantly, only a marginal change was detected in the λ1/2 of ZnO QDs (Fig. S2 in ESI†), implying that the size of QDs remained unchanged and the aggregate/leaching of QDs can be negligible. The good stability of the ZnO@apo-enzyme composite microgels is a key parameter in the following study of glucose response.
O) and 1443 cm−1 (C–O),67,68 indicating that ZnO QDs were tethered to the gel network chains via covalent bonds. The signal at ca. 1723 cm−1 is assigned for the –COOR groups, and the broad band at 1090 cm−1 (C–O–C) is associated with the PEGDMA chains. The characteristic amide I band of apo-GOx at ca. 1655 cm−1 is consistent with that for α-helix-rich structure of apo-enzyme in GOx.64,78,79 The composite microgels showed good stability, with the DLS size distribution kept nearly the same before and after 3 days' dialysis, or after dialysis and then 3 months' storage at room temperature (Fig. 1b; also see below). More importantly, only a marginal change was detected in the λ1/2 of ZnO QDs (Fig. S2 in ESI†), implying that the size of QDs remained unchanged and the aggregate/leaching of QDs can be negligible. The good stability of the ZnO@apo-enzyme composite microgels is a key parameter in the following study of glucose response.
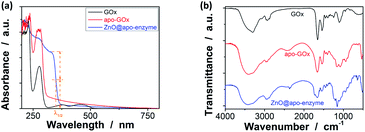 | ||
| Fig. 3 Typical (a) UV-vis and (b) IR spectra of ZnO@apo-enzyme composite microgels. The results for GOx and apo-GOx are also shown for comparison. | ||
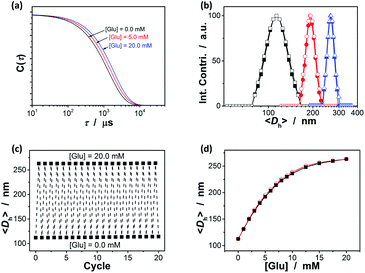
A key question is then if the ZnO@apo-enzyme composite microgels would adapt to fluctuation in glucose concentration in milieu. As shown by the X-ray analysis and molecular dynamics simulations analyses the glucose-binding site of GOx (apo-GOx) is formed by Asp 584, Tyr 515, His 559 and His 516, whilst Phe 414, Trp 426 and Asn 514 are in locations where they might form additional contacts to glucose.78 It has been documented that the binding of the natural dynamic protein apo-GOx with glucose would not represent major changes on the secondary structure of apo-GOx, whereas it is sufficient to induce a general “loosening” of the tightly packed structure with the rearrangement of the hydrogen bonding.79 This conformational change of the dynamic protein may imply a volume change of the involved polymer gels.64 We then examined the effect of the change in the glucose concentration on the ZnO@apo-enzyme composite microgels by using DLS, which is a powerful tool to in situ study volume phase transition behavior of polymer gel particles in solution.74 Fig. 4a shows the typical DLS intensity autocorrelation functions (C(τ)) for the composite microgels dispersed in the solutions with different glucose concentrations of [Glu] = 0.0, 5.0, and 20.0 mM. In the absence of glucose ([Glu] = 0.0 mM), the diffusion coefficient (D) was 4.05 × 10⁻⁸ cm2 s−1, corresponding to a 〈Dh〉 of 112 nm (Fig. 4b); interestingly, increasing the [Glu] to 5.0 and 20.0 mM would decreased D to 2.35 × 10⁻⁸ cm2 s−1 and 1.73 × 10⁻⁸ cm2 s−1, respectively, indicating an increase in the 〈Dh〉 to 192 nm and 263 nm correspondingly. The increased 〈Dh〉 at the higher [Glu] verified the swelling of the composite microgels upon adding glucose in milieu. The swelling ratio, in terms of 〈Dh〉20.0 mM/〈Dh〉0.0 mM, is approximately 2.3. Since the binding between apo-GOx and glucose typically involves non-covalent charge–dipole and hydrogen-bond interactions, which should make the association/dissociation of the apo-GOx–glucose non-covalent bond complexes reversible.78,79 As glucose is removed from the bathing medium by dialysis against water, the breakage of the apo-GOx–glucose non-covalent bond complexes occurs, leading to a fully recovery of the 〈Dh〉 (within 102% of the original basal value) within the experimental error even after twenty cycles of adding/removing glucose (Fig. 4b and c). A detail study further indicate that the volume changes of the composite microgels upon adding/removing glucose can occur over a physiologically relevant important range (0.0–20.0 mM) at a physiological pH of 7.4 (Fig. 4d). The good reversibility of glucose-responsive volume phase transition is demonstrated by the perfect match of the adding and the removing glucose curves, and the repeatable size distribution during adding/removing glucose cycles as well. The volume changes occurred with the glucose-binding constant near 10 mM, which is comparable to the dissociation constant of holoenzyme.59–63 Therefore, these results provide the direct proof on the successful maintaining of the dynamic profile of apo-GOx on the composite microgels to enable responsive volume phase transitions of the composite microgels upon adding/removing glucose. The maintaining of the dynamic profile of apo-GOx on the composite microgels can be interpreted as the considerable suppression on denaturation of apo-GOx in the synthesis by using the HTST method. The HTST method is known to be a key development in food industry. For instance, most milk today is pasteurized by the HTST method. While the heat might affect the taste of the milk, HTST treatment seems to well retain the protein profile with the protein patterns of the HTST-treated milk similar to the raw milk, indicating a negligible denaturation of the proteins.72,73 For GOx (apo-GOx), while it is usually referred to be thermally instable, biochemical changes show that it largely would not lose its biological activity and dynamic profile when subjected shortly to heat of 70 °C.80–82 In an additional experiment, the controlled composite microgels were obtained by continuous heating at 70.0 °C under otherwise the same conditions for the synthesis of the ZnO@apo-enzyme composite microgels; standing in contrast against the ZnO@apo-enzyme composite microgels that can adapt to the fluctuation in glucose concentration, the controlled composite microgels were insensitive to glucose (see Fig. S3 in ESI†).
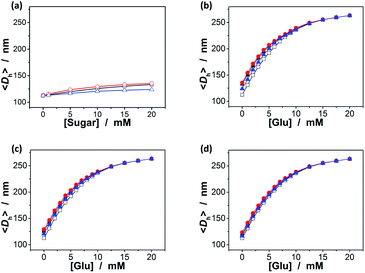
Since the binding affinity has not changed significantly, one can suggest that the binding should be highly specific for glucose. To clarify this important feature, we have checked the potential response of the ZnO@apo-enzyme composite microgels to fructose, mannose, and galactose, which are naturally occurring key stereoisomers of glucose, over the concentration range of 0.0–20.0 mM in 5.0 mM PBS of pH = 7.4 at 37.0 °C. As shown in Fig. 5a (also see Fig. S4 in ESI† for DLS size distribution), it seems that the swelling behavior of the composite microgels upon adding fructose, mannose, and galactose could still occur, however, with the swelling ratio 〈Dh〉20.0 mM/〈Dh〉0.0 mM reducing remarkably to 1.18, 1.21, and 1.10, respectively, indicating a nearly negligible change in overall response to these non-glucose monosaccharides. It is thus probable that these non-glucose monosaccharides would be not the main interferences if the composite microgels were used as glucose-responsive materials. Indeed, the 〈Dh〉–[Glu] plots in Fig. 5b indicate that there was ca. 0.1–20.4% variation in the glucose-responsive 〈Dh〉 change in the presence of a high concentration of those non-glucose monosaccharides as high as 20.0 mM. The smaller variation appeared at the higher [Glu], e.g., ≤10.1% variation in the glucose-responsive 〈Dh〉 change at [Glu] ≥ 6.0 mM, and ≤4.4% at [Glu] ≥ 8.0 mM. The variation in glucose-responsive 〈Dh〉 change would become less pronounced in the presence of the lower concentrations of those non-glucose monosaccharides. With the concentration of those non-glucose monosaccharides decrease to 10.0 mM and 5.0 mM, respectively, the variation in the glucose-responsive 〈Dh〉 change of the composite microgels becomes ≤15.0% (Fig. 5c) and ≤9.9% (Fig. 5d). The composite microgels acting as glucose-responsive materials seem to be free from significant interference of ≤1.0 mM of fructose, galactose or mannose, as there was negligible variation (≤2.7%; see Fig. S5 in ESI†) in glucose-responsive 〈Dh〉 change in the presence of 1.0 mM of those non-glucose monosaccharides. Besides the monosaccharides, we have also checked the possible binding of the composite microgels with dextran (Mr ∼ 6000), dextran (Mr ∼ 40![[thin space (1/6-em)]](https://www.rsc.org/images/entities/char_2009.gif) 000), dextran (Mr ∼ 100
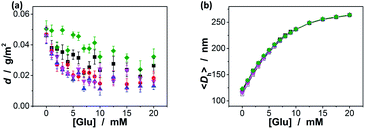
000), dextran (Mr ∼ 100![[thin space (1/6-em)]](https://www.rsc.org/images/entities/char_2009.gif) 000), and RNase B, since those polysaccharides/glycoproteins also contain the glycosyl residues; the composite microgels were also subjected to HSA, the most abundant protein in human serum that is known to undergo a slow non-enzymatic glycation and eventually can result in the formation of Advanced Glycosylation End products (AGE).83 Fig. 6a shows that HSA, dextran and RNase B can indeed adsorb onto the composite microgels, whereas only a low adsorption level was recorded (with the surface density d ≤ 0.06 g m−2). HSA, dextran and RNase B are relatively large molecules. It is possibly that they would only bind the PBA groups located at the light penetration depth of the composite microgels, and the initial binding of HSA, dextran and RNase B would subsequently hinder accessibility of the PBA groups to more HSA, dextran or RNase B molecules.64 Thus it is unlikely that those molecules would have significant impact on the glucose-response of the composite microgels. The observed low level adsorption of the polysaccharides/proteins to the composite microgels only caused a slight increase in size of the composite microgels (see Fig. S6 in ESI† for DLS size distribution) and thus a slight change in the glucose-responsive swelling degree (Fig. 6b; 0.1–9.4% variation in glucose-responsive 〈Dh〉 change).
000), and RNase B, since those polysaccharides/glycoproteins also contain the glycosyl residues; the composite microgels were also subjected to HSA, the most abundant protein in human serum that is known to undergo a slow non-enzymatic glycation and eventually can result in the formation of Advanced Glycosylation End products (AGE).83 Fig. 6a shows that HSA, dextran and RNase B can indeed adsorb onto the composite microgels, whereas only a low adsorption level was recorded (with the surface density d ≤ 0.06 g m−2). HSA, dextran and RNase B are relatively large molecules. It is possibly that they would only bind the PBA groups located at the light penetration depth of the composite microgels, and the initial binding of HSA, dextran and RNase B would subsequently hinder accessibility of the PBA groups to more HSA, dextran or RNase B molecules.64 Thus it is unlikely that those molecules would have significant impact on the glucose-response of the composite microgels. The observed low level adsorption of the polysaccharides/proteins to the composite microgels only caused a slight increase in size of the composite microgels (see Fig. S6 in ESI† for DLS size distribution) and thus a slight change in the glucose-responsive swelling degree (Fig. 6b; 0.1–9.4% variation in glucose-responsive 〈Dh〉 change).
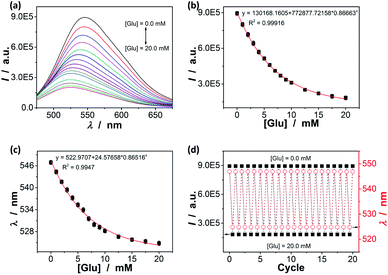
As the volume phase transitions on polymer gels, similarly the conformational changes on oligomer/polymer chains, can vary optical properties of chromophoric inclusions, the response can be studied by spectroscopy.41–46,52–58 We discovered that changes in the yellowgreen emission of the ZnO@apo-enzyme composite microgels indeed occurred upon adding glucose (Fig. 7a and S7 in ESI†): (a) a continuous quenching in PL intensity I; and (b) a significant blue shift of the emission maximum position λ. When the [Glu] was increased to 20.0 mM, a PL quenching as high as ca. 81% and a blue-shift of ca. 95.5 meV (22 nm) were observed. Both effects are rationalized by an increase in the elastic tension in the expanded polymer network chains (according to the Flory–Huggins theory),84 which could stretch the polymer-QD interface and propagate the strain to the surface of the covalently bonded QDs, and create surface states that can quench the PL;41–46,52–58 the energy difference is taken as an indication of the change in the cluster–cluster interactions among the QDs in the composite microgels.35 Both the PL intensity change (Fig. 7b) and the PL maximum position change (Fig. 7c) as a function of the [Glu] mirror that of the glucose-responsive volume phase transition of the composite microgels (Fig. 4d), correlating the PL response to the 〈Dh〉 response of the composite microgels. As glucose was removed from the bathing medium of the composite microgels by dialysis, the composite microgels collapsed reversibly from the swelling status back to the original deswelling status (Fig. 4d), leading to a nearly full recovery of the PL spectral profiles upon the removal of glucose even after twenty cycles (Fig. 7d), thus providing a reproducible signal. In control experiments, the PL changes for adding fructose (Fig. S8 in ESI†), mannose (Fig. S9 in ESI†), and galactose (Fig. S10 in ESI†), respectively, were analysed but to give the weak PL response. Clearly, the variation trend of the PL response of the composite microgels for glucose, fructose, mannose, and galactose well agreed with the selectivity order revealed by the 〈Dh〉 response (Fig. 5). In a further study on glucose sensing by utilizing the PL response of the composite microgels (Fig. S11 in ESI†) in the presence of the non-glucose monosaccharides (20.0 mM), an increase of ≤17.5% (≤11.3% at [Glu] ≥ 3.0 mM, and ≤4.6% at [Glu] ≥ 8.0 mM) in the glucose-induced PL quenching was observed over glucose concentration range of 0.0 mM ≤ [Glu] ≤ 20.0 mM, corresponding to a ≤17.5% higher apparent concentration of glucose (≤11.3% when the actual [Glu] ≥ 3.0 mM, and ≤4.6% at [Glu] ≥ 8.0 mM); in the presence of the polysaccharides/proteins (44.0 g L−1), an increase of ≤8.7% (≤4.7% at [Glu] ≥ 4.0 mM, and ≤2.1% at [Glu] ≥ 8.0 mM) in the glucose-induced PL quenching was observed over the range of 0.0 mM ≤ [Glu] ≤ 20.0 mM. Moreover, the response of the composite microgels to glucose was nearly independent of environmental temperature (15–45 °C; Fig. S12 in ESI†) and pH (5.0–7.8; Fig. S13 in ESI†). This is also an advantage because the temperature of living cells and other biosystems may slightly increase by the thermogenesis of cellular events, and the local pH may be affected by the neighbouring/internal structures and decrease by 1–2.5 units.83 In addition, the influence of common metal ions (2.0 × 10⁻³ to 20.0 mM; such as K+, Na+, Ca2+, Mg2+, Ba2+, Al3+, Cu2+, Zn2+, Co2+, and Fe3+) and organic small molecules (1.0 × 10⁻² to 0.5 mM; pyruvic acid, urea, citric acid, vitamin C, γ-globulins, lysozyme, cholesterol, and amino acids) on the glucose sensing ability of the composite microgels was examined; the relative error of the glucose concentration reading (0.0–20.0 mM) in the presence of those common non-glucose constituents was within the range of ±3.1% (see Table S1 in ESI† for details) after taking account of the experimental errors. Taken together, these results can not only provide a further proof on the maintaining of the dynamic profile of apo-GOx on the composite microgels to allow a highly selective response of the composite microgels to glucose, but also foreshadow a class of responsive materials for glucose-to-fluorescence signal transduction.
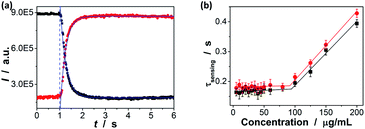
To estimate the response time of the glucose-to-fluorescence signal transduction that is potentially achievable, we monitored the response kinetics in terms of changes in PL intensity of the ZnO@apo-enzyme composite microgels (10.0 μg mL−1 in 5.0 mM PBS of pH = 7.4). As shown in Fig. 8a, the PL intensity change can reach maximum shortly upon adding glucose (e.g., <1 s from 0.0 mM to 20.0 mM). The PL intensity change can be described by a single-exponential function, to give characteristic response time τsensing (e.g., ca. 0.16 ± 0.04 s from 0.0 mM to 20.0 mM).58 The τsensing reflects essential feature of an individual composite microgel particle, because the engaged particle concentration is below the critical value of ca. 10−2 wt% (i.e., so-called dynamic contact concentration) and the inter-particle interactions can be completely ignored, as predicted by a concept of the screening length.58,85 This can be confirmed by the additional experiments that the τsensing is nearly independent of the concentration of the composite microgels in the range of 5–90 μg mL−1 (Fig. 8b). After equilibrium at 20.0 mM, the composite microgels were separated (by centrifugation) and then quickly mixed again with PBS; the PL intensity change can also reach (another) equilibrium rapidly (e.g., <1 s from 20.0 mM to ca. 0.0 mM). These results (also see below) indicate a fast response time of the composite microgels both at the increasing and the decreasing glucose concentrations, different from those poly(phenylboronic acid) (micro)gels that exhibit a fast response time at increasing glucose concentrations but take a long time to reach equilibrium at decreasing glucose concentrations.36–58 Considering a general procedure of glucose-to-fluorescence signal transduction process on a microgel based biosensor, several steps relate to the subtle physical chemistry, including diffusion of glucose molecules, adsorption/desorption and partitioning/departioning of glucose at the solution–microgel interface, complexing of glucose with its binding sites, structural rearrangements inside microgel, and finally a change of the local optical electric field at the QD surface, are known to influence the response time.45,86 While one or several of the steps in tandem can lead to the fast response time of the composite microgels at decreasing glucose concentrations, the essentially non-covalent character of the binding of apo-GOx with glucose that makes it possible for the fast dissociation should be a key.78,79 The fast response time is a desirable feature of a biosensor for monitoring dynamic changes.
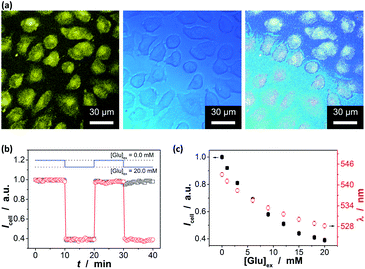
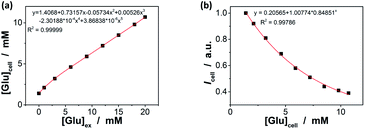
In order to further demonstrate the high glucose selectivity and reversibly rapid response of the ZnO@apo-enzyme composite microgels, we have tested the glucose sensing performance with the composite microgels as biosensors in a real biosystem, mouse melanoma cell B16F10, in view of the potential biological and/or biomedical applications. The small sized PEG-based particles are low toxic (Fig. S14 in ESI†) and can attain deeper penetration into the poorly permeable tumor cells.87 The living cells treated with the composite microgels were highly luminescent, with the fluorescence seen primarily in the cytoplasm (Fig. 9a).88 A cross-sectional Z scan confirmed the entry of the composite microgels into the cells (Fig. S15 in ESI†). The composite microgels in the cells can produce a bright color, and the PL intensity can be retained during a continuous irradiation (Fig. 9b; also see Fig. S16 in ESI† for the confocal images even after a continuous irradiation for 60 min), indicating photostability of the composite microgels in cells. Those cells were grown in sugar-free DMEM. It can be seen in Fig. 9b that the subsequent addition of glucose (20.0 mM) into the culture medium can provoke fluorescence quenching, while replacing of the culture medium with fresh sugar-free DMEM can provoke fluorescence enhancement. It is known that glucose utilization by a cell depends on its transport and/or metabolism, and most mammalian cells transport hexoses in/out of cytosol, as mediated by a family of monosaccharide facilitators.17–19 Almost all cancer cells upregulate the glucose transport and the aerobic glycolysis regardless of the oxygen status, and thereby the cancer cells were found to be addicted to glucose and sensitive to the change in glucose concentration.21 Such an increased glucose transport in cancer cells has been attributed primarily to the upregulation of the glucose transporter 1 (Glut1).89 Under this consideration, underlying the observed PL intensity changes should be transport of glucose externally supplied in culture medium into the cells, and then intracellular glucose induces variations in the physical properties of the composite microgels within the cells. This can be supported by applying WZB117, a Glut1 inhibitor that could competitively inhibit Glut1-mediated glucose transport in cells.89 As shown in Fig. 9b, if replaced culture medium with DMEM simultaneous containing glucose (20.0 mM) and WZB117 (60.0 μM), the Glut1 inhibitor WZB117 can be effective in hindering the transport of glucose from the culture medium into the cells, and the PL intensity remained largely unchanged, making the composite microgels embedded in the cells seem insensitive to the glucose externally supplied in culture medium; in contrast, a quenching in the PL was observed if replaced the culture medium with DMEM containing glucose but no WZB117. Local analysis of the overall PL of the composite microgels embedded in a single cell (n = 5, mean ± s.d.) should indicate the difference in intracellular glucose levels ([Glu]cell).18,28–32,35 In the detail study when different amounts of glucose were fed with an external supply of 1.0–20.0 mM glucose in the culture medium ([Glu]ex), the cells labelled with the composite microgels can be optically differentiated. As shown in Fig. 9c, the PL property changes of the composite microgels embedded in cells mirror that of the composite microgels in PBS (Fig. 7). Meanwhile, two effects were observed: (a) at [Glu]ex = 0.0 mM, the emission maximum position appeared at ca. 543.0 nm; and (b) when 1.0 ≤ [Glu]ex ≤ 20.0 mM, neither the glucose-induced PL intensity quenching degree nor emission position blue-shift degree for the composite microgels embedded in cells is identical to that for the composite microgels in PBS, reflecting that the [Glu]cell is different from the [Glu]ex. Since it is generally thought that the emission maximum position of an insensitive optical label may not be altered (or too small to be neglectable) before and after its entering cells,18,28–33,35 the emission maximum position of the composite microgels may be served as a frame of reference for the quantificational analysis. If this is the case, with Fig. 7c as a calibration reference, it can be speculated that: (a) at [Glu]ex = 0.0 mM, the emission maximum position at ca. 543.0 nm indicates an initial [Glu]cell of ca. 1.4 mM; (b) at 1.0 ≤ [Glu]ex ≤ 20.0 mM, the increment in the [Glu]cell is ca. 46–69% of the externally supplied [Glu]ex (Fig. 10a). Both these two findings are in accord with the observations reported in previous arts by using the fluorescent proteins and other biosensors,18,28–32,35 suggesting the feasibility of using the emission maximum position as a reference for calibration. It is reasonable that glucose enters into cells by facilitated diffusion, a form of passive transport requiring no energy but requiring transmembrane proteins.17–19 Combining the results of the Icell–[Glu]ex (Fig. 9c) and the [Glu]cell–[Glu]ex (Fig. 10a) plots, the relationship between the [Glu]cell and the PL intensity of the composite microgels in cells (Icell; to simplify analysis, the Icell is normalized with the initial PL intensity without any externally supplied saccharides, which is set as 1) can be given in Fig. 10b, and the glucose resolution was estimated to be 0.1–0.2 mM over the [Glu]cell range of 1.0–20.0 mM. Now, in comparison with the I/I0–[Glu] plot constructed in PBS (Fig. 7b and S17 in ESI†), the Icell–[Glu]cell plot revealed nearly the same trend towards the change in glucose concentration. Besides providing additional proofs on glucose-responsive ability of the composite microgels, these results also suggest the possibility of cell internalization of the composite microgels for intracellular glucometry.
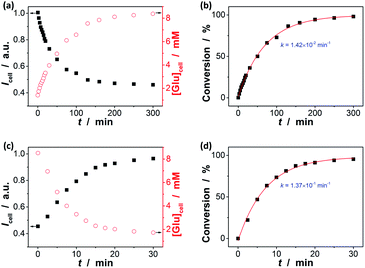
In the next step, we conducted two series of experiments as the proof-of-concept examples to demonstrate the feasibility of extending the proposed ZnO@apo-enzyme composite microgels for monitoring dynamic changes of intracellular glucose induced by the external biochemical reactions (Scheme 2): (a) increasing glucose levels, by using the β-galactosidase catalysed hydrolysis reaction of lactose; (b) decreasing glucose levels, by using the GOx catalysed oxidation reaction of glucose. That is, in the first series of experiments, B16F10 cells labelled with the composite microgels were fed with lactose (15.0 mM), a disaccharide that is found most notably in milk and is thought to be associated with cancer, and β-galactosidase (4.0 U mL−1) which plays a key role in cellular metabolism by breaking down lactose into galactose and glucose;90 in the second series of experiments, cells labelled with the composite microgels were fed with glucose (15.0 mM), and GOx (1.5 U mL−1) that can catalyse oxidation of β-D-glucose to D-glucono-1,5-lactone.27 Since the response kinetics/time of the composite microgels (Fig. 7a) is much faster than that of the two biochemical reactions (see Fig. S18 in ESI† for the kinetic curves of these reactions), it may allow us to use the composite microgels in monitoring the dynamic changes of the intracellular glucose levels. When fed with lactose, β-galactosidase, galactose, GOx, or D-glucono-1,5-lactone only, neglectable change in the PL properties was observed. The presence of both lactose and β-galactosidase, or glucose and GOx, provoked the PL intensity quenching of the composite microgels embedded in the cells (Fig. 11). For instance, after the reactions proceeding for 2.5 min, a PL intensity Icell quenching of ca. 3.6% was observed during the hydrolysis of lactose, indicating an increasing in the intracellular glucose level by an increment of 0.3 mM (from [Glu]cell of ca. 1.4 mM to ca. 1.7 mM; Fig. 11a), whereas an PL intensity Icell enhancement of ca. 7.4% was observed during the oxidation of glucose, indicating a decreasing in the intracellular glucose level by a decrement of 1.6 mM (from [Glu]cell of ca. 8.5 mM to ca. 6.9 mM; Fig. 11c). The variations in [Glu]cell greatly exceeded the glucose resolution of the composite microgels embedded in the cells. Based on the evolution of glucose level, the apparent rate constant of the reactions can be derived from the fitting of the time-dependent conversion, which was calculated by the changes in the glucose level (with the initial [Glu]cell 1.4 mM being deducted) against the [Glu]cell at t → ∞ (i.e., assuming 100% reaction, and taking into account the relationship between the [Glu]ex and the [Glu]cell as shown in Fig. 10a). As shown in Fig. 11b and d, the conversion–t plots fitted well with the exponential growth (k, 1st-order), which is a simplification of the Michaelis–Menten model. Both the reactions measured with the composite microgels embedded in cells exhibited a similar rate constant k (1.42 × 10⁻² min−1 and 1.37 × 10⁻¹ min−1 for the hydrolysis reaction of lactose and the oxidation reaction of glucose, respectively) to that reacted in PBS under otherwise the same conditions and measured by the standard oxygen rate method using a glucose analyzer (Fig. S18 in ESI;† 1.45 × 10⁻² min−1 and 1.62 × 10⁻¹ min−1 correspondingly). This indicates that the composite microgels would not change the mechanism of the reactions between the enzymes and the substrates. Therefore, these results demonstrate that the composite microgels have the potential use as biosensor for the quantification of intracellular glucose level variations associated with a biochemical reaction process.
 | ||
| Scheme 2 The model external biochemical reactions for inducing increasing or decreasing glucose levels. | ||
Conclusions
We have developed a class of responsive fluorescent composite microgels, with apo-GOx interpenetrated in a gel network that is comprised of ZnO QDs covalently bonded to PEGDMA network chains, via a one-pot synthesis strategy involving the free radical copolymerization of a organometallic precursor Zn(MAA)2 with the oligomer crosslinker PEGDMA in the presence of apo-GOx, and simultaneously involving in situ growth of ZnO QDs. Those newly developed composite microgels can selectively, reversibly, and rapidly adapt to the fluctuation in glucose concentration over the normally physiological relevant glucose concentration range of 0–20 mM at a physiological pH of 7.4 and 37.0 °C. While the composite microgels can undergo volume phase transitions and convert both an increase and a decrease in glucose concentration into fluorescence signal shortly (<1 s), the changes in average hydrodynamic diameter and fluorescence can be fully reversible even after twenty cycles of adding/removing glucose, indicating a reversible and rapid time response to the glucose concentration variations. The underlying mechanism for the observed glucose-response is associated with the employment of HTST in the one-pot synthesis, such that the naturally dynamic profile of apo-GOx can be maintained and harnessed on the composite microgels to allow the volume phase transition and PL response to glucose. Moreover, the composite microgels can enter the model B16F10 cells, and the fluorescence of the composite microgels embedded in the cells can be modulated in response to intracellular glucose level variations, which are derived from a change in the glucose concentration in the culture medium by an external supply, or that can be triggered by the biochemical reactions (with the β-galactosidase catalysed hydrolysis of lactose as a model reaction for achieving increased glucose levels, and the GOx catalysed oxidation of glucose for decreased glucose levels). Such a novel class of responsive fluorescent composite microgels might find important biological and biomedical applications. It is anticipate that this may also open up new possibilities for design of natural protein based responsive microgels with huge potential in a range of fields.Conflicts of interest
There are no conflicts to declare.Acknowledgements
We gratefully acknowledge the financial supports from National Science Foundation of China (21774105 and 20923004), and National Fund for Fostering Talents of Basic Science (J1310024).Notes and references
- G. Z. Zhang, A. Z. Niu, S. F. Peng, M. Jiang, Y. F. Tu, M. Li and C. Wu, Acc. Chem. Res., 2001, 34, 249 CrossRef CAS.
- L. A. Lyon, Z. Meng, N. Singh, C. D. Sorrell and A. S. John, Chem. Soc. Rev., 2009, 38, 865 RSC.
- M. A. C. Stuart, W. T. S. Huck, J. Genzer, M. Müller, C. Ober, M. Stamm, G. B. Sukhorukov, I. Szleifer, V. V. Tsukruk, M. Urban, F. Winnik, S. Zauscher, I. Luzinov and S. Minko, Nat. Mater., 2010, 9, 101 CrossRef.
- X. M. He, M. Aizenberg, O. Kuksenok, L. D. Zarzar, A. Shastri, A. C. Balazs and J. Aizenberg, Nature, 2012, 487, 214 CrossRef CAS.
- J. M. Hu, G. Q. Zhang and S. Y. Liu, Chem. Soc. Rev., 2012, 41, 5933 RSC.
- A. Döring, W. Birnbaum and D. Kuckling, Chem. Soc. Rev., 2013, 42, 7391 RSC.
- X. F. Ji, B. B. Shi, H. Wang, D. Y. Xia, K. C. Jie, Z. L. Wu and F. H. Huang, Adv. Mater., 2015, 27, 8062 CrossRef CAS.
- I. Cobo, M. Li, B. S. Sumerlin and S. Perrier, Nat. Mater., 2015, 14, 143 CrossRef CAS.
- V. L. Alexeev, A. C. Sharma, A. V. Goponenko, S. Das, I. K. Lednev, C. S. Wilcox, D. N. Finegold and S. A. Asher, Anal. Chem., 2003, 75, 2316 CrossRef CAS.
- D. Nakayama, Y. Takeoka, M. Watanabe and K. Kataoka, Angew. Chem., Int. Ed., 2003, 42, 4197 CrossRef CAS.
- M.-C. Lee, S. Kabilan, A. Hussain, X. P. Yang, J. Blyth and C. R. Lowe, Anal. Chem., 2004, 76, 5748 CrossRef CAS.
- Z. Gu, A. A. Aimetti, Q. Wang, T. T. Dang, Y. Zhang, O. Veiseh, H. Cheng, R. Langer and D. G. Anderson, ACS Nano, 2013, 7, 4194 CrossRef CAS PubMed.
- Y. M. Hu, X. M. Jiang, L. Y. Zhang, J. Fan and W. T. Wu, Biosens. Bioelectron., 2013, 48, 94 CrossRef CAS PubMed.
- C. J. Zhang, M. D. Losego and P. V. Braun, Chem. Mater., 2013, 25, 3239 CrossRef CAS.
- J. M. Hu and S. Y. Liu, Macromolecules, 2010, 43, 8315 CrossRef CAS.
- C. H. Li, J. M. Hu, T. Liu and S. Y. Liu, Macromolecules, 2011, 44, 429 CrossRef CAS.
- H. M. Kalckar and D. B. Ullrey, Proc. Natl. Acad. Sci. U. S. A., 1984, 81, 1126 CrossRef CAS PubMed.
- L.-Q. Chen, B.-H. Hou, S. Lalonde, H. Takanaga, M. L. Hartung, X.-Q. Qu, W.-J. Guo, J.-G. Kim, W. Underwood, B. Chaudhuri, D. Chermak, G. Antony, F. F. White, S. C. Somerville, M. B. Mudgett and W. B. Frommer, Nature, 2010, 468, 527 CrossRef CAS.
- L. F. Sun, X. Zeng, C. Y. Yan, X. Y. Sun, X. Q. Gong, Y. Rao and N. Yan, Nature, 2012, 490, 361 CrossRef CAS PubMed.
- A. Y. L. So, T. U. Bernal, M. L. Pillsbury, K. R. Yamamoto and B. J. Feldman, Proc. Natl. Acad. Sci. U. S. A., 2009, 106, 17582 CrossRef CAS PubMed.
- M. R. Kaadige, R. E. Looper, S. Kamalanaadhan and D. E. Ayer, Proc. Natl. Acad. Sci. U. S. A., 2009, 106, 14878 CrossRef CAS PubMed.
- K. Ohtsubo, M. Z. Chen, J. M. Olefsky and J. D. Marth, Nat. Med., 2011, 17, 1067 CrossRef CAS.
- L. Ban, N. Pettit, L. Li, A. DStuparu, L. Cai, W. Chen, W. Guan, W. Han, P. G. Wang and M. Mrksich, Nat. Chem. Biol., 2012, 8, 769 CrossRef CAS.
- S. K. Chacko, A. L. Sunehag, S. Sharma, P. J. J. Sauer and M. W. Haymond, J. Appl. Physiol., 2008, 104, 944 CrossRef CAS PubMed.
- J. C. Pickup, F. Hussain, N. D. Evans, O. J. Rolinski and D. J. S. Birch, Biosens. Bioelectron., 2005, 20, 2555 CrossRef CAS.
- Y. E. Lee and R. Kopelman, Wiley Interdiscip. Rev.: Nanomed. Nanobiotechnol., 2009, 1, 98 CAS.
- M. S. Steiner, A. Duerkop and O. S. Wolfbeis, Chem. Soc. Rev., 2011, 40, 4805 RSC.
- M. Fehr, S. Lalonde, D. W. Ehrhardt and W. B. Frommer, J. Fluoresc., 2004, 14, 603 CrossRef CAS.
- C. Bermejo, F. Haerizadeh, H. Takanaga, D. Chermak and W. B. Frommer, Biochem. J., 2010, 432, 399 CrossRef CAS PubMed.
- C. Bermejo, F. Haerizadeh, H. Takanaga, D. Chermak and W. B. Frommer, Nat. Protoc., 2011, 6, 1806 CrossRef CAS PubMed.
- B.-H. Hou, H. Takanaga, G. Grossmann, L.-Q. Chen, X.-Q. Qu, A. M. Jones, S. Lalonde, O. Schweissgut, W. Wiechert and W. B. Frommer, Nat. Protoc., 2011, 6, 1818 CrossRef CAS.
- S. Jin, J. V. Veetil, J. R. Garrett and K. M. Ye, Biosens. Bioelectron., 2011, 26, 3427 CrossRef CAS.
- Z.-J. Zhu, Y.-C. Yeh, R. Tang, B. Yan, J. Tamayo, R. W. Vachet and V. M. Rotello, Nat. Chem., 2011, 3, 963 CrossRef CAS.
- A. P. Davis and R. S. Wareham, Angew. Chem., Int. Ed., 1999, 38, 2979 CAS.
- W. T. Wu, T. Zhou, A. Berliner, P. Banerjee and S. Q. Zhou, Angew. Chem., Int. Ed., 2010, 49, 6554 CrossRef CAS PubMed.
- Y. J. Zhang, Y. Guan and S. Q. Zhou, Biomacromolecules, 2006, 7, 3196 CrossRef CAS PubMed.
- V. Lapeyre, I. Gosse, S. Chevreux and V. Ravaine, Biomacromolecules, 2006, 7, 3356 CrossRef CAS.
- T. Hoare and R. Pelton, Macromolecules, 2007, 40, 670 CrossRef CAS.
- T. Hoare and R. Pelton, Biomacromolecules, 2008, 9, 733 CrossRef CAS PubMed.
- V. Lapeyre, C. Ancla, B. Catargi and V. Ravaine, J. Colloid Interface Sci., 2008, 327, 316 CrossRef CAS PubMed.
- W. T. Wu, T. Zhou, J. Shen and S. Q. Zhou, Chem. Commun., 2009, 4390 RSC.
- W. T. Wu, N. Mitra, E. C. Y. Yan and S. Q. Zhou, ACS Nano, 2010, 4, 4831 CrossRef CAS PubMed.
- W. T. Wu, T. Zhou, M. Aiello and S. Q. Zhou, Biosens. Bioelectron., 2010, 25, 2603 CrossRef CAS.
- W. T. Wu, S. M. Chen, Y. M. Hu and S. Q. Zhou, J. Diabetes Sci. Technol., 2012, 6(4), 892 CrossRef.
- W. T. Wu, J. Shen, Y. X. Li, H. B. Zhu, P. Banerjee and S. Q. Zhou, Biomaterials, 2012, 33, 7115 CrossRef CAS PubMed.
- D. Wang, T. Liu, J. Yin and S. Y. Liu, Macromolecules, 2011, 44, 2282 CrossRef CAS.
- C. Ancla, V. Lapeyre, I. Gosse, B. Catargi and V. Ravaine, Langmuir, 2011, 27, 12693 CrossRef CAS PubMed.
- Y. H. Wu, H. M. Hu, J. M. Hu and S. Y. Liu, Macromol. Rapid Commun., 2012, 33, 1852 CrossRef CAS.
- L. Sun, X. Zhang, C. Zheng, Z. Wu, X. Xia and C. Li, RSC Adv., 2012, 2, 9904 RSC.
- Z. Wu, X. Zhang, H. Guo, C. Li and D. Yu, J. Mater. Chem., 2012, 22, 22788 RSC.
- G. Liu, R. Ma, J. Ren, Z. Li, H. Zhang, Z. Zhang, Y. An and L. Shi, Soft Matter, 2013, 9, 1636 RSC.
- Y. Li and S. Q. Zhou, Chem. Commun., 2013, 49, 5553 RSC.
- T. Ye, X. M. Jiang, W. T. Xu, M. M. Zhou, Y. M. Hu and W. T. Wu, Polym. Chem., 2014, 5, 2352 RSC.
- H. Wei, J. D. Xie, X. M. Jiang, T. Ye, A. P. Chang and W. T. Wu, Macromolecules, 2014, 47, 6067 CrossRef CAS.
- Q. S. Wu, H. Cheng, A. P. Chang, W. T. Xu, F. Lu and W. T. Wu, Chem. Commun., 2015, 51, 16068 RSC.
- M. M. Zhou, J. D. Xie, S. T. Yan, X. M. Jiang, T. Ye and W. T. Wu, Macromolecules, 2014, 47, 6055 CrossRef CAS.
- M. M. Zhou, F. Lu, X. M. Jiang, Q. S. Wu, A. P. Chang and W. T. Wu, Polym. Chem., 2015, 6, 8306 RSC.
- J. Fan, X. M. Jiang, Y. M. Hu, Y. Si, L. Ding and W. T. Wu, Biomater. Sci., 2013, 1, 421 RSC.
- S. D'Auria, P. Herman, M. Rossi and J. R. Lakowicz, Biochem. Biophys. Res. Commun., 1999, 263, 550 CrossRef PubMed.
- S. Chinnayelka and M. J. McShane, Biomacromolecules, 2004, 5, 1657 CrossRef CAS PubMed.
- S. Chinnayelka and M. J. McShane, Anal. Chem., 2005, 77, 5501 CrossRef CAS PubMed.
- I. Willner, V. Heleg-Shabtai, R. Blonder, E. Katz, G. Tao, A. F. Bückmann and A. Heller, J. Am. Chem. Soc., 1996, 118, 10321 CrossRef CAS.
- Y. Xiao, F. Patolsky, E. Katz, J. F. Hainfeld and I. Willner, Science, 2003, 299, 1877 CrossRef CAS PubMed.
- T. Ye, X. Bai, X. M. Jiang, Q. S. Wu, S. M. Chen, A. Q. Qu, J. W. Huang, J. Shen and W. T. Wu, Polym. Chem., 2016, 7, 2847 RSC.
- R. F. Mulligan, A. A. Iliadis and P. Kofinas, J. Appl. Polym. Sci., 2003, 89, 1058 CrossRef CAS.
- S. Li, M. S. Toprak, Y. S. Jo, J. Dobson, D. K. Kim and M. Muhammed, Adv. Mater., 2007, 19, 4347 CrossRef CAS.
- H.-M. Xiong, Y. Xu, Q.-G. Ren and Y.-Y. Xia, J. Am. Chem. Soc., 2008, 130, 7522 CrossRef CAS PubMed.
- W. T. Wu, J. Shen, P. Banerjee and S. Q. Zhou, Adv. Funct. Mater., 2011, 21, 2830 CrossRef CAS.
- L. Zhang, F. Li, Y. Chen and X. Wang, J. Lumin., 2011, 131, 1701 CrossRef CAS.
- G. Ambrožič, S. D. Škapin, M. Žigon and Z. C. Orel, J. Colloid Interface Sci., 2011, 360, 370 CrossRef PubMed.
- T. Kos, A. Anžlovar, D. Pahovnik, E. Žagar, Z. C. Orel and M. Žigon, Macromolecules, 2013, 46, 6942 CrossRef CAS.
- M. L. Ranieri, J. R. Huck, M. Sonnen, D. M. Barbano and K. J. Boor, J. Dairy Sci., 2009, 92, 4832 Search PubMed.
- C. Baro, M. Giribaldi, S. Arslanoglu, M. G. Giuffrida, G. Dellavalle, A. Conti, P. Tonetto, A. Biasini, A. Coscia, C. Fabris, G. E. Moro, L. Cavallarin and E. Bertino, Front. Biosci., 2011, 3(3), 818 Search PubMed.
- B. Chu, Laser Light Scattering, Academic Press, New York, 2nd edn, 1991 Search PubMed.
- J. R. Eltzholtz and B. B. Iversen, Rev. Sci. Instrum., 2011, 82, 084102 CrossRef PubMed.
- G. Lawrence, A. V. Baskar, M. H. El-Newehy, W. S. Cha, S. S. Al-Deyab and A. Vinu, Sci. Technol. Adv. Mater., 2015, 16, 024806 CrossRef PubMed.
- E. A. Meulenkamp, J. Phys. Chem. B, 1998, 102, 5566 CrossRef CAS.
- G. Wohlfahrt, S. Witt, J. Hendle, D. Schomburg, H. M. Kalisz and H. U. Hecht, Acta Crystallogr., Sect. D: Biol. Crystallogr., 1999, 55(5), 967 CrossRef PubMed.
- M. De, C. C. You, S. Srivastava and V. M. Rotello, J. Am. Chem. Soc., 2007, 129, 10747 CrossRef CAS PubMed.
- J. J. O'Malley and R. W. Ulmer, Biotechnol. Bioeng., 1973, 15(5), 917 CrossRef PubMed.
- B. Appleton, T. D. Gibson and J. R. Woodward, Sens. Actuators, B, 1997, 43, 65 CrossRef CAS.
- T. Godjevargova, N. Vasileva and Zl. Letskovska, J. Appl. Polym. Sci., 2003, 90, 1393 CrossRef CAS.
- C. A. Burtis and E. R. Ashwood, Tietz Textbook of Clinical Chemistry, W. B. Saunders, Philadelphia, PA, 3rd edn, 1999 Search PubMed.
- P. J. Flory, Principles of Polymer Chemistry, Cornell University Press, New York, 1975 Search PubMed.
- C. Wu, J. Polym. Sci., Part B: Polym. Phys., 1994, 32, 1503 CrossRef CAS.
- K. E. Shafer-Peltier, C. L. Haynes, M. R. Glucksberg and R. P. Van Duyne, J. Am. Chem. Soc., 2003, 125, 588 CrossRef CAS PubMed.
- F. Alexis, E. Pridgen, L. K. Molnar and O. C. Farokhzad, Mol. Pharm., 2008, 5, 505 CrossRef CAS PubMed.
- C. Longo, A. Patanarut, T. George, B. Bishop, W. Zhou, C. Fredolini, M. M. Ross, E. Espinia, G. Pellacani, E. F. Petricoin III, L. A. Liotta and A. Luchini, PLoS One, 2009, 4(3), e4763 CrossRef PubMed.
- Y. Liu, Y. Y. Cao, W. H. Zhang, S. Bergmeier, Y. R. Qian, H. Akbar, R. Colvin, J. Ding, L. Y. Tong, S. Y. Wu, J. Hines and X. Z. Chen, Mol. Cancer Ther., 2012, 11(8), 1672 CrossRef CAS PubMed.
- M. T. Faber, A. Jensen, M. Søgaard, E. Høgdall, C. Høgdall, J. Ballkær and S. K. Kjær, Acta Oncol., 2012, 51, 454 CrossRef CAS PubMed.
Footnote |
| † Electronic supplementary information (ESI) available: XRD (Fig. S1), UV-vis (Fig. S2), DLS (Fig. S3–S6), PL (Fig. S7–S13 and S17), cell viability (Fig. S14), confocal images (Fig. S15 and S16), kinetics of the hydrolysis reaction of lactose and the oxidation reaction of glucose (Fig. S18), and interference test results (Table S1). See DOI: 10.1039/d0ra04339g |
| This journal is © The Royal Society of Chemistry 2020 |

