 Open Access Article
Compressive behavior and electronic properties of ammonia ice: a first-principles study†
Xueke Yu,
Xue Jiang ,
Yan Su
 * and
Jijun Zhao
Key Laboratory of Materials Modification by Laser, Ion and Electron Beams (Dalian University of Technology), Ministry of Education, Dalian 116024, China. E-mail: su.yan@dlut.edu.cn
First published on 16th July 2020
Abstract
Understanding the compressive behavior of ammonia ice is an enduring topic due to its salient implications in planetology and the origin of life as well as its applications in agriculture and industry. Currently, the most stable crystal structures of ammonia ice with increasing pressure have been determined to be P213, P212121, Pma2, Pca21, P21/m and Pnma, respectively. Taking these six crystal structures for consideration, the pressure-induced structural and electronic behavior of ammonia ice was systematically investigated using density functional theory calculations. According to our calculations, the transition from molecular phase P212121 to ionic phase Pma2 can be ascribed to the bonds between H atoms and N atoms on adjacent NH3 molecules. Analysis of the Mulliken population and electron density of states implies decreased charge transfer between the N and H atoms and enhanced bonds with increasing pressure. In addition, charge overlap between NH3 molecules was found at high pressure in the molecular phases of ammonia ice, which is also observed between NH2− and NH4+ groups in ionic phases. With increasing pressure, the band gap of ammonia ice increases rapidly and then decreases gradually, which is a consequence of the subtle competition between the strong coupling in the H 1s and N 2p states and the charge overlap. These simulations help us understand the characteristics of ammonia ice under high pressure and further provide valuable insights into the evolution of planets.
1. Introduction
Ammonia (NH3) is widely found in nature and has importance in a broad range of fields, such as hydrogen storage,1,2 the planetary environment3,4 and the origin of life. In particular, understanding the behavior of solid ammonia (ammonia ice) is essential to understanding planetary evolution because of the abundance of ammonia ice in the giant planets of our solar system.3–5 For instance, water (56%), methane (36%) and ammonia (8%) compose the “hot ice” layers of Uranus and Neptune, with high pressure and high temperature (HPHT) up to 600 GPa and 7000 K.5 Most importantly, the significant cosmic abundance of H2O and NH3 implies the diversity of nature and the possible existence of life on these planets. In this regard, extremely complicated phase diagrams of water and ammonia ices and their compounds under HPHT conditions have been widely explored.6–11Since Olovsson et al.12 determined the cubic structures of ammonia (NH3) and deuteroammonia (ND3) by single-crystal and powder X-ray diffraction, seven condensed phases of ammonia ice have been experimentally determined to date.13–22 Under 0 GPa and 2–180 K, solid deuteroammonia crystallizes in the cubic phase P213, namely phase I, with lattice parameters of 5.073 Å at 77 K by X-ray and neutron diffraction.13,14 With increasing temperature and pressure up to about 240 K and 0.5 GPa and 260 K and 1.28 GPa, phase I transforms to phase II and then into phase III, which consist of rotationally disordered molecules with the space groups P63/mmc and Fm![[3 with combining macron]](https://www.rsc.org/images/entities/char_0033_0304.gif) m, respectively.15,16 When the pressure is raised to about 4 GPa at room temperature, neutron powder diffraction and Raman spectroscopy reveal that phase III undergoes a first-order transition to phase IV with space group P212121, in which the nitrogen atoms have a pseudo-hcp arrangement.17,18 Continuous compression up to approximately 14 (18) GPa can induce subtle structural transition to the isosymmetric phase V in NH3 (ND3).19,20
m, respectively.15,16 When the pressure is raised to about 4 GPa at room temperature, neutron powder diffraction and Raman spectroscopy reveal that phase III undergoes a first-order transition to phase IV with space group P212121, in which the nitrogen atoms have a pseudo-hcp arrangement.17,18 Continuous compression up to approximately 14 (18) GPa can induce subtle structural transition to the isosymmetric phase V in NH3 (ND3).19,20
Because ammonia ice undergoes a series of phase transitions under HPHT conditions, its detailed study engenders numerous experimental challenges. Alternatively, atomistic simulations based on either empirical force fields or density functional theory (DFT) are effective ways to establish the phase diagram of ammonia ice under high pressure and/or high temperature. Cavazzoni et al. carried out ab initio molecular dynamics (AIMD) simulations and predicted that ammonia is a protonic conductor in which the protons hop rapidly between neighboring molecules, forming a superionic solid or ionic fluid under extreme conditions (above 60 GPa and 1200 K).23 Using the ab initio random structure searching (AIRSS) method, Pickard et al. predicted that the molecular phases P21/c and Pa![[3 with combining macron]](https://www.rsc.org/images/entities/char_0033_0304.gif) will remain stable in a narrow region between phase I (P213) and phase IV (P212121).7,24 More notably, the P212121 molecular phase ammonia could transform into an ionic solid phase consisting of NH4+ and NH2− with the space group Pma2 at about 100 GPa. With further increasing pressure, a transformation to another ionic phase, P21/m, occurs at 340 GPa, followed by a transition to the molecular phase Pnma at 450 GPa.7 All the above phases are composed of four NH3 units per unit cell (Z = 4), and the structures of Pa
will remain stable in a narrow region between phase I (P213) and phase IV (P212121).7,24 More notably, the P212121 molecular phase ammonia could transform into an ionic solid phase consisting of NH4+ and NH2− with the space group Pma2 at about 100 GPa. With further increasing pressure, a transformation to another ionic phase, P21/m, occurs at 340 GPa, followed by a transition to the molecular phase Pnma at 450 GPa.7 All the above phases are composed of four NH3 units per unit cell (Z = 4), and the structures of Pa![[3 with combining macron]](https://www.rsc.org/images/entities/char_0033_0304.gif) , P21/c, P21/m and Pnma have not been observed experimentally yet.
, P21/c, P21/m and Pnma have not been observed experimentally yet.
These theoretical predictions have further stimulated experimentalists to verify several ionic phases. By heating phase V to 703 K at 70 GPa, Ninet et al. detected that the protons jump along hydrogen bonds, forming the superionic conductor α phase, which is mainly composed of NH3, NH4+ and NH2− species.21 Subsequently, they observed the transition from the molecular phase V into an ionic structure Pma2, composed of NH4+ and NH2− ions, at 150 GPa and 300 K.22 Moreover, they predicted that the Pma2 phase will transform into another ionic structure with space group Pca21 (Z = 8) at 176 GPa, while their experimental data showed that the Pma2 and Pca21 ionic phases coexist near 190 GPa. Alternatively, the formation of ionic phase Pma2 was also experimentally evidenced at 125 GPa and 300 K by Palasyuk et al.25 A recent melting curve study by X-ray diffraction and Raman spectroscopy also implied the possible presence of superionic solid NH3 on Neptune and Uranus.26
As described above, most studies have been devoted to exploring the high-pressure and high-temperature phase diagrams of ammonia ice. However, some atomic structures and electronic properties of ammonia ice under high pressure are still insufficiently investigated. Especially, the relationship between the electronic structures and HPHT is crucial for better understanding the proton transfer (NH3+ + NH3 → NH4+ + NH2)27 and interior structures of ammonia ice as well as the evolution of Uranus and Neptune. It is known that first-principles methods are able to describe the intermolecular and intramolecular interactions in crystals more accurately.28,29 However, previous first-principles calculations have mainly focused on the phase transitions and hydrogen bonding behavior of ammonia ice under high pressure;30,31 little effort has been devoted to the electronic properties and the atomistic mechanism of phase transition.24 To this end, herein, we conducted first-principles calculations on ammonia ice within the pressure range of 0–500 GPa to explore the structural evolution and underlying mechanism from the electronic structure point of view. Deep understanding of the atomic structures and electronic properties of ammonia ice not only sheds light on the study of high-pressure science but also motivates exploration of the nature of giant planets.
2. Structures and computational methods
According to previous studies, the stable crystalline structures of ammonia ice in the pressure range of 0–500 GPa are P213, P212121, Pma2 and Pca21 phases, as proposed by experiments,13,17,22,25 and P21/m and Pnma phases, as predicted by DFT calculations.7 The unit cells of these six phases were simulated as initial structures under pressure. As shown in Fig. 1, phases P213, P212121, Pma2, P21/m and Pnma are composed of four NH3 molecular units per unit cell, while Pca21 is composed of eight. The lattice constants (a, b, c) of these structures are on the order of several angstroms. The lattice parameters and atomic positions of these six phases reported by Pickard et al.7 and Ninet et al.22 were fully taken into account to generate the input structures, and the Cambridge Sequential Total Energy Package (CASTEP) was used to perform the DFT calculations.32 The Perdew–Burke–Ernzerhof (PBE) parameterization within the generalized gradient approximation (GGA) was adopted to describe the exchange and correlation interactions.33 The interactions of the ion core and electrons were treated by norm-conserving pseudopotentials.34 An empirical dispersion correction by Grimme's scheme (PBE-D2) was adopted to describe the non-covalent interactions in these hydrogen-bonded systems.35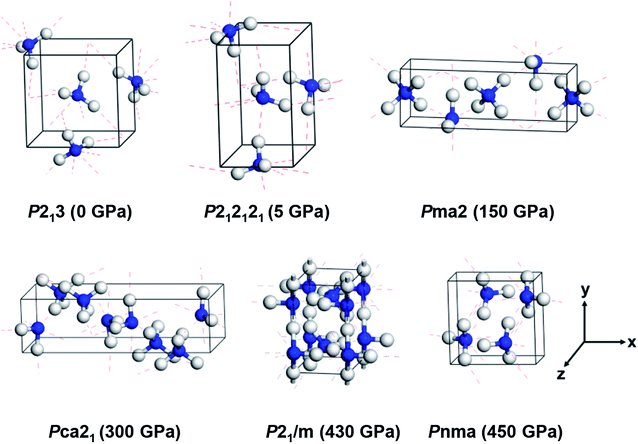 | ||
| Fig. 1 Crystal structures of six ammonia ice phases under various pressures. The blue and white balls indicate nitrogen and hydrogen atoms, respectively. The red dashed lines denote hydrogen bonds. | ||
Here, we used the norm-conserving pseudopotentials for H 1s1 and N 2s22p3 so that 8 electrons in each NH3 molecule were treated self-consistently in the DFT calculations. An energy cutoff of 600 eV was used for the geometry optimization and electronic structure calculations. The Brillouin zones were sampled by k-point grids with a uniform spacing of 2π × 0.04 Å−1 for all calculations.36 Under the setting pressure each time, the crystal structures of ammonia ice were fully relaxed for the ionic and electronic degrees of freedom using the convergence criteria of 1 × 10⁻⁶ for the electronic energy and 10−2 eV Å−1 for the forces on each atom. The hydrostatic pressure was one third of the trace of the stress tensor. When a value was specified here, the diagonal elements of the stress tensor were modified to leave the anisotropic terms unchanged. Hydrostatic compressions were applied from 0 to 500 GPa with a step of 20 GPa, whereas a step of 2 GPa was adopted near the phase-transition point.
It is well known that the PBE functional unusually underestimates the band gap of an insulator. To obtain more credible and accurate electronic band structures, we used the screened hybrid functional of Heyd, Scuseria and Ernzerhof (HSE06) based on the PBE geometries.37 Moreover, the partial charge densities and parital covalent bonds were evaluated by Mulliken charge and bond order analysis using the PBE functional.38
3. Results and discussion
3.1 Crystal structures and phase transitions
First, we investigated the structures of six ammonia crystals at different pressures within a range of 0–500 GPa; here, we discuss the effects of pressure on the crystal structures. As shown in Fig. 1, three structures of ammonia ice, P213, P212121 and Pnma, present molecular crystals containing four NH3 molecules per unit cell (Z = 4), in which each N atom forms three hydrogen bonds with the H atoms on adjacent NH3 molecules in a range of 1.38–2.25 Å (for details, see Table 1). Specifically, the P213 phase exhibits a cubic structure at 0 GPa with a lattice constant of 4.94 Å, covalent bond lengths between the N and H atoms (dN–H) of 1.03 Å and an H–N–H angle (θ) of 107.82°, which are very close to the experimental values of 5.04 Å, 1.01 Å and 107.52°, respectively.14 The P212121 phase has the lattice parameters of a = 3.18 (3.25) Å, b = 5.22 (5.66) Å, c = 5.43 (5.36) Å, and dN–H = 1.03 (∼1.01) Å and an average H–N–H angle (θ) of 106.49° (∼107.8°) under 5 GPa (the values in the parentheses are experimental values).17 Moreover, the Pnma phase is a high-pressure phase (P = 450 GPa) with an orthorhombic lattice, which was predicted by Pickard et al.7 and has not been observed experimentally. The existence of Pnma phase under high pressure may be due to the short covalent bonds of 0.98 Å and strong distortions of the H–N–H bond angle of 108.7°, which achieve a smaller volume (see Table 1).| Structure | P (GPa) | a (Å) | b (Å) | c (Å) | dN–H (Å) | dN–H⋯N (Å) | θ (°) |
|---|---|---|---|---|---|---|---|
| P213 | 0 | 4.94 | 4.94 | 4.94 | 1.03 | 2.25 | 107.82 |
| P212121 | 5 | 3.18 | 5.22 | 5.43 | 1.03 | 2.03 | 106.49 |
| Pma2 | 150 | 7.16 | 2.46 | 2.46 | 1.03 | 1.45 | 108.63 |
| Pca21 | 300 | 8.09 | 2.27 | 3.70 | 1.02 | 1.24 | 105.19 |
| P21/m | 430 | 2.22 | 3.61 | 3.80 | 1.01 | 1.32 | 105.67 |
| Pnma | 450 | 3.74 | 3.63 | 2.16 | 0.98 | 1.38 | 108.70 |
We then considered three ionic crystal structures, namely Pma2, Pca21 and P21/m. The Pma2 ionic phase consists of alternate layers of NH4+ and NH2− ions (Z = 4) under 150 GPa, in which the lattice constants of a = 7.16 Å and b = c = 2.46 Å are highly consistent with a previous experimental characterization with lattice parameters of 7.13, 2.44 and 2.44 Å, respectively.22 Similarly, Pca21 is composed of an eight-NH3 formula (Z = 8) by NH4+ and NH2− ions at 430 GPa forming zig-zag chains with a = 8.09 Å, b = 2.27 Å and c = 3.70 Å; these values compare reasonably to the experimental values of 8.66, 2.47 and 4.01 Å, respectively.22 In addition, the ionic phase P21/m shows a buckled layer at 300 GPa (see Fig. 1), which is close to theoretical predictions but has not been obtained in experiments.7 In short, our computational results could reproduce the experimental and theoretical structures of ammonia ice at different pressures, further indicating that the current PBE + D2 scheme gives reasonable descriptions of the lattice structures of ammonia ice and reveals consistent trends of structural change towards denser packing with increasing pressure.
To gain general insight into the effects of pressure on the structures of ammonia ice, we examined the pressure-induced variations of the structural parameters in the six phases. For simplicity, the geometrical parameters of the P213 and Pma2 phases are summarized in Table 2 as representatives of the molecular and ionic phases found experimentally. It can be seen that the N–H covalent bond lengths (dN–H) and intermolecular hydrogen bonding distances (dN–H⋯N) of P213 phase gradually decrease from 1.03 Å and 2.25 Å to 0.97 Å and 1.33 Å with increasing pressure up to 500 GPa, respectively. Similarly, dN–H and dN–H⋯N in Pma2 phase also decrease as the pressure increases, that is, from 1.07 Å and 1.98 Å to 0.98 Å and 1.20 Å, respectively. Contrarily, with increasing pressure, the H–N–H angles (θ) of P213 and Pma2 increase from 107.82° and 107.31° at 0 GPa to 117.45° and 110.19° at 500 GPa, respectively. For comparison, the geometrical parameters of the other phases can be found in the ESI (Table S1†). Overall, the intramolecular N–H covalent bond lengths and intermolecular hydrogen bond lengths of all phases decrease with increasing pressure.
| Structure | P (GPa) | a (Å) | b (Å) | c (Å) | dN–H (Å) | dN–H⋯N (Å) | θ (°) |
|---|---|---|---|---|---|---|---|
| P213 | 0 | 4.94 | 4.94 | 4.94 | 1.03 | 2.25 | 107.82 |
| 5 | 4.49 | 4.49 | 4.49 | 1.03 | 2.11 | 109.34 | |
| 15 | 4.27 | 4.27 | 4.27 | 1.03 | 2.02 | 110.07 | |
| 100 | 3.64 | 3.64 | 3.64 | 1.01 | 1.65 | 113.43 | |
| 500 | 3.06 | 3.06 | 3.06 | 0.97 | 1.33 | 117.45 | |
| Pma2 | 0 | 8.16 | 3.47 | 3.52 | 1.07 | 1.98 | 107.31 |
| 5 | 8.06 | 3.18 | 3.18 | 1.07 | 1.87 | 107.56 | |
| 15 | 7.93 | 3.01 | 3.00 | 1.05 | 1.79 | 107.83 | |
| 100 | 7.31 | 2.55 | 2.55 | 1.03 | 1.52 | 108.62 | |
| 500 | 6.30 | 2.14 | 2.14 | 0.98 | 1.20 | 110.19 |
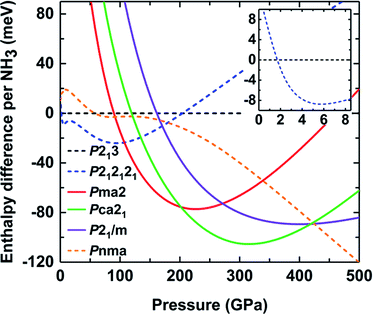
To elucidate the existence of ammonia ice at different pressures, the relative enthalpy of ammonia ice was defined as the difference between the enthalpy of an ammonia phase and that of phase I with the P213 space group, which is the most stable cubic structure at low temperature and pressure.13,14 As shown in Fig. 2, the P213 phase would transform to P212121 phase at about 2 GPa, which is lower than the experimentally observed value of about 4 GPa.17,18 A similar underestimation was found in a previous DFT study using the PBE functional and G06 dispersion correction.24 With increasing pressure, the molecular phase P212121 transforms into ionic phase Pma2 at 100 GPa, while the experimentally observed phase transition occurs at pressures of about 130 and 150 GPa.22,25 This discrepancy can be partly ascribed to the neglect of the entropy contributions in the DFT calculations of the phase transition.22 When the pressure is raised to about 190 GPa, the Pma2 phase to Pca21 phase transition takes place, as also predicted by previous calculations.22 Continuous compression up to approximately 425 GPa can produce the transiently stable phase P21/m; however, it rapidly recovers to the molecular structure phase Pnma when the pressure increases to 430 GPa. The ionic phase of ammonia ice could not persist up to 430 GPa, which reasonably coincides with previous studies.7,24
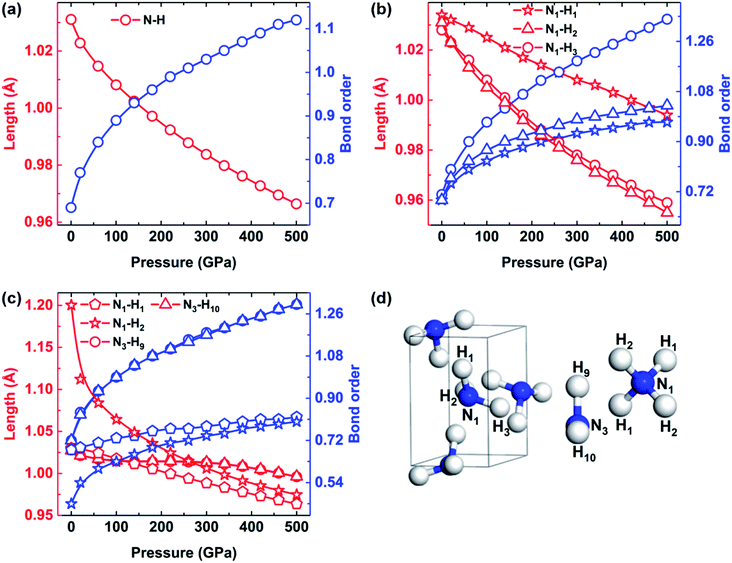
As discussed above, our calculations also revealed a pressure-induced transition from molecular phase to an ionic phase consisting of NH4+ and NH2− in ammonia ice at pressures greater than 100 GPa. Previous studies successively observed the phenomenon of proton jumping during the phase transition from molecular phase to ionic phase using ab initio molecular dynamics (AIMD) simulations and X-ray diffraction.21,23 Their results enhanced our understanding of the properties of the middle ice layers of Uranus and Neptune. However, they did not analyze this process in terms of structural behavior, including changes in bond order, lengths and angles, which were considered in this work. To illustrate the pressure dependence of the structural behavior of ammonia ice, the N–H bond lengths and corresponding bond orders of P213, P212121 and Pma2 phases are plotted in Fig. 3. The intramolecular N–H bonds are gradually shortened, whereas the bond orders of the N–H bonds increase as the pressure increases from 0 to 500 GPa. Especially, the N1–H2 and N1–H3 bonds of P212121 phase exhibit nearly identical reductions with increasing pressure, whereas the N1–H1 bond length decreases very slowly with increasing pressure, as shown in Fig. 3(b). Moreover, the bond order of the N1–H1 bond is always the weakest one in P212121 phase with increasing pressure. As shown in Fig. 3(c), the N1–H2 bond length of Pma2 phase is 1.2 Å at 0 GPa, which is much longer than the other three types of bonds (∼1.03 Å). With increasing pressure, the bond lengths between N1 and H2 decrease rapidly and tend to approach the N1–H1 bond lengths.
Table 3 lists the intermolecular hydrogen bond lengths and the N–H⋯N angles of P212121 and Pma2 phases. Remarkably, the intermolecular hydrogen bonds N1⋯H1 in P212121 phase decrease from about 2.21 Å at 0 GPa to 1.55 Å at 100 GPa with a noticeable 0.88 Å reduction of amplitude, which gradually approaches the 1.2 Å N1–H2 bond length of Pma2 at 0 GPa. Moreover, the N1–H1⋯N1 angles of P212121 phase increase from 168.54° to 169.59°, whereas the two other angles decrease with increasing pressure. In brief, we speculate that the N1–H1 bonds are broken and the intermolecular hydrogen bonds between H1 and N1 atoms become shorter with increasing pressure up to 100 GPa, when the H1 atoms instantly bond with N1 atoms on the adjacent NH3 molecules, thereby triggering the phase transition from molecular phase P212121 to ionic phase Pma2.
| P (GPa) | d1N–H⋯N (Å) | d2N–H⋯N (Å) | d3N–H⋯N (Å) | θ1 (°) | θ2 (°) | θ3 (°) |
|---|---|---|---|---|---|---|
| 0 | 2.21 | 2.34 | 2.51 | 168.54 | 148.90 | 165.93 |
| 5 | 2.03 | 2.17 | 2.26 | 168.21 | 149.38 | 162.46 |
| 15 | 1.90 | 2.04 | 2.05 | 167.84 | 149.52 | 160.87 |
| 100 | 1.55 | 1.68 | 1.64 | 169.86 | 150.38 | 157.28 |
| 500 | 1.24 | 1.34 | 1.34 | 169.59 | 145.92 | 158.99 |
3.2 Electronic structures
Based on the equilibrium structures of the ammonia phases, we now discuss the electronic structures of ammonia ice. Here, the molecular phase P213, which is stable at 0 GPa, and the ionic phase Pma2, which has been detected experimentally at 120 GPa, were selected as representatives to analyze the electronic properties of ammonia under high pressure. Mulliken population analysis reveals the trends of the pressure-induced changes in bond strength and charge transfer in ammonia ice, as summarized in Tables 4 and S1.† Overall, as the pressure increases, the on-site charges of the N atoms decrease whereas the on-site charges of the H atoms increase, and the bond orders of each phase are enhanced. As shown in Table 4, the changes in the charge transfer and bond order are more pronounced in the low pressure region. The P213 phase involves a higher bond order of 1.12 at 500 GPa than 0.69 at 0 GPa, accompanied by charge transfers of 0.70|e| and 1.11|e| from H to N atoms per NH3 molecule, respectively. The average values of charge transfer between N and H atoms of Pma2 phase are 1.10|e| to 0.76|e| with corresponding bond orders of 0.64 to 1.10 as the pressure increases from 0 to 500 GPa. A consistent trend of decreased charge transfer was also found in the Hirshfeld charge analysis, as given in Tables S3 and S4.†| Structure | P (GPa) | QN (e) | BO |
|---|---|---|---|
| P213 | 0 | −1.11 | 0.69 |
| 5 | −1.05 | 0.73 | |
| 13 | −1.01 | 0.76 | |
| 100 | −0.86 | 0.89 | |
| 500 | −0.70 | 1.12 | |
| Pma2 | 0 | −1.01 | 0.64 |
| 5 | −0.98 | 0.68 | |
| 15 | −0.95 | 0.71 | |
| 100 | −0.86 | 0.84 | |
| 500 | −0.76 | 1.01 |
The charge variation described above is also visible when gauging the changes in the charge density distribution, as plotted in Fig. 4. The H atoms of ammonia ice in P213 and Pma2 phases interact not only with the N atoms within the same group (NH3, NH4+ or NH2−) but also partly with N atoms from the nearest neighbors, which participate in intermolecular hydrogen bonding. Evidently, the intramolecular covalent bonds between N and H atoms and the intermolecular hydrogen bonds are enhanced with increasing pressure. At zero pressure, the charge density is localized only on individual NH3 molecules in P213 phase or on NH4+ and NH2− ions in Pma2 phase. Under high pressures beyond ∼50 GPa, the charge density overlaps obviously between the molecules or ionic groups, indicating partial sharing of charge. Similar phenomena of the charge densities of the other phases can be found in the ESI (Fig. S1†).
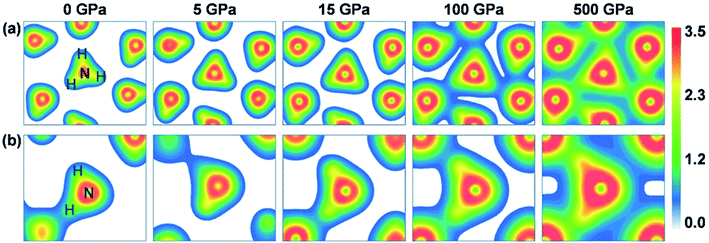 | ||
| Fig. 4 The charge density distributions in the (111) crystalline plane of the P213 (top panels) and Pma2 (bottom panels) phases under pressures of 0, 5, 15, 100 and 500 GPa. | ||
The redistribution of charge density is accompanied by changes in the electronic levels of ammonia ice. Fig. 5 displays the densities of states of the P213 and Pma2 phases, where the 1s states of the H atoms contribute mostly to the conduction bands at 0 GPa while the 2p states of N atoms dominate the valence bands near the Fermi level. This indicates that these two states play irreplaceable roles in the electronic properties of the P213 and Pma2 phases of ammonia ice. With increasing pressure, the contribution of the 2p state of the N atom to the conduction band increases significantly before 50 GPa, indicating that the hybridization between the H 1s and N 2p orbitals is enhanced; for details, see Fig. S2.† The stronger hybridization of the H 1s and N 2p orbitals raises the energy of the anti-bonding states (CBM), leading to an increase in the gaps of ammonia ice with increasing pressure. When the pressure further increases, two partial valence bands near the Fermi level become continuous and broadened, which leads to a reduction of the gaps of ammonia ice. The above-discussed changes can be also found in other phases of ammonia ice, as shown in Fig. S3 and S4.†
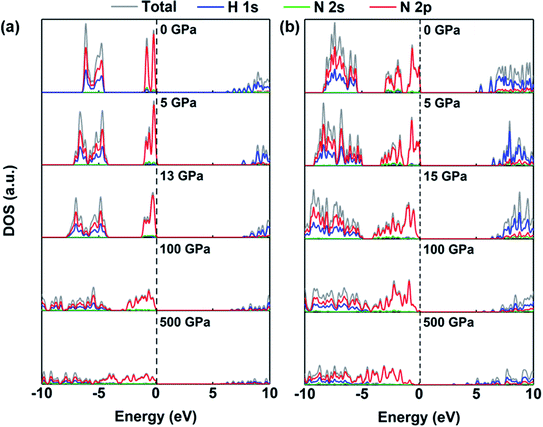 | ||
| Fig. 5 The densities of states (DOS) of (a) P213 phase and (b) Pma2 phase under various pressures (0, 5, Pc, 100 and 500 GPa). | ||
In addition, the pressure-induced variation of the band gap of ammonia ice is depicted in Fig. 6. The band gaps of all six phases show similar variations with increasing pressure, that is, the band gaps increase rapidly to the maximum values at the critical pressure (Pc) and then decrease slowly as the pressure increases further. The variation of the ammonia ice band gap with increasing pressure can be ascribed to two competition effects: (1) the enhanced hybridization between the H 1s and N 2p states raises the anti-bonding energy, which causes a wider opening of the bandgap, and (2) the compression leads to charge overlap of the ammonia ice, resulting in reduction of the bandgap. The Pc values for P213, P212121, Pma2, Pca21, P21/m and Pnma phases are 13, 30, 15, 40, 40 and 40 GPa, respectively, which are in line with a previous report.24
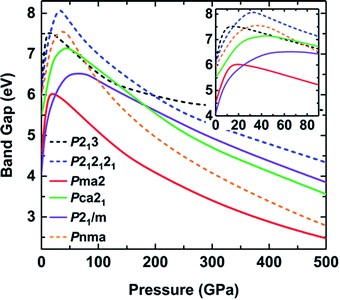 | ||
| Fig. 6 Band gaps of various phases as a function of pressure calculated with the HSE06 functional. Solid lines correspond to ionic structures and dashed lines correspond to molecular structures. | ||
The electronic properties of compressed ammonia ice can be further analyzed by its band structures, as plotted in Fig. 7, S5 and S6.† The results indicate that both the molecular and ionic phases are insulators, with wide band gaps ranging between 4.08 eV and 6.08 eV at zero pressure. The P213, Pma2, Pca21 and Pnma phases have direct band gaps at the Γ point, whereas the P212121 and P21/m phases exhibit indirect band gaps at 0 GPa. The band structure of ammonia ice exhibits a conversion between the direct and indirect band gap (for details see Fig. 7, S5 and S6†). For example, at high pressure, the P213 phase exhibits an indirect bandgap with the CBM at the Γ point and the VBM at the R point, while the Pma2 phase has an indirect band gap with the CBM at the U point and the VBM at the Γ point.
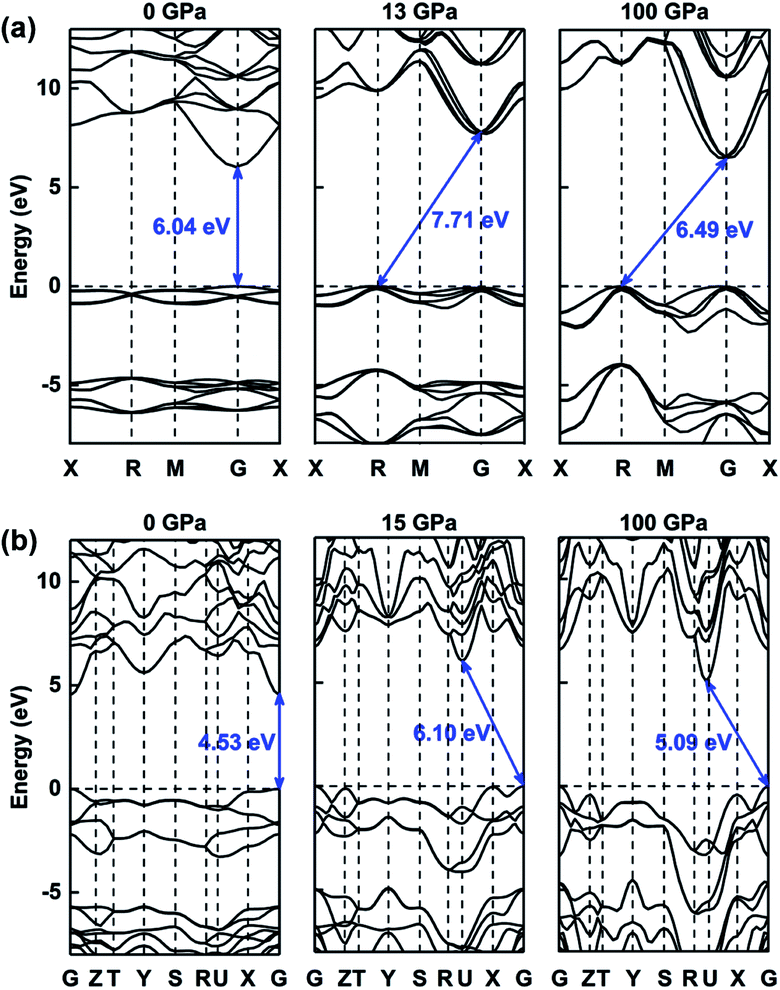 | ||
| Fig. 7 The band structures of (a) P213 phase and (b) Pma2 phase under various pressures (0 GPa, 13 GPa or 15 GPa, and 100 GPa). | ||
4. Conclusion
In summary, we have performed systematical DFT calculations to investigate the pressure-induced changes in the structural and electronic properties of ammonia ice within a wide pressure range of 0 GPa to 500 GPa. We demonstrate how the pressure induces a phase transition between molecular and ionic phases, which is identified by the variation of the N–H bond lengths and the corresponding bond order. That is, the H atom bonds to the N atom of adjacent NH3, leading to the phase transformation from the molecular phase P212121 to the ionic phase Pma2. According to the electronic band structures of ammonia ice, the bandgaps of all six phases increase rapidly and then decrease gradually with increasing pressure. The occurrence of this change is accompanied with increased anti-bonding energy and partial charge overlap. Analysis of the density of states and electron density reveals that this phenomenon is driven by the enhanced hybridization between the H 1s and N 2p states and the widening of the energy bands under compression. Our work represents a vital step toward understanding the behavior of ammonia ice under extreme conditions and provides theoretical support for the knowledge of planetary matters.Conflicts of interest
There are no conflicts to declare.Acknowledgements
This work was supported by the Science Challenge Project (Grant No. TZ2016001), the National Natural Science Foundation of China (Grant No. 11674046), and the Supercomputing Center of Dalian University of Technology.References
- R. Lan, J. T. S. Irvine and S. Tao, Int. J. Hydrogen Energy, 2012, 37, 1482–1494 CrossRef CAS.
- A. Valera-Medina, H. Xiao, M. Owen-Jones, W. I. F. David and P. J. Bowen, Prog. Energy Combust. Sci., 2018, 69, 63–102 CrossRef.
- T. Owen, Icarus, 1969, 10, 355–364 CrossRef CAS.
- D. D. Sasselov, Nature, 2008, 451, 29–31 CrossRef CAS PubMed.
- W. B. Hubbard, Science, 1981, 214, 145–149 CrossRef CAS PubMed.
- S. Ninet and F. Datchi, J. Chem. Phys., 2008, 128, 154508–154513 CrossRef CAS PubMed.
- C. J. Pickard and R. J. Needs, Nat. Mater., 2008, 7, 775–779 CrossRef CAS PubMed.
- C. Ma, F. Li, Q. Zhou, F. Huang, J. Wang, M. Zhang, Z. Wang and Q. Cui, RSC Adv., 2012, 2, 4920–4924 RSC.
- J. Sun, B. K. Clark, S. Torquato and R. Car, Nat. Commun., 2015, 6, 8156–8163 CrossRef CAS.
- Y. Huang, C. Zhu, L. Wang, X. Cao, Y. Su, X. Jiang, S. Meng, J. Zhao and X. C. Zeng, Sci. Adv., 2016, 2, 1501010–1501017 CrossRef PubMed.
- X. Jiang, X. Wu, Z. Zheng, Y. Huang and J. Zhao, Phys. Rev. B, 2017, 95, 144104–144112 CrossRef.
- I. Olovsson and D. H. Templeton, Acta Crystallogr., 1959, 12, 832–836 CrossRef CAS.
- J. W. Reed and P. M. Harris, J. Chem. Phys., 1961, 35, 1730–1737 CrossRef CAS.
- A. W. Hewat and C. Riekel, Acta Crystallogr., Sect. A: Found. Crystallogr., 1979, 35, 569–571 CrossRef.
- J. Eckert, R. L. Mills and S. K. Satija, J. Chem. Phys., 1984, 81, 6034–6038 CrossRef.
- R. B. V. Dreele and R. C. Hanson, Acta Crystallogr., Sect. C: Cryst. Struct. Commun., 1984, 40, 1635–1638 CrossRef.
- J. S. Loveday, R. J. Nelmes, W. G. Marshall, J. M. Besson, S. Klotz and G. Hamel, Phys. Rev. Lett., 1996, 76, 74–77 CrossRef CAS PubMed.
- F. Datchi, S. Ninet, M. Gauthier, A. M. Saitta, B. Canny and F. Decremps, Phys. Rev. B: Condens. Matter Mater. Phys., 2006, 73, 174111–174115 CrossRef.
- M. Gauthier, P. Pruzan, J. C. Chervin and J. M. Besson, Phys. Rev. B: Condens. Matter Mater. Phys., 1988, 37, 2102–2115 CrossRef CAS PubMed.
- S. Ninet, F. Datchi, S. Klotz, G. Hamel, J. S. Loveday and R. J. Nelmes, Phys. Rev. B: Condens. Matter Mater. Phys., 2009, 79, 100101–100104 CrossRef.
- S. Ninet, F. Datchi and A. M. Saitta, Phys. Rev. Lett., 2012, 108, 165702–165706 CrossRef CAS.
- S. Ninet, F. Datchi, P. Dumas, M. Mezouar, G. Garbarino, A. Mafety, C. J. Pickard, R. J. Needs and A. M. Saitta, Phys. Rev. B: Condens. Matter Mater. Phys., 2014, 89, 174103–174109 CrossRef.
- C. Cavazzoni, G. L. Chiarotti, S. Scandolo, E. Tosatti, M. Bernasconi and M. Parrinello, Science, 1999, 283, 44–46 CrossRef CAS PubMed.
- G. I. G. Griffiths, R. J. Needs and C. J. Pickard, Phys. Rev. B: Condens. Matter Mater. Phys., 2012, 86, 144102–144107 CrossRef.
- T. Palasyuk, I. Troyan, M. Eremets, V. Drozd, S. Medvedev, P. Zaleski–Ejgierd, E. Magos–Palasyuk, H. Wang, S. A. Bonev, D. Dudenko and P. Naumov, Nat. Commun., 2014, 5, 3460–3466 CrossRef PubMed.
- J.-A. Queyroux, S. Ninet, G. Weck, G. Garbarino, T. Plisson, M. Mezouar and F. Datchi, Phys. Rev. B, 2019, 99, 134107–134115 CrossRef CAS.
- S. T. Ceyer, P. W. Tiedemann, B. H. Mahan and Y. T. Lee, J. Chem. Phys., 1979, 70, 14–17 CrossRef CAS.
- C. A. Morrison and M. M. Siddick, Chem.–Eur. J., 2003, 9, 628–634 CrossRef CAS PubMed.
- M. J. Gillan, D. Alfè, J. Brodholt, L. Vočadlo and G. D. Price, Rep. Prog. Phys., 2006, 69, 2365–2441 CrossRef CAS.
- A. D. Fortes, J. P. Brodholt, I. G. Wood and L. Vočadlo, J. Chem. Phys., 2003, 118, 5987–5994 CrossRef CAS.
- M. Bethkenhagen, M. French and R. Redmer, J. Chem. Phys., 2013, 138, 234504–234512 CrossRef PubMed.
- S. J. Clark, M. D. Segallii, C. J. Pickardii, P. J. Hasnipiii and M. I. J. Probertiv, Z. Kristallogr., 2005, 220, 567–570 CAS.
- J. P. Perdew, K. Burke and M. Ernzerhof, Phys. Rev. Lett., 1996, 77, 3865–3868 CrossRef CAS PubMed.
- D. R. Hamann, M. Schlüter and C. Chiang, Phys. Rev. Lett., 1979, 43, 1494–1497 CrossRef CAS.
- S. Grimme, J. Comput. Chem., 2006, 27, 1787–1799 CrossRef CAS PubMed.
- H. J. Monkhorst and J. D. Pack, Phys. Rev. B: Condens. Matter Mater. Phys., 1976, 13, 5188–5192 CrossRef.
- J. Heyd, G. E. Scuseria and M. Ernzerhof, J. Chem. Phys., 2003, 118, 8207–8215 CrossRef CAS.
- R. S. Mulliken, J. Chem. Phys., 1955, 23, 1841–1846 CrossRef CAS.
Footnote |
| † Electronic supplementary information (ESI) available. See DOI: 10.1039/d0ra03248d |
| This journal is © The Royal Society of Chemistry 2020 |

