DOI:
10.1039/D0RA04004E
(Paper)
RSC Adv., 2020,
10, 28550-28559
Electrochemical performance of Li+ insertion/extraction in Ni-substituted ZnCo2O4 as an emerging highly efficient anode material
Received
3rd May 2020
, Accepted 17th July 2020
First published on 3rd August 2020
Abstract
With the industrial revolution in electronics, the demand for lithium-ion batteries, particularly those designed for electric vehicles and energy storage systems, has accelerated in recent years. This continuously increasing demand requires high-performance electrode materials, as commonly used graphite anodes show limited lithium intercalation. In this context, Ni-substituted ZnCo2O4 nanostructures, thanks to their high storage capacity, have potential for use as an anode material in lithium-ion batteries. Structural analysis concludes that the prepared materials show improved crystallinity with increasing Ni at the Zn-site in ZnCo2O4. The intermediate composition, Zn0.5Ni0.5Co2O4, of this series exhibits a specific capacity of 65 mA h g−1 at an elevated current rate of 10 A g−1. The lithium insertion/extraction mechanism is investigated via cyclic voltammetry, showing two redox peaks from ZnCo2O4 and a single redox peak from NiCo2O4. Additionally, the lithium diffusion coefficient in the prepared electrodes is computed to be 2.22 × 10⁻¹² cm2 s−1 for the intermediate composition, as obtained using cyclic voltammetry. Electrochemical impedance spectroscopy is used to observe the charge transport mechanism and the charge transfer resistance values of all the samples, which are calculated to be in the range of 235 to 306 Ω.
1. Introduction
Regarding the continuously increasing requirement for energy and a decrease in non-renewable energy resources, for instance, fossil fuels, a serious energy crisis is imminent around the globe. Besides, the emission of different toxic gases, including CO and CO2, related to the use of fossil fuels is the key root of global warming.1 The solution to this problem lies in materializing energy-efficient and environment-friendly energy storage devices like supercapacitors, fuel cells, and batteries. As a result, lithium-ion batteries (LIBs) have attracted great research interest due to their extraordinary energy and power densities, improved charge–discharge capabilities, very little self-discharge, minimal maintenance, and environmentally friendly usage.2–4 The performance of LIBs is greatly influenced by different parameters, like temperature, surface area, diffusion coefficient and type of mechanism, as well as the electrode material used for charge storage.5,6 The initial LIB technologies were based on an intercalation mechanism using graphite and Li4Ti5O12 etc., as the intercalation compounds, but they were unable to cope with the increasing demands of high energy and power densities, at large scale, due to their low theoretical capacities.7,8 Thus, researchers have probed alternative charge storage mechanisms (e.g. conversion reactions and alloying) for LIBs in order to achieve high energy densities.
The conversion reaction mechanism of electrodes (cathode or anode) has been observed to deliver higher energy density and theoretical capacity. In recent years, considerable efforts have been made to enhance the performance of LIBs by using new electrode materials, involving conversion reactions, like hydroxides, sulfides, conductive polymers and transition metal oxides (TMOs).9,10 TMOs have been observed to be a good choice in this regard due to their high speculative specific capacity and excellent environmental compatibility. Above all, the spinel-based binary TMOs with a general formula of the form AB2O4 (A & B = cations) have been regarded as possible alternatives, thanks to their high electrical conductivity and viable oxidation states.11,12 Among these binary TMOs, ZnCo2O4 has been reflected as an effective electrode candidate for LIBs, mainly attributable to its natural abundance and high specific capacity, and the low-cost of the precursors involved. Furthermore, the lithium charge storage is enhanced because both Co and Zn are electrochemically active for lithium.13,14 However, the cyclic lithiation and de-lithiation processes induce drastic volume changes in ZnCo2O4 electrodes, thus deteriorating their rate performance and cyclability, and hindering their practical applications in LIBs.15,16
Several methods have been proposed to limit these volume changes and enhance the cycling performance of ZnCo2O4 electrodes. Decreasing the size of the electrode material, particularly in the range of nanometers, is an effective approach in this regard.17 Various structures of ZnCo2O4 electrodes have been prepared to date, including nanorods, nanoplates, nanoflowers, and nanosheets, showing a considerable increase in the electrochemical performance.18–20 The specific capacity of ZnCo2O4 electrodes can also be increased by substituting the A-site (Zn ion) in its cubic spinel structure with other transition metals. Among these transition metals, Ni is considered to serve this purpose efficiently. Ni effectively takes part in the conversion reaction and enhances the performance of the electrode material by providing more electroactive sites and a fast redox reaction owning to its multiple oxidation states.16 Thus, the substitution of Ni in ZnCo2O4 not only increases its cycling stability and specific capacity, but also decreases the diffusion path and drastic volume changes induced by the insertion/extraction of Li-ions during the charging/discharging process.21
In this study, we report a cost-effective and time-efficient approach to prepare Ni-substituted ZnCo2O4 nanostructures using a wet chemical route, named as the sol–gel self-ignition route. The incorporation of Ni into ZnCo2O4 did not affect the spinel structure of the host, but increased its electrochemical performance by increasing the redox reaction and active sites and hence shortening the diffusion path for Li-ions.
2. Experimental
Analytical grade stoichiometric amounts of metal nitrates (MNs) such as Zn(NO3)2·6H2O (purity ≥98.0, Sigma Aldrich), Ni(NO3)2·6H2O (purity ≥98.5, Sigma Aldrich) and Co(NO3)2·6H2O (purity ≥98.5, Sigma Aldrich) were used to prepare Zn1−xNixCo2O4 (x = 0.0, 0.25, 0.5, 0.75 and 1.0; hereafter referred to as ZNCO-0, ZNCO-25, ZNCO-50, ZNCO-75 and ZNCO-100, respectively) using the sol–gel self-ignition route. Citric acid (CA, C6H8O7, ≥99.5) was used as a fuel agent.
The transparent solutions of these MNs were first made separately, and were then mixed to produce the sol. During mixing, the ratio of MNs and CA was kept as 1![[thin space (1/6-em)]](https://www.rsc.org/images/entities/char_2009.gif) :
:![[thin space (1/6-em)]](https://www.rsc.org/images/entities/char_2009.gif) 2. The combined solution of MNs and CA was kept on a hot plate inside an ESCO fume hood for continuous heating and stirring. Initially, the temperature of the hot plate was adjusted at 95 °C with a stirring speed of 250 rpm. After 2 h, the solution became thick enough and started impeding the stirrer motion. At this stage, the stirrer was removed and the temperature was raised up to 250 °C in steps. After a few minutes, a self-ignition exothermic reaction occurred with the elimination of the gaseous content, which turned the gel into a fluffy powder. This powder was ground and pressed in the form of cylindrical pellets of diameter 10 mm with a thickness of around 1 mm. To ensure the phase development, these pellets were then sintered at 450 °C for 2 h. Fig. 1 reveals the flow chart of the synthesis scheme.
2. The combined solution of MNs and CA was kept on a hot plate inside an ESCO fume hood for continuous heating and stirring. Initially, the temperature of the hot plate was adjusted at 95 °C with a stirring speed of 250 rpm. After 2 h, the solution became thick enough and started impeding the stirrer motion. At this stage, the stirrer was removed and the temperature was raised up to 250 °C in steps. After a few minutes, a self-ignition exothermic reaction occurred with the elimination of the gaseous content, which turned the gel into a fluffy powder. This powder was ground and pressed in the form of cylindrical pellets of diameter 10 mm with a thickness of around 1 mm. To ensure the phase development, these pellets were then sintered at 450 °C for 2 h. Fig. 1 reveals the flow chart of the synthesis scheme.
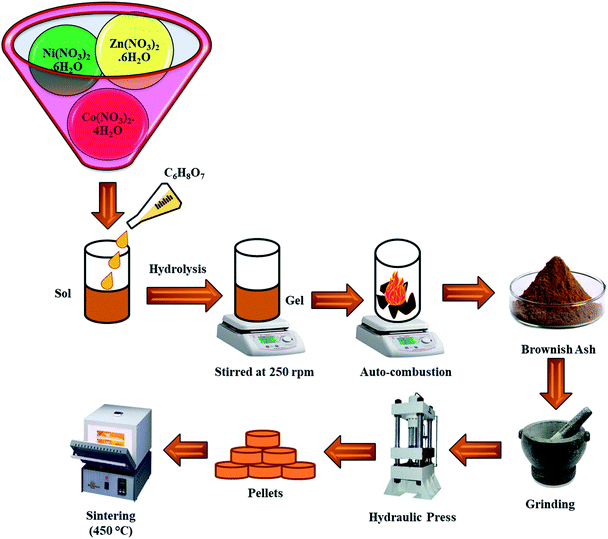 |
| | Fig. 1 A schematic flowchart of sample preparation. | |
The crystal structure of the prepared samples was confirmed using a Bruker D/8 Advanced X-ray diffractometer (XRD). Field emission scanning electron microscopy (FESEM, Nova NanoSEM-430) combined with Oxford instruments energy-dispersive X-ray spectroscopy (EDX) was used to examine the morphology and elemental composition. For electrochemical tests, the electrodes were prepared using poly(vinylidene), super P and active material in a ratio of 1![[thin space (1/6-em)]](https://www.rsc.org/images/entities/char_2009.gif) :
:![[thin space (1/6-em)]](https://www.rsc.org/images/entities/char_2009.gif) 2
2![[thin space (1/6-em)]](https://www.rsc.org/images/entities/char_2009.gif) :
:![[thin space (1/6-em)]](https://www.rsc.org/images/entities/char_2009.gif) 7 by weight. The above mixture was mixed with N-methyl pyrrolidone to obtain a homogeneous slurry for each electrode. The semi-liquid mixtures were cast on Cu foil and roll-pressed after drying. Coin-type (2032) cells were fabricated using vacuum dried working electrodes and lithium foil was used as the counter electrode. The electrolyte was made up of 1 M LiPF6 dissolved in ethylene carbonate and dimethyl carbonate in a volume ratio of 7
7 by weight. The above mixture was mixed with N-methyl pyrrolidone to obtain a homogeneous slurry for each electrode. The semi-liquid mixtures were cast on Cu foil and roll-pressed after drying. Coin-type (2032) cells were fabricated using vacuum dried working electrodes and lithium foil was used as the counter electrode. The electrolyte was made up of 1 M LiPF6 dissolved in ethylene carbonate and dimethyl carbonate in a volume ratio of 7![[thin space (1/6-em)]](https://www.rsc.org/images/entities/char_2009.gif) :
:![[thin space (1/6-em)]](https://www.rsc.org/images/entities/char_2009.gif) 3. The thickness of the electrode and loading of active material were ∼30 μm and 3 mg, respectively. The cells were stored together in a glove box filled with argon with water and oxygen concentrations of less than 0.1 ppm. Cyclic voltammetry (CV) and galvanostatic charge–discharge (GCD) measurements were carried out on a Biologic (VMP3) instrument.
3. The thickness of the electrode and loading of active material were ∼30 μm and 3 mg, respectively. The cells were stored together in a glove box filled with argon with water and oxygen concentrations of less than 0.1 ppm. Cyclic voltammetry (CV) and galvanostatic charge–discharge (GCD) measurements were carried out on a Biologic (VMP3) instrument.
3. Results and discussion
3.1. Structural analysis
The diffraction configurations of the ZNCO-0, ZNCO-25, ZNCO-50, ZNCO-75 and ZNCO-100 samples are shown in Fig. 2. From these XRD patterns we can determine the crystal system to which these compositions belong by calculating their lattice parameters. In the first sample, i.e. for ZNCO-0, the intensity peaks were observed at 2θ values of 31.21°, 36.86°, 38.50°, 44.80°, 55.62°, 59.39°, 65.20° and 67.82°, corresponding to the (220), (311), (222), (400), (422), (511), (440) and (531) planes, respectively. These diffracted peaks were matched with ICSD reference no. 00-023-1390, which confirmed the formation of the cubic spinel structure of ZnCo2O4 having space group Fd3m. The calculated value of the lattice parameter was 8.108 Å. It was observed that when Ni was substituted at the Zn site, it promoted the growth of pure spinel structure. The intensity of the peaks also increased, along with a reduction in the peak width, which was another indication of the increase of crystallinity with substitution of the contents. This also confirmed that the exothermic temperature obtained during the auto-combustion process was sufficient for the formation of a cubic spinel. When all of the Zn was replaced by Ni, then the diffraction pattern matched with ICSD reference no. 00-002-1074, which confirmed the formation of the cubic spinel phase of NiCo2O4. Here, the calculated lattice parameter was 8.128 Å. The crystallite size of the synthesized samples was calculated using Scherrer's formula. To apply this formula, we calculated the full width at half maxima (FWHM) of the highest intensity (311) peak and substituted it into 0.9λ/β![[thin space (1/6-em)]](https://www.rsc.org/images/entities/char_2009.gif) cos
cos![[thin space (1/6-em)]](https://www.rsc.org/images/entities/char_2009.gif) θ in the place of β. It was observed that the crystallite size decreased with increasing Ni content in ZnCo2O4 and it was the lowest for the intermediate composition, ZNCO-50, for which it was calculated to be 89.4 Å. However, further increase in the Ni content caused an increase in crystallite size. The variation of all of these structural factors with Ni-substitution is summarized in Table 1.
θ in the place of β. It was observed that the crystallite size decreased with increasing Ni content in ZnCo2O4 and it was the lowest for the intermediate composition, ZNCO-50, for which it was calculated to be 89.4 Å. However, further increase in the Ni content caused an increase in crystallite size. The variation of all of these structural factors with Ni-substitution is summarized in Table 1.
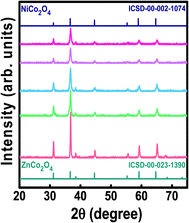 |
| | Fig. 2 XRD patterns of the Ni-doped ZnCo2O4 samples plotted along with reference patterns. | |
Table 1 Variation of the structural parameters (lattice constant, a; unit cell volume, V; and crystallite size, D) with Ni substitution in ZnCo2O4
| Parameter |
Sample name |
| ZNCO-0 |
ZNCO-25 |
ZNCO-50 |
ZNCO-75 |
ZNCO-100 |
| a (Å) |
8.161 |
8.165 |
8.171 |
8.173 |
8.174 |
| V (Å3) |
543.558 |
544.337 |
545.719 |
546.119 |
546.139 |
| D (Å) |
220.200 |
178.030 |
89.400 |
293.600 |
185.960 |
3.2 Morphological and elemental analysis
The surface morphology of the samples ZNCO-0, ZNCO-25, ZNCO-50, ZNCO-75 and ZNCO-100 was probed to get information about the grain size, shape, and their distribution in the samples. Similarly, the effect of increasing Ni content on the homogeneity and grain size distribution of the ZnCo2O4 samples was also observed by direct analysis.
Fig. 3(a–e) show the FESEM images of the ZNCO-0, ZNCO-25, ZNCO-50, ZNCO-75 and ZNCO-100 samples at a magnification of 200![[thin space (1/6-em)]](https://www.rsc.org/images/entities/char_2009.gif) 000×. The analysis of the FESEM images revealed the formation of highly dense, well-developed grains with a small agglomeration at the start. Initially, the grains were of random shape, which transformed into spherical shape with increasing Ni content. For ZNCO-0, the average grain size for the smaller grains, which were clearly visible, was found to be 90 nm and that of the larger grains was found to be 185 nm. As the Ni content increased, the agglomeration started to decrease, which resulted in a decrease of the grain size, owning to the increase in cohesive forces. For ZNCO-100, uniformly distributed spherical grains could be seen with the average grain size of about 60 nm. Thus, it was confirmed from the FESEM images that the substitution of Ni on the Zn-sites in Zn1−xNixCo2O4 decreased the distortion in the shape and size of the grains.
000×. The analysis of the FESEM images revealed the formation of highly dense, well-developed grains with a small agglomeration at the start. Initially, the grains were of random shape, which transformed into spherical shape with increasing Ni content. For ZNCO-0, the average grain size for the smaller grains, which were clearly visible, was found to be 90 nm and that of the larger grains was found to be 185 nm. As the Ni content increased, the agglomeration started to decrease, which resulted in a decrease of the grain size, owning to the increase in cohesive forces. For ZNCO-100, uniformly distributed spherical grains could be seen with the average grain size of about 60 nm. Thus, it was confirmed from the FESEM images that the substitution of Ni on the Zn-sites in Zn1−xNixCo2O4 decreased the distortion in the shape and size of the grains.
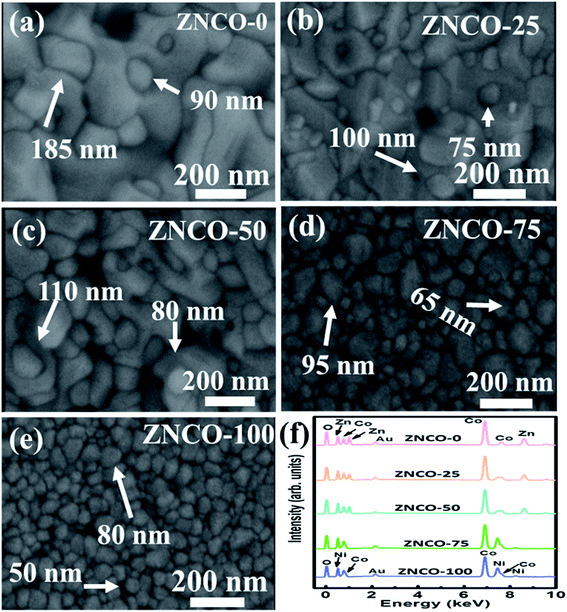 |
| | Fig. 3 (a–e) FE-SEM images of the Ni-doped ZnCo2O4 powder samples at 200![[thin space (1/6-em)]](https://www.rsc.org/images/entities/char_2009.gif) 000× magnification and (f) EDX spectra of the Ni-doped ZnCo2O4 samples. 000× magnification and (f) EDX spectra of the Ni-doped ZnCo2O4 samples. | |
Fig. 3(f) shows the EDX spectra of the synthesized samples, which confirmed the high purity of the formulated compositions as no major impurity peaks were detected except for a small peak for gold (Au) particles, which is attributed to the conductive coating done for performing FESEM. For ZNCO-0, all of the elements were observed to be in accordance with their stoichiometric amounts. With increasing Ni content, a peak for Ni was also introduced into the EDX spectra, which confirmed the complete replacement of Zn in the final sample, i.e. for ZNCO-100.
3.3 Cycling performance
The cycling performance of all the electrodes was measured at a high rate of 1 A g−1, as shown in Fig. 4. The measured specific values during the 1st and 100th cycles are shown in Table 2. It can be observed that the NCO-0 sample delivered the highest specific capacity of 575 mA h g−1, but suffers from the lowest retention of 61%. The ZNCO-50 electrode revealed the highest capacity retention of 75% after 100 cycles. Hence, the mixed nature of the ZNCO-50 electrode could have a synergistic effect for high cycling performance.
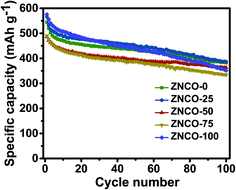 |
| | Fig. 4 Cycling performance testing of all electrodes at a current density of 1 A g−1. | |
Table 2 Specific capacity values of all electrodes during the 1st and 100th cycles
| Sample |
Capacity in 1st cycle (mA h g−1) |
Capacity in 100th cycle (mA h g−1) |
Retention (%) |
| ZNCO-100 |
544 |
382 |
70 |
| ZNCO-75 |
567 |
386 |
68 |
| ZNCO-50 |
487 |
363 |
75 |
| ZNCO-25 |
490 |
334 |
68 |
| ZNCO-0 |
575 |
351 |
61 |
3.4 Galvanostatic properties
Fig. 5 shows the galvanostatic charge–discharge (GCD) curves for the ZNCO-0, ZNCO-25, ZNCO-50, ZNCO-75, and ZNCO-100 electrodes during the first two cycles operating in a voltage window of 0.01–3.0 V and cycled at a current density of 0.1 A g−1. The ZNCO-0 electrode revealed a lithiation (discharge) capacity of 1230 mA h g−1 during the 1st cycle, as shown in Fig. 5(a), and these capacities are also shown in Table 3. This experimental value of the discharge capacity of the ZNCO-0 electrode surpassed its calculated capacity (867 mA h g−1). The extra capacity is credited to side reactions and the formation of a solid electrolyte interphase (SEI).22,23 The three plateaus appearing at 1.04, 0.91 and 0.45 V for the ZNCO-0 electrode correspond to the reduction of Zn2+ and Co3+ to their metallic states.24 The ZNCO-0 electrode showed a coulombic efficiency of 73% and a charge capacity of 897 mA h g−1 during the 1st cycle. Three plateaus were observed during the charge process at 1.3, 1.8, and 2.2 V, corresponding to the oxidation of Zn and Co.24 The coulombic efficiency was noticed to be 95% during the 2nd cycle, where high values of 930 and 880 mA h g−1 for the charge and discharge capacities were observed for the ZNCO-0 electrode, respectively. During the 1st cycle, the ZNCO-25 electrode showed charge and discharge capacities of 1252 and 931 mA h g−1 (Fig. 5(b)), corresponding to a coulombic efficiency of 74%. The coulombic efficiency was enhanced in subsequent cycles and it was recorded to be 97% during the 2nd cycle. This shows that the ZNCO-25 electrode has better lithium ion reversibility than the ZNCO-0 electrode. Furthermore, Ni doping also affected the discharge profile, which showed only two plateaus at 0.99 and 0.46 V. Fig. 5(c) shows the GCD curves of the ZNCO-50 electrode, which exhibited discharge and charge abilities of 1097 and 672 mA h g−1, respectively, in agreement with the coulombic efficiency of 61%. This equally mixed composition of Zn and Ni showed relatively low values for the coulombic efficiency and specific capacities. Furthermore, the discharge curve showed different features with a sudden sloping profile followed by another long plateau at 0.48 V. During the 2nd cycle, 94% coulombic efficiency was observed for the ZNCO-50 electrode, where the discharge and charge capabilities were noted as 676 and 637 mA h g−1, respectively. Fig. 5(d) shows the GCD of the ZNCO-75 electrode where the discharge capacity of 1067 mA h g−1 was recorded during the 1st cycle. The discharge profile of the ZNCO-75 electrode exhibited two plateaus at 0.97 and 0.6 V during the first cycle. The substance produced a high charge capacity of 722 mA h g−1, corresponding to a small coulombic efficiency of 68% in the 1st cycle. During the 2nd cycle, the ZNCO-75 electrode exhibited high discharge and charge capacities of 733 and 700 mA h g−1, respectively, with a better coulombic efficiency of 95%. The ZNCO-100 electrode showed two clear plateaus at 1.0 and 0.65 V, as shown in Fig. 5(e). The charge and discharge capacities for the ZNCO-100 electrode were 1198 and 894 mA h g−1, respectively, in the first cycle, corresponding to a coulombic efficiency of 75%. Interestingly, the ZNCO-100 electrode exhibited a long solo plateau through the charge process. An improved coulombic efficiency for the 2nd cycle of 97% was noted, and the electrode yields charge and discharge capacities of 918 and 890 mA h g−1, respectively. Overall, the ZNCO-0, ZNCO-25, and ZNCO-100 electrodes showed high specific capacities and the electrode with an equal ratio of Zn and Ni showed relatively low specific capacities during the 2nd cycle.
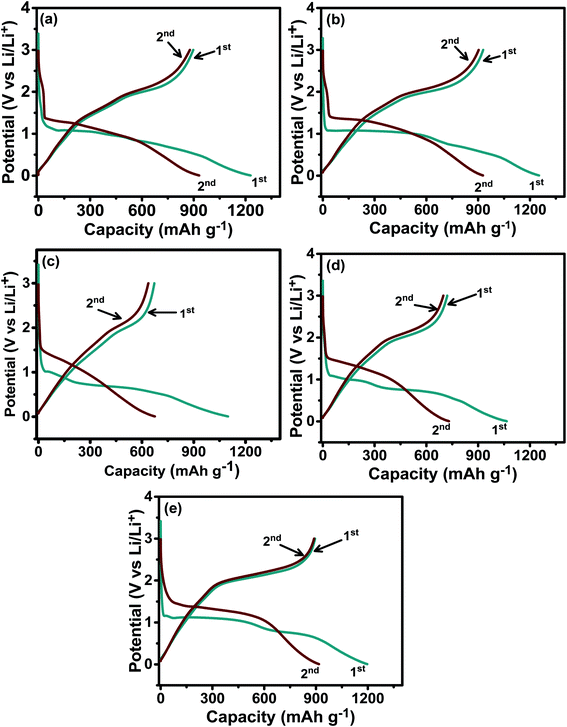 |
| | Fig. 5 Galvanostatic charge–discharge curves for the (a) ZNCO-0, (b) ZNCO-25, (c) ZNCO-50, (d) ZNCO-75, and (e) ZNCO-100 electrodes. | |
Table 3 Specific capacities, retention, and coulombic efficiencies of Ni-substituted ZnCo2O4
| Electrode |
Capacity (charge/discharge) 1st cycle (mA h g−1) |
Capacity (charge/discharge) 2nd cycle (mA h g−1) |
Coulombic efficiency 1st cycle % |
Coulombic efficiency 2nd cycle % |
| ZNCO-0 |
897/1230 |
880/930 |
73 |
95 |
| ZNCO-25 |
931/1252 |
904/928 |
74 |
97 |
| ZNCO-50 |
672/1097 |
637/676 |
61 |
94 |
| ZNCO-75 |
722/1067 |
700/733 |
68 |
95 |
| ZNCO-100 |
894/1198 |
890/918 |
75 |
97 |
A rate capability test was conducted for all of the prepared electrode materials in the voltage range of 0.01 to 3.0 V. The test was conducted every 10 cycles with the current rates of 0.1, 0.25, 0.50, 1.0, 2.0, 5.0, and 10 A g−1 as shown in Fig. 6. The delivered specific capacities of each electrode against the rate capabilities are shown in Table 4. In the low current density regime, i.e. 0.1 to 1.0 A g−1, the ZNCO-0, ZNCO-25, and ZNCO-100 electrodes exhibited higher capacities than the other compositions. Interestingly, at higher current rates of 2.0, 5.0, and 10.0 A g−1, the ZNCO-50 electrode exhibited relatively higher specific capacities, as shown in Table 4. All of the electrodes showed high coulombic efficiencies, revealing excellent lithium reversibility. Table 5 presents a comparison of the calculated values of specific capacity, and the significantly high value of specific capacity obtained in the present study shows the credibility of this work.
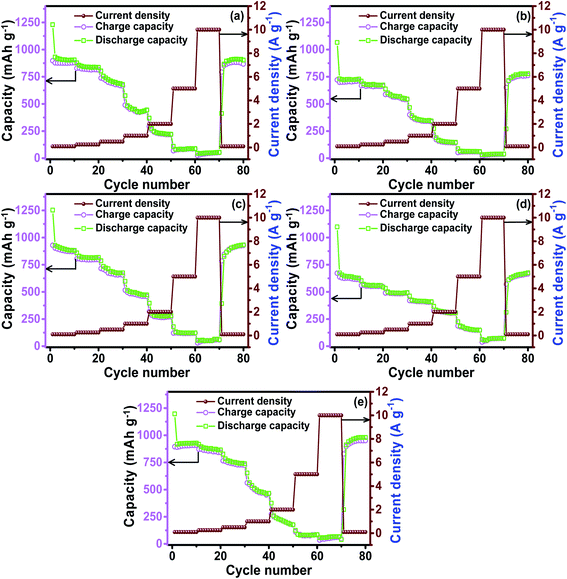 |
| | Fig. 6 Rate capability testing of the Ni-doped ZnCo2O4 electrodes: (a) ZNCO-0, (b) ZNCO-25, (c) ZNCO-50, (d) ZNCO-75 and (e) ZNCO-100. | |
Table 4 Specific capacities of Ni-substituted ZnCo2O4 electrodes at different rates
| Electrode |
Specific capacity (mA h g−1) at different current densities |
| 0.1 (A g−1) |
1 (A g−1) |
2 (A g−1) |
5 (A g−1) |
10 (A g−1) |
0.1 (A g−1) |
| ZNCO-0 |
912 |
470 |
250 |
80 |
45 |
885 |
| ZNCO-25 |
900 |
500 |
285 |
125 |
55 |
885 |
| ZNCO-50 |
660 |
420 |
325 |
165 |
65 |
630 |
| ZNCO-75 |
725 |
372 |
170 |
65 |
35 |
715 |
| ZNCO-100 |
916 |
512 |
240 |
80 |
60 |
910 |
Table 5 A comparison between the specific capacity and current density values of electrodes from the literature and this study (1st/100th cycle)
| Composition |
Capacity (mA h g−1) |
Current density (mA g−1) |
Reference |
| ZnCo2O4/C |
0.5 |
12 |
25 |
| ZnCo2O4 |
350 |
0.63 |
26 |
| ZnCo2O4 |
202 |
0.9 |
27 |
| NiCo2O4 |
200 |
1 |
28 |
| Zn0.5Ni0.5Co2O4 |
420/65 |
1/10 |
This work |
3.5 Cyclic voltammetry
Cyclic voltammetry (CV) was used to investigate the oxidation/reduction process and to calculate lithium diffusion in the electrodes. CV measurements were recorded for all of the samples in the potential window of 0.01–3.0 V at scan rates of 0.02, 0.05, 0.1, 0.5 and 1.0 mV s−1 and the resulting current vs. potential graphs are shown in Fig. 7. Two distinct oxidation and reduction peaks can be seen in the CV curves of the ZNCO-0, ZNCO-25, ZNCO-50, ZNCO-75, and ZNCO-100 electrodes, which belong to the reduction of Co3+ and Zn2+/Ni2+ to their metallic states.10,11 The difference between the CV curves of all the samples is shown in the insets of Fig. 7(a–e). The ZNCO-0 electrode showed a deep reduction peak at 1.1 V and a small peak at 0.89 V during the cathodic process, which belongs to the reduction of Co and Zn.13 In contrast, the anodic process showed oxidation peaks at 1.6 and 2.0 V, corresponding to the oxidation of Co and Zn. In the case of the ZNCO-25 electrode, the small reduction peak at 0.89 V vanishes and the peak at 1.1 V becomes sharper. The ZNCO-50 electrode showed the existence of two redox peaks, but the CV curves showed a larger area with less intense peaks compared to the ZNCO-0 and ZNCO-25 electrodes. This type of curve shows capacitive storage behavior, as also noticed in the GCD capacities. The ZNCO-75 electrode presented two reduction peaks at 1.2 and 1.0 V during the cathodic process. The shifting of the peaks toward higher potential is related to the excess of Ni in the composition. Similarly, the oxidation peak also revealed a slight shift toward higher potential recorded at 2.1 V. The ZNCO-100 electrode exhibited a single redox peak at 1.1/2.1 V and the shape of the CV curve reveals sharp peaks, which is similar to the reported literature. By increasing the scan rate, the reduction peaks shifted towards lower potentials, whereas the oxidation peaks shifted towards higher potentials, showing a fast charge–discharge process in all electrodes.
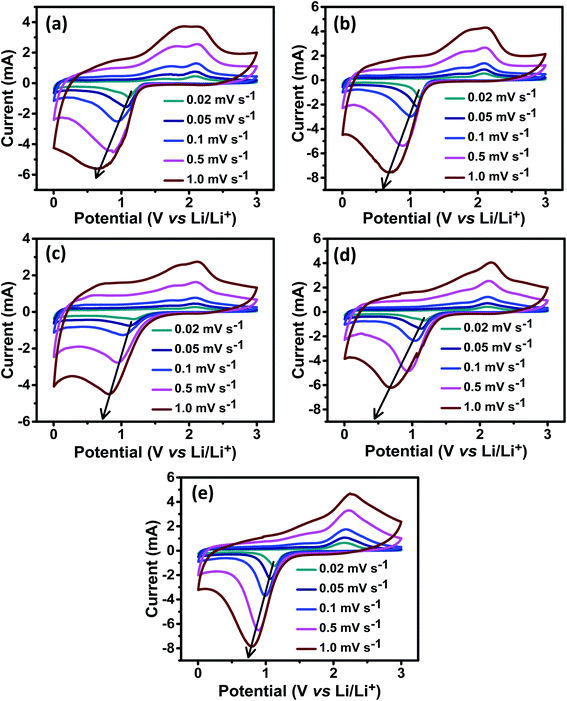 |
| | Fig. 7 Cyclic voltammetry graphs for the (a) ZNCO-0, (b) ZNCO-25, (c) ZNCO-50, (d) ZNCO-75, and (e) ZNCO-100 electrodes. | |
Based on some previous research, together with the present CV measurements, the reaction mechanism for the ZNCO-100 electrode and Li reactivity could be indicated by the following chemical reactions as reported by Wang et al. (2018).22
| | |
NiCo2O4 + 8Li+ + 8e− → Ni + 2Co + 4Li2O
| (1) |
| | |
Ni + Li2O ⇌ NiO + 2Li+ + 2e−
| (2) |
| | |
2Co + 2Li2O ⇌ 2Co2O3 + 4Li+ + 4e−
| (3) |
The lithium diffusion coefficient (DLi) was calculated from CV measurements by assuming that the diffusion process is a semi-/finite process in the electrode where the peak current is related to the square root of the scan rate as specified in Fig. 8. The DLi can be calculated using the Cottrell eqn as:
| | |
Ip = 2.69 × 10⁵ ACLiDLi1/2v1/2n3/2
| (4) |
where
A is the area of the electrode,
CLi is the concentration of Li ions, and
n is the number of electrons involved in the reaction. The resulting calculated
DLi is shown in
Table 6. The calculated values showed that pure ZNCO-0 has a relatively better Li
+ diffusivity. The
DLi of the electrode materials was found to be in the range of 3.11 × 10
−12 cm
2 s
−1 to 1.10 × 10
−13 cm
2 s
−1.
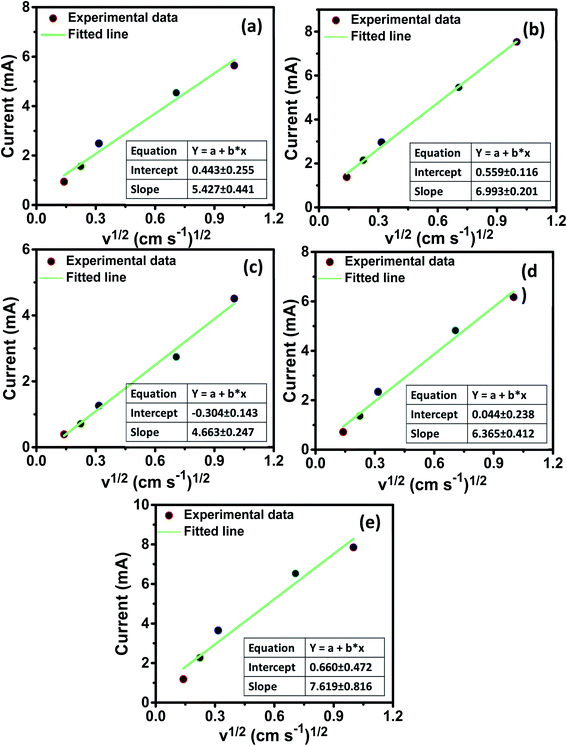 |
| | Fig. 8 Current versus square root of the scan rate plots of the (a) ZNCO-0, (b) ZNCO-25, (c) ZNCO-50, (d) ZNCO-75, and (e) ZNCO-100 electrodes. | |
Table 6 Lithium diffusion coefficients calculated for ZNCO-0, ZNCO-25, ZNCO-50, ZNCO-75, and ZNCO-100 electrodes from CV measurements
| Electrode |
DLi (cm2 s−1) |
| ZNCO-0 |
3.11 × 10⁻¹² |
| ZNCO-25 |
1.10 × 10⁻¹³ |
| ZNCO-50 |
2.22 × 10⁻¹² |
| ZNCO-75 |
1.93 × 10⁻¹² |
| ZNCO-100 |
1.02 × 10⁻¹³ |
3.6 Electrochemical impedance spectroscopy
For further demonstration of the reaction kinetics of the prepared electrodes, electrochemical impedance spectroscopy (EIS) was applied. The Nyquist plots for all of the prepared electrodes in a lithium half-cell, measured at open circuit potential, are shown in Fig. 9. The equivalent circuit used to simulate the EIS curves by Z-view software is shown in the inset. The EIS plots, as revealed from the equivalent circuit, are composed of partial semicircles corresponding to the medium to high frequencies, in addition to a straight sloping line corresponding to the low-frequency section. By intersecting the EIS plots with the real axis, the characteristics of the cell are reflected and give the values of bulk resistance (Rs). The Warburg impedance (Wc) designated by the slope of the line in the low-frequency region is related to the diffusion of lithium ions within the particles. The calculated Rct values for all samples are shown in Table 7. Here, the Rct value for pure ZNCO-100 (235 Ω) was found to be the lowest among all of the electrodes.
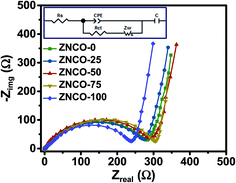 |
| | Fig. 9 Nyquist plots of the real and imaginary impedance of the ZNCO-0, ZNCO-25, ZNCO-50, ZNCO-75, and ZNCO-100 electrodes. | |
Table 7 Variation in the charge transfer resistance with Ni substitution in ZnCo2O4
| Electrode |
Charge transfer resistance (Ω) |
| ZNCO-0 |
282 |
| ZNCO-25 |
273 |
| ZNCO-50 |
292 |
| ZNCO-75 |
306 |
| ZNCO-100 |
235 |
4. Conclusions
In this work, Zn1−xNixCo2O4 with varying concentrations of Ni (x) was prepared by a sol–gel self-ignition route. XRD results showed that the samples possess a cubic spinel structure. Broad diffraction peaks indicated the formation of nanostructures, which were verified with FESEM images. The lattice constants were calculated to be 8.161 and 8.174 Å for the ZNCO-0 (starting) and ZNCO-100 (ending) compositions, respectively. The crystallite size was calculated to be as low as 89.4 Å for the ZNCO-50 (intermediate) composition. The ZNCO-50 electrode showed better stability at high rates and showed a specific capacity of 65 mA h g−1 at a high rate of 10 A g−1. Furthermore, a detailed study was conducted using CV and EIS to probe the lithium insertion/extraction mechanism. The ZNCO-0 electrode showed better diffusivity, where DLi was calculated to be 3.11 × 10⁻¹² cm2 s−1. Overall, this study of Ni-substituted ZnCo2O4 involved detailed electrochemical investigations into its use as an anode material for LIBs.
Conflicts of interest
The authors declare no conflicts of interest.
Acknowledgements
Shahid M. Ramay would like to acknowledge Researcher's Supporting Project Number RSP-2020/71, King Saud University, Riyadh, Saudi Arabia, for supporting this work.
References
- B. Scrosati and J. Garche, J. Power Sources, 2010, 195, 2419–2430 CrossRef CAS.
- J. M. Tarascon and M. Armand, Nature, 2001, 414, 171–179 CrossRef PubMed.
- M. Armand and J. Tarascon, Nature, 2008, 451, 2–7 CrossRef PubMed.
- M. M. Thackeray, C. Wolverton and E. D. Isaacs, Energy Environ. Sci., 2012, 5, 7854–7863 RSC.
- P. Verma, P. Maire and P. Novák, Electrochim. Acta, 2010, 55, 6332–6341 CrossRef CAS.
- F. Feng, R. Lu and C. Zhu, Energies, 2014, 7, 3004–3032 CrossRef.
- S. Xin, Y. You, S. Wang, H. Gao, Y. Yin and Y. Guo, ACS Energy Lett., 2017, 2, 1385–1394 CrossRef CAS.
- S. N. Eliseeva, K. A. Vorob, E. V. Shkreba, R. V. Apraksin and V. V. Kondrat, Russ. J. Appl. Chem., 2017, 90, 1230–1233 CrossRef CAS.
- K. Cao, T. Jin and L. Jiao, Mater. Chem. Front., 2017, 1, 2213–2242 RSC.
- D. Abrun, Acc. Chem. Res., 2018, 51, 273–281 CrossRef PubMed.
- S. H. Yu, S. H. Lee, D. J. Lee, Y. E. Sung and T. Hyeon, Small, 2016, 12, 2146–2172 CrossRef CAS PubMed.
- G. Jiang, H. Han, W. Zhuang, X. Xu, S. Kaskel, F. Xu and H. Wang, J. Mater. Chem. A, 2019, 7, 17561–17569 RSC.
- D. Wang, X. Qi, H. Gao, J. Yu, Y. Zhao and G. Zhou, Mater. Lett., 2016, 164, 93–96 CrossRef CAS.
- J. Bai, X. Li, G. Liu, Y. Qian and S. Xiong, Adv. Funct. Mater., 2014, 24, 3012–3020 CrossRef CAS.
- S. Hao, B. Zhang, S. Ball, M. Copley, Z. Xu, M. Srinivasan, K. Zhou, S. Mhaisalkar and Y. Huang, J. Power Sources, 2015, 294, 112–119 CrossRef CAS.
- H. Xin, D. Li, L. Shi, M. Ji, Y. Lin, J. Yu, B. Yang, C. Li and C. Zhu, Chem. Eng. J., 2018, 341, 601–609 CrossRef CAS.
- A. K. Rai, T. V. Thi, B. J. Paul and J. Kim, Electrochim. Acta, 2014, 146, 577–584 CrossRef CAS.
- X. Han, F. Liao, Y. Zhang, X. Han, C. Xu and H. Chen, J. Alloys Compd., 2019, 781, 425–432 CrossRef CAS.
- H. Chen, J. Wang, X. Han, F. Liao, Y. Zhang and X. Han, Ceram. Int., 2019, 45, 4059–4066 CrossRef CAS.
- J. Deng, X. Yu, X. Qin, B. Li and F. Kang, J. Alloys Compd., 2019, 780, 65–71 CrossRef CAS.
- A. You, M. A. Y. Be and I. In, AIP Conf. Proc., 2018, 030030 Search PubMed.
- A. Wang, S. Kadam, H. Li, S. Shi and Y. Qi, npj Comput. Mater., 2018, 4, 1–26 CrossRef CAS.
- Y. Mo, Q. Ru, X. Song and S. Hu, Acta, 2015, 176, 575–585 CAS.
- J. Deng, X. Yu, Y. He, B. Li and Q. Yang, Energy Storage Materials, 2017, 6, 61–69 CrossRef.
- C. Ding, W. Xu, M. Wang, X. Zeng and W. Wang, Int. J. Energy Res., 2019, 1–11 Search PubMed.
- Y. Sharma, N. Sharma, G. V. S. Rao and B. V. R. Chowdari, Adv. Funct. Mater., 2007, 17, 2855 CrossRef CAS.
- R. A. Adams, V. G. Pol and A. Varma, Ind. Eng. Chem. Res., 2017, 56(25), 7173–7183 CrossRef CAS.
- G. Chen, J. Yang, J. Tang and X. Zhou, RSC Adv., 2015, 5(29), 23067–23072 RSC.
|
| This journal is © The Royal Society of Chemistry 2020 |
Click here to see how this site uses Cookies. View our privacy policy here.  Open Access Article
 *b,
Sidra Zawara,
Mariam Hasana,
Ghulam M. Mustafaac,
Shahid Atiq
 *a and
Shahid M. Ramay*d
![[thin space (1/6-em)]](https://www.rsc.org/images/entities/char_2009.gif) :
:![[thin space (1/6-em)]](https://www.rsc.org/images/entities/char_2009.gif) 2. The combined solution of MNs and CA was kept on a hot plate inside an ESCO fume hood for continuous heating and stirring. Initially, the temperature of the hot plate was adjusted at 95 °C with a stirring speed of 250 rpm. After 2 h, the solution became thick enough and started impeding the stirrer motion. At this stage, the stirrer was removed and the temperature was raised up to 250 °C in steps. After a few minutes, a self-ignition exothermic reaction occurred with the elimination of the gaseous content, which turned the gel into a fluffy powder. This powder was ground and pressed in the form of cylindrical pellets of diameter 10 mm with a thickness of around 1 mm. To ensure the phase development, these pellets were then sintered at 450 °C for 2 h. Fig. 1 reveals the flow chart of the synthesis scheme.
2. The combined solution of MNs and CA was kept on a hot plate inside an ESCO fume hood for continuous heating and stirring. Initially, the temperature of the hot plate was adjusted at 95 °C with a stirring speed of 250 rpm. After 2 h, the solution became thick enough and started impeding the stirrer motion. At this stage, the stirrer was removed and the temperature was raised up to 250 °C in steps. After a few minutes, a self-ignition exothermic reaction occurred with the elimination of the gaseous content, which turned the gel into a fluffy powder. This powder was ground and pressed in the form of cylindrical pellets of diameter 10 mm with a thickness of around 1 mm. To ensure the phase development, these pellets were then sintered at 450 °C for 2 h. Fig. 1 reveals the flow chart of the synthesis scheme.![[thin space (1/6-em)]](https://www.rsc.org/images/entities/char_2009.gif) :
:![[thin space (1/6-em)]](https://www.rsc.org/images/entities/char_2009.gif) 2
2![[thin space (1/6-em)]](https://www.rsc.org/images/entities/char_2009.gif) :
:![[thin space (1/6-em)]](https://www.rsc.org/images/entities/char_2009.gif) 7 by weight. The above mixture was mixed with N-methyl pyrrolidone to obtain a homogeneous slurry for each electrode. The semi-liquid mixtures were cast on Cu foil and roll-pressed after drying. Coin-type (2032) cells were fabricated using vacuum dried working electrodes and lithium foil was used as the counter electrode. The electrolyte was made up of 1 M LiPF6 dissolved in ethylene carbonate and dimethyl carbonate in a volume ratio of 7
7 by weight. The above mixture was mixed with N-methyl pyrrolidone to obtain a homogeneous slurry for each electrode. The semi-liquid mixtures were cast on Cu foil and roll-pressed after drying. Coin-type (2032) cells were fabricated using vacuum dried working electrodes and lithium foil was used as the counter electrode. The electrolyte was made up of 1 M LiPF6 dissolved in ethylene carbonate and dimethyl carbonate in a volume ratio of 7![[thin space (1/6-em)]](https://www.rsc.org/images/entities/char_2009.gif) :
:![[thin space (1/6-em)]](https://www.rsc.org/images/entities/char_2009.gif) 3. The thickness of the electrode and loading of active material were ∼30 μm and 3 mg, respectively. The cells were stored together in a glove box filled with argon with water and oxygen concentrations of less than 0.1 ppm. Cyclic voltammetry (CV) and galvanostatic charge–discharge (GCD) measurements were carried out on a Biologic (VMP3) instrument.
3. The thickness of the electrode and loading of active material were ∼30 μm and 3 mg, respectively. The cells were stored together in a glove box filled with argon with water and oxygen concentrations of less than 0.1 ppm. Cyclic voltammetry (CV) and galvanostatic charge–discharge (GCD) measurements were carried out on a Biologic (VMP3) instrument.![[thin space (1/6-em)]](https://www.rsc.org/images/entities/char_2009.gif) cos
cos![[thin space (1/6-em)]](https://www.rsc.org/images/entities/char_2009.gif) θ in the place of β. It was observed that the crystallite size decreased with increasing Ni content in ZnCo2O4 and it was the lowest for the intermediate composition, ZNCO-50, for which it was calculated to be 89.4 Å. However, further increase in the Ni content caused an increase in crystallite size. The variation of all of these structural factors with Ni-substitution is summarized in Table 1.
θ in the place of β. It was observed that the crystallite size decreased with increasing Ni content in ZnCo2O4 and it was the lowest for the intermediate composition, ZNCO-50, for which it was calculated to be 89.4 Å. However, further increase in the Ni content caused an increase in crystallite size. The variation of all of these structural factors with Ni-substitution is summarized in Table 1.
![[thin space (1/6-em)]](https://www.rsc.org/images/entities/char_2009.gif) 000×. The analysis of the FESEM images revealed the formation of highly dense, well-developed grains with a small agglomeration at the start. Initially, the grains were of random shape, which transformed into spherical shape with increasing Ni content. For ZNCO-0, the average grain size for the smaller grains, which were clearly visible, was found to be 90 nm and that of the larger grains was found to be 185 nm. As the Ni content increased, the agglomeration started to decrease, which resulted in a decrease of the grain size, owning to the increase in cohesive forces. For ZNCO-100, uniformly distributed spherical grains could be seen with the average grain size of about 60 nm. Thus, it was confirmed from the FESEM images that the substitution of Ni on the Zn-sites in Zn1−xNixCo2O4 decreased the distortion in the shape and size of the grains.
000×. The analysis of the FESEM images revealed the formation of highly dense, well-developed grains with a small agglomeration at the start. Initially, the grains were of random shape, which transformed into spherical shape with increasing Ni content. For ZNCO-0, the average grain size for the smaller grains, which were clearly visible, was found to be 90 nm and that of the larger grains was found to be 185 nm. As the Ni content increased, the agglomeration started to decrease, which resulted in a decrease of the grain size, owning to the increase in cohesive forces. For ZNCO-100, uniformly distributed spherical grains could be seen with the average grain size of about 60 nm. Thus, it was confirmed from the FESEM images that the substitution of Ni on the Zn-sites in Zn1−xNixCo2O4 decreased the distortion in the shape and size of the grains.
![[thin space (1/6-em)]](https://www.rsc.org/images/entities/char_2009.gif) 000× magnification and (f) EDX spectra of the Ni-doped ZnCo2O4 samples.
000× magnification and (f) EDX spectra of the Ni-doped ZnCo2O4 samples.


