
 Open Access Article
 This Open Access Article is licensed under a Creative Commons Attribution-Non Commercial 3.0 Unported Licence
A simple fluorescence assay for trypsin through a protamine-induced carbon quantum dot-quenching aggregation platform†
Yiping Chen‡
a,
Zuan Lin‡b,
Chenfang Miaob,
Qianqian Caib,
Fenglan Lib,
Zongfu Zheng*c,
Xinhua Linb,
Yanjie Zhengb and
Shaohuang Weng *b
*b
aDepartment of Interventional Radiology, The First Affiliated Hospital of Fujian Medical University, Fuzhou, 350005, China
bDepartment of Pharmaceutical Analysis, School of Pharmacy, The Higher Educational Key Laboratory for Nano Biomedical Technology of Fujian Province, Fujian Medical University, Fuzhou 350122, China. E-mail: shweng@fjmu.edu.cn
cThe 900th Hospital of PLA, Fuzhou, 350002, China. E-mail: fuhos_476@126.com
First published on 28th July 2020
Abstract
The development of a simple detection strategy for trypsin (Try) is urgent, and is ascribed to the diagnostic value of Try in several diseases. Herein, a facile but effective fluorescence strategy for Try was developed based on the protamine (Pro)-induced aggregation of carbon quantum dots (CQDs). The fluorescence of negatively charged CQDs was quenched with Pro due to the assembly of CQDs and Pro (CQDs/Pro) through electrostatic interaction. However, the highly positively charged Pro, which is rich in basic arginine residues, was preferred to be hydrolyzed by Try. Try can induce the deaggregation of CQDs/Pro, thereby enabling the release of CQDs to restore the fluorescence intensity. Thus, the use of CQDs/Pro as a testing platform will be employed as a “turn-on” method for Try. In addition, the fluorescence-resuming response was proportional to Try, ranging from 25 ng mL−1 to 500 ng mL−1 with a limit of detection (LOD) of 8.08 ng mL−1. This “turn-on” fluorescence assay for Try was label-free, convenient, and relatively free of interference from coexisting substances. Actual applications for Try monitoring and trypsin inhibitor screening also illustrated the considerable prospect of CQDs in the clinical field, combined with the superiority of the simple mixing operation.
With increasing attention being paid to human health for disease diagnosis and treatment, increasing efforts have been spent on the development of new analytical methods toward biological macromolecule detection.1,2 Trypsin (Try) is one of the most vital digestive proteases produced in pancreatic acinar cells, and can catalyze the hydrolysis of peptides mainly found at the C-terminus of lysine and arginine residues.3–5 Abnormal Try activity will be reflected in pancreatic function and the corresponding pathological changes of the human body. In general, Try is a biomarker for several diseases, such as acute pancreatitis, cystic fibrosis, and pancreatic cancer.5–7 Therefore, accurate monitoring for Try levels through simple and economical assays has attracted increasing interest in disease diagnosis and treatment.
At present, considerable efforts have been devoted to developing efficient and reliable methods for Try detection based on various strategies, including colorimetry,8 electrochemistry,9 and fluorescence methods.10 Fluorescent approaches have been widely used due to their characteristics of simplicity, rapidity, sensitivity, and realizing real-time detection.11,12 Fluorescent methods for Try have mainly been developed based on the hydrolytic effect of Try using peptide chains or specific proteins as substrates,7,10,13,14 and using fluorescent dots, like CdTe QDs.14 Although current fluorescent methods are accurate and reliable, a simple and easy sensing system that detects Try with a controllable response integration modulated by Try through a biocompatible probe is still lacking. Given its special structural properties, protamine (Pro) is a highly cationic peptide under physiological conditions that possesses unique physiological function and substrates for enzymatic catalysis.8 The arginine-rich structure of protamine can also be catalyzed by Try as an ideal substrate for Try monitoring.8,15,16 Hence, the interaction system containing Pro and a fluorescence probe, such as AIEgen, can be applied for the analytical assembly of Try.17 With regard to the relatively complicated preparation of AIE, other fluorescent probes for Try detection are desirable and urgently needed.
Among the current fluorescent nanomaterials, fluorescent carbon quantum dots (CQDs) have been used to construct biosensors due to their safety, unique optical properties, and ease of modification.18–20 Changing the structure or the surface properties of CQDs can result in a difference in the interaction and function between CQDs and external substances.21,22 Thus, various fluorescent sensors based on CQDs have been established to detect specific targets varying from ions, nucleic acids, and drugs.22–25 Positively and negatively charged carbon dots with controlled N-doping play opposite adsorption interaction with ssDNA in different applications.21–23 Hence, a series of different application systems can be proposed to establish by utilizing the different surface properties of CQDs.
Herein, negatively charged CQDs, fabricated from a simple melting operation, were applied as the sensing probe for Try detection without any complex surface functionalization or conjugation and compared with other reported quantum dots,26 as shown in Scheme 1. Using Pro as the selective enzymatic substrate for Try, the integration of the prepared CQDs and Pro induce them to assemble and form an aggregation-caused quenching system of CQDs and Pro (CQDs/Pro) via electrostatic interaction. Under the strong and specific hydrolysis of Try to Pro, Pro loses its function with CQDs, and then the CQDs/Pro disaggregates to recover the fluorescence intensity. This facile system using Pro as the medium for inducing CQD aggregation provided novel insights into the design of some quantum dots with the appropriate surface property for the fabrication of simple, selective, and effective fluorescence assays for bioanalysis without a complicated surface functionalization.
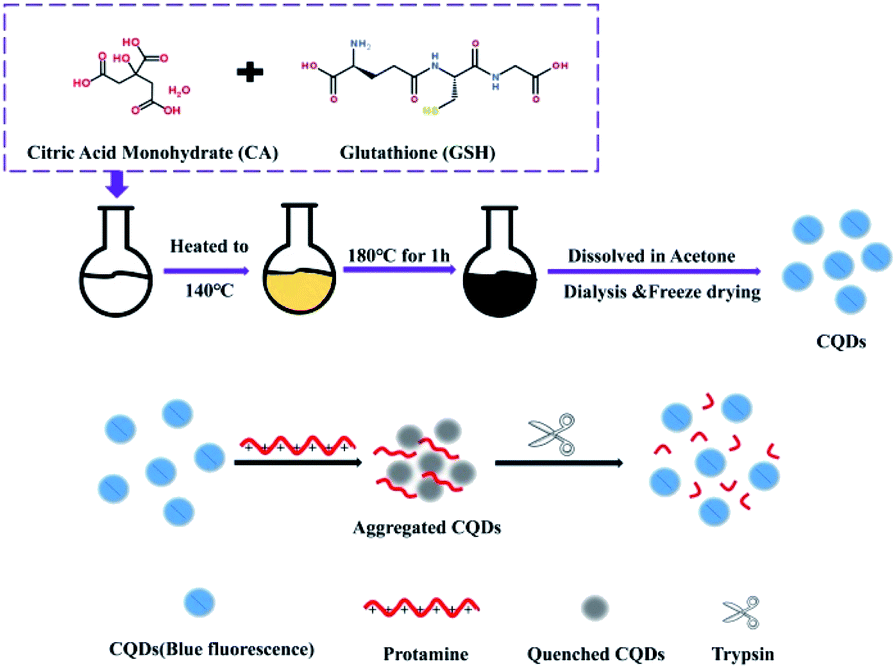 | ||
| Scheme 1 The fabrication of CQDs and its electrostatic interaction with protamine as a simple quenching platform for trypsin detection. | ||
Experimental
Chemicals and apparatus
Protamine sulfate salt, urease, tyrosinase (TRY), alkaline phosphatase (ALP), lysozyme, glucose oxidase (GOx), xanthine oxidase (XO), horseradish peroxidase (HRP), and pepsin were supplied by Sigma-Aldrich (Shanghai, China). Trypsin was obtained from Guangzhou Saiguo Biotechnology Co., Ltd. Bovine serum albumin (BSA), citric Acid (CA) and reduced glutathione (GSH) were purchased from Aladdin Chemistry Co., Ltd. (Shanghai, China). Heparin injection (50 mg mL−1) was provided by Chengdu Haitong Pharmaceutical Co., Ltd. Soybean trypsin inhibitor and other reagents (like glucose, NaCl, CaCl2, NaH2PO4·2H2O, Na2HPO4·12H2O, NaOH and H3PO4) of analytical grade were obtained from Sinopharm Chemical Reagent (Shanghai, China) and used without further purification. 5 mM phosphate buffer (PB) was prepared from NaH2PO4·2H2O and Na2HPO4·12H2O with different pH modulation using NaOH or H3PO4. All solutions were prepared with ultrapure water from a Millipore system.The fluorescence measurements were recorded using a Cary Eclipse fluorescence spectrophotometer (Agilent Technologies, USA). UV-visible (UV-Vis) absorption spectroscopy was measured on a UV-2250 spectrophotometer (Shimadzu Corporation, Japan). Transmission electron microscopy (TEM) images were obtained on an FEI Talos F200S. Fourier transform infrared spectroscopy (FTIR) was collected using a Nicolet iS50 infrared spectroscopy instrument (Thermo Fisher Scientific, USA). The size and zeta potential analyses were performed using a Litesizer™ series particle analyzers (Anton Paar, Austria) at 25 °C.
CQD synthesis
The CQDs were prepared through a simple one-pot staged heating process. First, the homogeneous mixture of 2 g citric acid monohydrate and 0.6 g GSH was heated from room temperature to 140 °C in a heater. The mixture was then continuously heated to 180 °C and kept for 1 h. At the end of the reaction, the reaction flask was taken out and naturally cooled to room temperature. The product was dissolved in acetone and centrifuged to obtain a white precipitate, which was purified through a 24 h dialysis process using a dialysis bag in which the retained molecular weight was 2000 Da. After filtration using a 0.22 μm membrane, the product was freeze-dried. The obtained solid of CQDs was dissolved into 1 mg mL−1 using purified water as the stock solution. The stock solution could be diluted with PB to be a specific concentration for the assay.Fluorescence measurement of CQDs/Pro
Variable amounts of Pro with 20 μL of CQDs (200 μg mL−1) were mixed to investigate the quenching effect of Pro toward CQDs in 200 μL of the reacting solution. After 5 min of the reaction, the fluorescence emission spectrum was recorded.Analytical performance of this method using CQDs/Pro for Try
For Try detection, the total volume of the testing solution was made to be 200 μL. Different amounts (2, 4, 8, 12, 16, 20, 24, 28, 32, 36 and 40 μL) of 10 μg mL−1 Try stock solution were added to CQDs/Pro solutions prepared from 20 μL of 200 μg mL−1 Pro and 400 μg mL−1 CQDs with the final CQDs and Pro concentrations of 20 and 40 μg mL−1. Fluorescent measurements were operated before and after the incubation of Try in CQDs/Pro at 37 °C for 90 min, respectively.For the selectivity evaluation, like the testing procedure for Try, the common interference molecules with specific concentrations (30 μg mL−1 of glucose; 1 μg mL−1 of BSA, Cl− or Ca2+; 250 U L−1 of urease, TRY, XO, GOx, HRP, ALP, or lysozyme; 2 μg mL−1 of pepsin and 3 μg mL−1 of heparin) were respectively added into 200 μL of CQDs/Pro solution with the final CQDs and Pro concentrations of 20 and 40 μg mL−1. Fluorescent measurements were operated before and after the incubation of interference in CQDs/Pro at 37 °C for 90 min, respectively.
Inhibitor screen
Different amounts (0, 0.5, 1.0, 1.5, 2.0, 2.5, 3.0, 4.0, and 5.0 μg mL−1) of soybean trypsin inhibitor were added to 500 ng mL−1 Try CQDs/Pro to achieve a total volume of 200 μL and reacted at 37 °C for 15 min. Then, the CQDs/Pro solution with the final CQDs and Pro concentrations of 20 and 40 μg mL−1 was added to the above solution to react at 37 °C for another 90 min. Fluorescent measurements were then carried out for each sample.Results and discussion
Characterization of the CQDs
At first, the optical properties of the CQDs were explored. The UV-Vis spectrum showed a broad absorption band centered at 340 nm corresponding to the n–π* transition of C![[double bond, length as m-dash]](https://www.rsc.org/images/entities/char_e001.gif) O in CQDs. Under excitation at 345 nm, the CQD solution exhibited a maximum symmetrical emission spectrum profile at 423 nm (Fig. 1A). The aqueous solution of CQDs illustrated blue fluorescence under UV irradiation, which can be observed with the naked eye (inset of Fig. 1A). Fig. S1† shows that CQDs exhibited constant emission wavelength, but variable intensities under different excitation wavelengths from 300 nm to 400 nm, suggesting the excitation-independent property. In addition, the maximum emission intensity of CQDs was achieved under 345 nm excitation. Using quinine sulfate (quantum yield [QY] = 54%) as the reference, the QY of CQDs was estimated to be 6.95%, as shown in Fig. 1B. The influences of the ionic strength and pH toward CQDs were also investigated. Fig. S2† indicates that CQDs were relatively stable with various ionic strengths, even in high ionic strength (1000 mM NaCl). CQDs were also hardly affected by the variable pH range from 4.0 to 9.0 (Fig. S3†), thereby exhibiting the good stability of CQDs under different aqueous conditions. The result in Fig. S4† indicates that the fluorescence intensity of CQDs remained almost constant under continuous 345 nm excitation for 1 h, suggesting that CQDs have good anti-photobleaching properties. Furthermore, under the general storage of CQDs in the refrigerator, CQDs kept the stable fluorescence property for 3 months. The functional groups and elemental information of CQDs were further measured. As shown in Fig. 1C, the peaks at approximately 3386 and 3270 cm−1 correspond to the stretching vibrations of O–H and N–H, respectively. The stretching vibration of C–H was confirmed by the presence of a band at 2922 cm−1. The characteristic infrared bands of the stretching vibration of CO, C–N, and C–O in CQDs were found at 1709, 1398, and 1180 cm−1, respectively. These characteristic groups indicated the excellent water dispersion and negative surface charge, which were proved by the tested zeta potential of −12.8 mV. The XPS survey spectrum also exhibited the four peaks at 284.6, 400.6, 531.6, and 163.6 eV, which were attributed to C1s, N1s, O1s, and S2p, respectively (Fig. 1D), thereby indicating the main elements of CQDs. The percentages of C, N, O, and S were 63.61%, 25.70%, 8.71%, and 1.99%, respectively. Furthermore, the high-resolution analysis of the N1s, S2p and C1s XPS peaks was operated to investigate the respective role of different elements in CQDs. As shown in Fig. S5,† the deconvolution of N1s illustrates the presence of pyrrolic-like N, and NH groups ascribed to the peaks at 400.0 eV and 400.7 eV. In addition, the high-resolution S2p XPS analysis shows two peaks at 163.5 eV and 164.7 eV, which are in accordance with the C–S–C covalent bond of thiophene-like S. The deconvolution of C1s also illustrates the presence of C–C/CC at 284.6 eV, C–O/C–N/C–S at 285.8 eV, and CN/CO at 288.2 and 288.9 eV. High-resolution XPS peaks of N1s, S2p and C1s confirm the doping effect of N and S in CQDs through the formed covalent bond with the C element, especially for N.
O in CQDs. Under excitation at 345 nm, the CQD solution exhibited a maximum symmetrical emission spectrum profile at 423 nm (Fig. 1A). The aqueous solution of CQDs illustrated blue fluorescence under UV irradiation, which can be observed with the naked eye (inset of Fig. 1A). Fig. S1† shows that CQDs exhibited constant emission wavelength, but variable intensities under different excitation wavelengths from 300 nm to 400 nm, suggesting the excitation-independent property. In addition, the maximum emission intensity of CQDs was achieved under 345 nm excitation. Using quinine sulfate (quantum yield [QY] = 54%) as the reference, the QY of CQDs was estimated to be 6.95%, as shown in Fig. 1B. The influences of the ionic strength and pH toward CQDs were also investigated. Fig. S2† indicates that CQDs were relatively stable with various ionic strengths, even in high ionic strength (1000 mM NaCl). CQDs were also hardly affected by the variable pH range from 4.0 to 9.0 (Fig. S3†), thereby exhibiting the good stability of CQDs under different aqueous conditions. The result in Fig. S4† indicates that the fluorescence intensity of CQDs remained almost constant under continuous 345 nm excitation for 1 h, suggesting that CQDs have good anti-photobleaching properties. Furthermore, under the general storage of CQDs in the refrigerator, CQDs kept the stable fluorescence property for 3 months. The functional groups and elemental information of CQDs were further measured. As shown in Fig. 1C, the peaks at approximately 3386 and 3270 cm−1 correspond to the stretching vibrations of O–H and N–H, respectively. The stretching vibration of C–H was confirmed by the presence of a band at 2922 cm−1. The characteristic infrared bands of the stretching vibration of CO, C–N, and C–O in CQDs were found at 1709, 1398, and 1180 cm−1, respectively. These characteristic groups indicated the excellent water dispersion and negative surface charge, which were proved by the tested zeta potential of −12.8 mV. The XPS survey spectrum also exhibited the four peaks at 284.6, 400.6, 531.6, and 163.6 eV, which were attributed to C1s, N1s, O1s, and S2p, respectively (Fig. 1D), thereby indicating the main elements of CQDs. The percentages of C, N, O, and S were 63.61%, 25.70%, 8.71%, and 1.99%, respectively. Furthermore, the high-resolution analysis of the N1s, S2p and C1s XPS peaks was operated to investigate the respective role of different elements in CQDs. As shown in Fig. S5,† the deconvolution of N1s illustrates the presence of pyrrolic-like N, and NH groups ascribed to the peaks at 400.0 eV and 400.7 eV. In addition, the high-resolution S2p XPS analysis shows two peaks at 163.5 eV and 164.7 eV, which are in accordance with the C–S–C covalent bond of thiophene-like S. The deconvolution of C1s also illustrates the presence of C–C/CC at 284.6 eV, C–O/C–N/C–S at 285.8 eV, and CN/CO at 288.2 and 288.9 eV. High-resolution XPS peaks of N1s, S2p and C1s confirm the doping effect of N and S in CQDs through the formed covalent bond with the C element, especially for N.
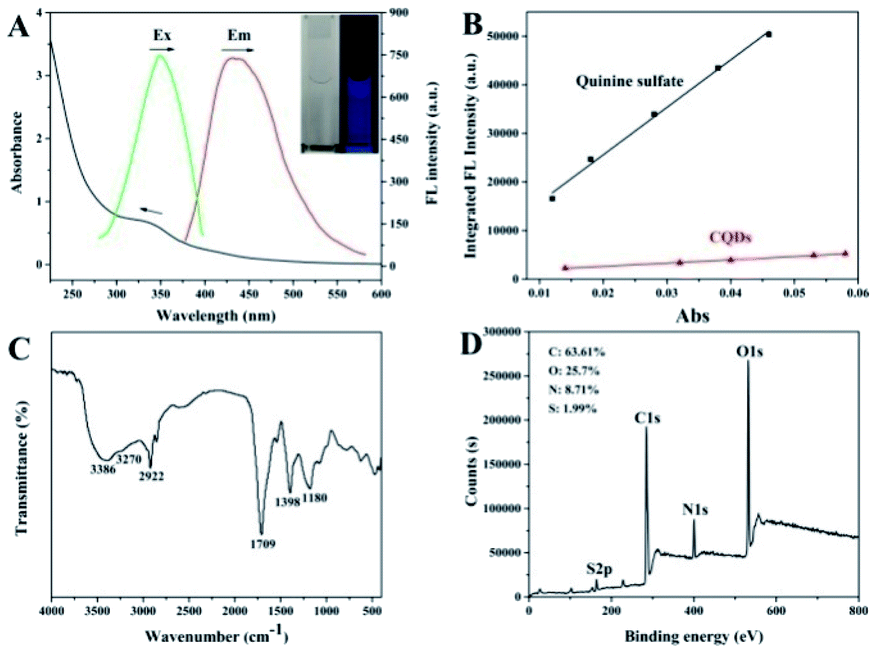 | ||
| Fig. 1 UV-Vis and fluorescence spectrum (A), QY detection (B), FTIR spectrum (C), and XPS survey (D) of CQDs. The inset of (A) shows the images of CQDs under sunlight and UV light. | ||
Feasibility and mechanism of fluorescent sensor for TRY
Fluorescence measurements were performed to test the feasibility and principle of this strategy. As shown in Fig. 2A, the original strong fluorescence of CQDs centered at 423 nm was significantly quenched by the addition of Pro. In addition, the average lifetime of simple CQDs was changed from 7.91 ns to 7.90 ns when Pro was added to the CQDs solution, which was proved by the time-resolved fluorescence shown in Fig. 2B. The negligible varied lifetime suggested the occurrence of the static quenching of CQDs caused by Pro in CQDs/Pro.27 However, CQDs/Pro recovered the quenched fluorescence with the introduction of TRY (Fig. 2A). Furthermore, as shown in Fig. S6,† the blue fluorescence image of the simple CQDs obviously decreased under a UV lamp with the addition of Pro, suggesting the quenching behavior of CQDs. The fluorescence of the quenched CQDs was then recovered to exhibit a blue fluorescence image like the original CQDs system. However, simply TRY alone had no effect on the fluorescence of CQDs, as shown in Fig. S7.† These phenomena illustrated the feasibility of the introduction of CQDs/Pro as the response unit for the detection of TRY through the restored fluorescence. Thus, the fluorescence recovery (ΔF = F − F0), where F and F0 are the respective fluorescence intensity of the CQDs/Pro in the presence and absence of Try, respectively, can reflect the restored fluorescence well for Try quantification.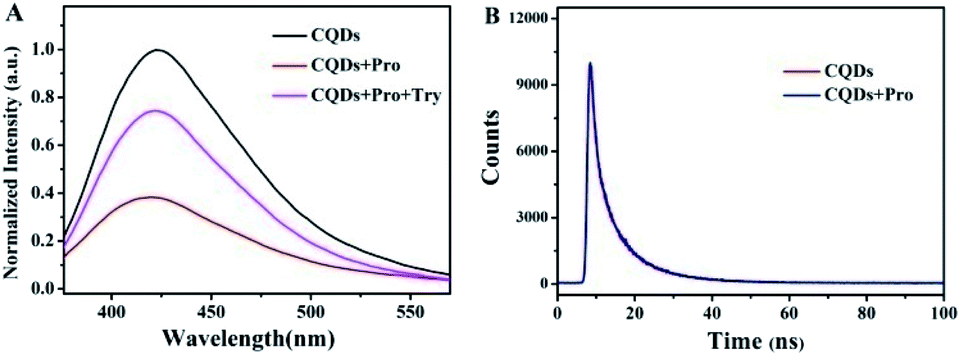 | ||
| Fig. 2 Fluorescence spectra (A) and decay curves (B) of CQDs and CQDs/Pro. The recovered fluorescence spectrum (A) of the addition of Try to CQDs/Pro. Condition: 20 μg mL−1 CQDs, 40 μg mL−1 Pro and 500 ng mL−1 Try. | ||
To further explore the testing principle of this strategy, we carried out a series of experiments. At first, the quenching behavior was investigated. As shown in Fig. 3, TEM was performed to examine the possible varied morphologies of CQDs in the absence and presence of Pro. CQDs exhibited a uniform quasisphere structure, with the size distributed in the range of 2.1–2.4 nm and an average diameter of 2.31 nm. The lattice parameter of CQDs was 0.20 nm, which was ascribed to the graphite carbon diffraction facet of (100) (inset of Fig. 3A).28 The pristine well-dispersed CQDs transformed into an aggregation of dots that was tens of nanometer in CQDs/Pro (Fig. 3B). The different dispersions of CQDs before and after the addition of Pro revealed that the CQDs assembled and integrated with Pro for the aggregation-caused quenching.29–33 The interacting patterns between CQDs and Pro in CQDs/Pro were also investigated. The zeta potential and particle size distribution were characterized, as shown in Fig. 4. The zeta potential and size distribution of the pure CQDs were −12.8 mV and 2.3 nm, respectively. The negative charge was changed significantly to −3.1 mV when Pro, with a positive charge (3.2 mV), was added. The significant decrease in the zeta potential indicated the electrostatic interaction between CQDs and Pro in CQDs/Pro. CQDs/pro showed a wide distribution in size centered at approximately 600 nm by DLS (Fig. 4B), indicating CQDs aggregation. The addition of Pro made the particle size detected by DLS larger than that observed by TEM. This was likely due to the hydrodynamic diameter detected from DLS and the still-dispersed Pro. Thus, combined with the results of the zeta potential and varied size, it can be concluded that electrostatic interaction is the main factor that induces negative CQDs to aggregate and quench with the addition of positive Pro in the formed CQDs/Pro.31
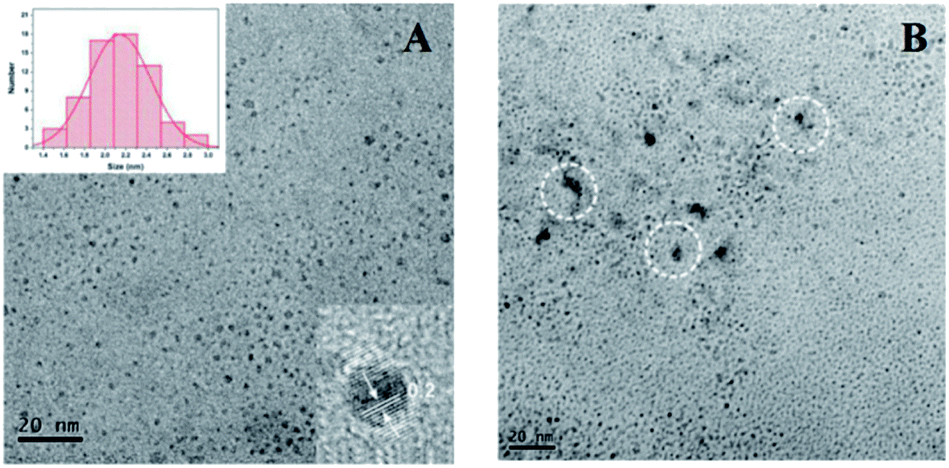 | ||
| Fig. 3 TEM of CQDs (A) and CQDs/Pro (B). The inset of (A) shows the size distribution and HRTEM of CQDs. | ||
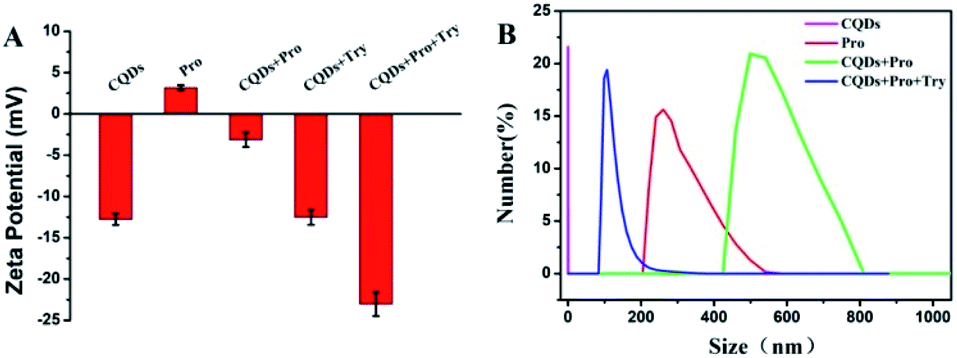 | ||
| Fig. 4 Zeta potential (A) and DLS (B) of CQDs, Pro, CQDs/Pro, and Try addition into CQDs/Pro. The zeta potential (A) of Try addition into CQDs. Error bars represent the SDs of three parallel determinations. | ||
The testing principles of TRY using CQDs/Pro were further investigated. The simple presence of Try in CQDs could not modulate the negatively charged CQDs, indicating the absence of any interaction between CQD and Try (Fig. 4A). More importantly, the introduction of Try changed the size of CQDs/Pro to a size range centered at 100 nm, which was even smaller than pure Pro centered at 270 nm. The significantly decreased size suggested the disassembly of CQDs/Pro. Polycationic Pro was hydrolyzed by Try to destroy the aggregation of CQDs/Pro with the addition of Try. This was ascribed to the recognition of the C-terminal side of arginine and the specific hydrolysis of the arginine-rich Pro by Try. Therefore, the disassembly of CQDs/Pro induced the restoring of fluorescence.
Optimization of the Try detection condition
For Try detection using CQDs/Pro, the optimization of the quenching effect of Pro on CQDs was first carried out. As shown in Fig. S8A,† the fluorescence of CQDs significantly decreased after the addition of Pro at room temperature in 1 min. Then, the quenched system remained at nearly constant fluorescence intensity during the extended period. To ensure the full combination of CQDs and Pro, 5 min was chosen as the appropriate incubation time for CQD/Pro preparation. The fluorescence of CQDs also decreased gradually with the increased Pro concentration, as shown in Fig. S8B.† Thus, the fluorescence quench efficiency of CQDs is closely correlated with the amount of Pro. In addition, CQDs could be effectively and continuously quenched stably when the Pro concentration was up to 40 μg mL−1, which is a ratio of 2![[thin space (1/6-em)]](https://www.rsc.org/images/entities/char_2009.gif) :1 Pro:CQDs concentration (Fig. S9†). Considering the complete formation of CQDs/Pro, which improved the detection sensitivity of the “turn-on” quantitative assay, 40 μg mL−1 was chosen as the optimized concentration of Pro for further experiments.
:1 Pro:CQDs concentration (Fig. S9†). Considering the complete formation of CQDs/Pro, which improved the detection sensitivity of the “turn-on” quantitative assay, 40 μg mL−1 was chosen as the optimized concentration of Pro for further experiments.
Several conditions that possibly affect the Try activity, such as pH, temperature, and time, were also optimized. As shown in Fig. S10,† different pH values would lead to varying degrees of ΔF with the addition of Try. Try was the most effective at a pH value of 7.4 in this detecting strategy. Thus, considering the physiological conditions, a pH value of 7.4 was selected as the appropriate condition to monitor the detection response for Try. As shown in Fig. S11,† the hydrolysis degree increased gradually with the increase in temperature and exhibited the maximum ΔF at 37 °C, accompanied with a weak ΔF at high temperature. Therefore, the ideal incubation temperature for Try detection was 37 °C. The fluorescence response-time of CQDs/Pro before and after adding trypsin was significant for the proposed trypsin biosensor. Fig. S12† shows the time-dependent fluorescent response for Try. The ΔF was gradually enhanced and then maintained a stable value when the incubation time reached 90 min. Thus, the incubation process for Try should be set at 90 min.
Assay of Try
The quantitative detection was evaluated under the suitable conditions for Try activity. As shown in Fig. 5A, the fluorescence of CQDs at 423 nm was restored and increased with the increased amount of Try. The ΔF showed a good linear relationship with the Try concentration, ranging from 25 ng mL−1 to 500 ng mL−1 (Fig. 5B), with the fitting equation of ΔF = 0.7021CTry (ng mL−1) + 6.0707 (R2 = 0.9994). According to 3σ/slope, the detection limit of Try was 8.08 ng mL−1, which was lower than that of the as-reported fluorescent methods according to the active group-modified signal probes.26,33,34 As listed in Table S1† and compared with other published methods for TRY, this method has a good linear relationship with an acceptable LOD for the detection of TRY. Under the optimal conditions, the method has the advantages of convenience, efficiency, sensitivity and a simple operation. This assay, on the basis of the CQD/Pro platform, illustrated the advantages of the simple fabrication, cheap material and easy testing operation.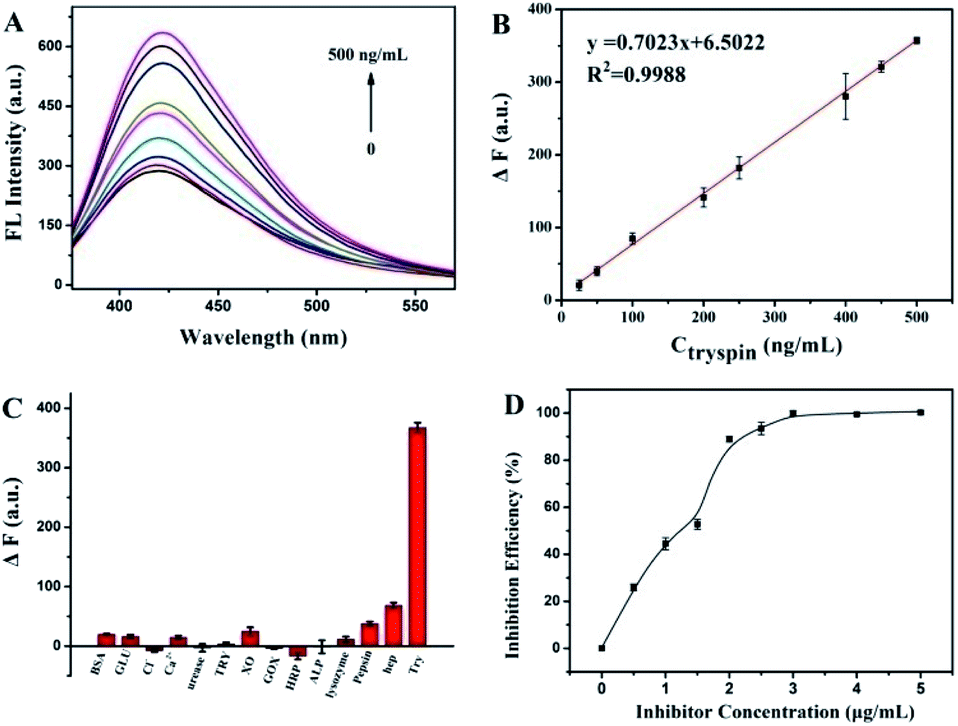 | ||
| Fig. 5 (A) Fluorescence emission spectra and (B) linear relationship of the fluorescence recovery of CQDs/Pro to different Try concentrations ranging from 25 ng mL−1 to 500 ng mL−1. (C) Fluorescence recovery of CQDs/Pro toward Try trypsin (500 ng mL−1) or other interferences (30 μg mL−1 of glucose; 1 μg mL−1 of BSA, Cl− or Ca2+; 250 U L−1 of urease, TRY, XO, GOx, HRP, ALP, or lysozyme; 2 μg mL−1 of pepsin and 3 μg mL−1 of heparin). The inhibition efficiency (D) of variable concentrations of soybean trypsin inhibitor toward Try. Error bars represent the SD of three parallel determinations. | ||
To evaluate the selectivity of this fluorescence strategy toward Try, we compared the effect on ΔF with 500 ng mL−1 Try with other potentially interferences, containing other proteases and heparin, which is known as a strong interacting substance for Pro.35 As shown in Fig. 5C, compared with the significant increase in the ΔF of CQDs/Pro to Try, the interferences, including pepsin, enzymes, other proteins, and ions, had almost no evident effect on CQDs/Pro. Although the concentration of heparin was much higher than Try, the ΔF caused by heparin was still much smaller. Interfering molecules displayed an unremarkable response on CQDs/Pro, suggesting that the as-established assay can achieve the high requirement of selectivity.
Screening inhibitors is a significant task in drug development. The development of a simple but effective platform for inhibitor screening is critically important. Therefore, to evaluate the application potential of CQDs/Pro for Try, the inhibition efficiency of soybean trypsin inhibitor toward Try using CQDs/Pro as a response unit was attempted, as shown in Fig. 5D. With the increase in soybean trypsin inhibitor, the inhibition efficiency improved remarkably at first. It then achieved a plateau due to the block effect of soybean to the active sites of Try. When we kept the Try concentration at 500 ng mL−1, the IC50 value of soybean was 1.037 μg mL−1, which was in accordance with the result obtained from the AIE method.17 The result revealed that the CQDs/Pro fabricated herein was a facile, sensitive platform for Try inhibitor screening with the easily controlled procedure of a simple mixing protocol.
To further assess the accuracy and the application potential of the method, the addition recovery of the spiked Try in human serum samples from healthy volunteers was estimated. For the recovery testing, three different amounts of Try (50, 250 and 500 ng mL−1) were added and measured with the same procedure in 1% human serum diluted by PB. As listed in Table S2,† the recovery of Try in the human serum samples was in the range of 99.07–109.04%, with the relative standard deviation of less than 5%. This result indicated that the developed CQDs could be successfully applied for Try in biological samples with a predictably simple procedure only through a mixing operation.
Conclusions
We successfully fabricated a simple but effective platform for Try detection on the basis of negatively charged CQDs as an economical probe and positively charged Pro as the function response unit. Through the recovered fluorescence according to the introduction of the target, the analytical performance based on CQDs/Pro exhibited high sensitivity and excellent selectivity toward other ions and their analogues. This platform for Try monitoring only required the facile blending operation of CQDs/Pro and Try. This method was also applied to detect Try in serum samples with satisfactory results. This method is flexible, convenient, time-saving, and cost-effective, which provides a considerable opportunity for the wide application of biological systems.Conflicts of interest
There are no conflicts to declare.Acknowledgements
The authors gratefully acknowledge financial support from the National Natural Science Foundation of China (21405016, 21775023, 21705021), Joint Funds for the Innovation of Science and Technology, Fujian Province (2017Y9121, 2017Y9124), and the National Science Foundation of Fujian Province (2017J01328, 2017J01532).Notes and references
- F. Yan, K. Fan, Z. Bai, R. Zhang, F. Zu, J. Xu and X. Li, TrAC, Trends Anal. Chem., 2017, 97, 15 CrossRef CAS.
- Y. Saylan, F. Yilmaz, E. Ozgur, A. Derazshamshir, H. Yavuz and A. Denizli, Sensors, 2017, 17, 898 CrossRef PubMed.
- J. Olsen, Mol. Cell. Proteomics, 2004, 3, 608 CrossRef CAS PubMed.
- M. Cai, C. Ding, X. Cao, F. Wang, C. Zhang and Y. Xian, Anal. Chim. Acta, 2019, 1056, 153 CrossRef CAS PubMed.
- J. Artigas, M. Garcia, M. Faure and A. Gimeno, Postgrad. Med. J., 1981, 57, 219 CrossRef CAS PubMed.
- M. Hirota, M. Ohmuraya and H. Baba, J. Gastroenterol., 2006, 41, 832 CrossRef CAS PubMed.
- C. Zhang, X. Liang, T. You, N. Yang, Y. Gao and P. Yin, Anal. Methods, 2017, 9, 2517 RSC.
- X. Lin, Z. Zhu, C. Zhao, S. Li, Q. Liu, A. Liu, L. Lin and X. Lin, Sens. Actuators, B, 2019, 284, 346 CrossRef CAS.
- S. Weng, Q. Liu, C. Zhao, G. Hong, Z. Jiang, L. Lin, Y. Chen and X. Lin, Sens. Actuators, B, 2015, 216, 307 CrossRef CAS.
- H. Li, M. Yang, D. Kong, R. Jin, X. Zhao, F. Liu, X. Yan, Y. Lin and G. Lu, Sens. Actuators, B, 2019, 282, 366 CrossRef CAS.
- M. Gao, F. Yu, C. Lv, J. Choo and L. Chen, Chem. Soc. Rev., 2017, 46, 2237 RSC.
- L. Feng, J. Ning, X. Tian, C. Wang, L. Zhang, X. Ma and T. James, Coord. Chem. Rev., 2019, 399, 213026 CrossRef CAS.
- D. Sato, T. Kondo and T. Kato, Bioorg. Med. Chem., 2018, 26, 3468 CrossRef CAS PubMed.
- W. Zhang, P. Zhang, S. Zhang and C. Zhu, Anal. Methods, 2014, 6, 2499 RSC.
- H. Chen, A. Fang, Y. Zhang and S. Yao, Talanta, 2017, 174, 148 CrossRef CAS PubMed.
- Y. Liu, F. Zhang, X. He, P. Ma, Y. Huang, S. Tao, Y. Sun, X. Wang and D. Song, Sens. Actuators, B, 2019, 294, 263 CrossRef CAS.
- C. Chan, H. Cheng, F. Hau, A. Chan and V. Yam, ACS Appl. Mater. Interfaces, 2019, 11, 31585 CrossRef CAS PubMed.
- X. Shi, W. Wei, Z. Fu, W. Gao, C. Zhang, Q. Zhao, F. Deng and X. Lu, Talanta, 2019, 194, 809 CrossRef CAS PubMed.
- M. Li, T. Chen, J. Gooding and J. Liu, ACS Sens., 2019, 4, 1732 CrossRef CAS PubMed.
- H. Zhang, Y. Gao, Y. Jiao, W. Lu, S. Shuang and C. Dong, Analyst, 2020, 145, 2212 RSC.
- R. Guo, B. Chen, F. Li, S. Weng, Z. Zheng, M. Chen, W. Wu, X. Lin and C. Yang, Sens. Actuators, B, 2018, 264, 193 CrossRef CAS.
- F. Li, Q. Cai, X. Hao, C. Zhao, Z. Huang, Y. Zheng, X. Lin and S. Weng, RSC Adv., 2019, 9, 12462 RSC.
- J. Huang, F. Li, R. Guo, Y. Chen, Z. Wang, C. Zhao, Y. Zheng, S. Weng and X. Lin, Microchim. Acta, 2018, 185, 260 CrossRef PubMed.
- Y. Chen, Z. Wang, X. Hao, F. Li, Y. Zheng, J. Zhang, X. Lin and S. Weng, Sens. Actuators, B, 2019, 297, 126784 CrossRef CAS.
- Z. Wang, Z. Xue, X. Hao, C. Miao, J. Zhang, Y. Zheng, Z. Zheng, X. Lin and S. Weng, Anal. Chim. Acta, 2020, 1103, 212 CrossRef CAS PubMed.
- M. Liu, J. Zhou, Y. He, Z. Cai, Y. Ge, J. Zhou and G. Song, Microchim. Acta, 2019, 186, 770 CrossRef CAS PubMed.
- Q. Ci, J. Liu, X. Qin, L. Han, H. Li, H. Yu, K. Lim, C. Zhang, N. Li and W. Huang, ACS Appl. Mater. Interfaces, 2018, 10, 35760 CrossRef CAS PubMed.
- S. Sun, L. Zhang, K. Jiang, A. Wu and H. Lin, Chem. Mater., 2016, 28, 8659 CrossRef CAS.
- Z. Qian, L. Chai, Q. Zhou, Y. Huang, C. Tang, J. Chen and H. Feng, Anal. Chem., 2015, 87, 7332 CrossRef CAS PubMed.
- V. Ramanan, B. Siddaiah, K. Raji and P. Ramamurthy, ACS Sustainable Chem. Eng., 2018, 6, 1627 CrossRef CAS.
- G. Mao, W. Peng, S. Tian, J. Zheng, X. Ji and Z. He, Sens. Actuators, B, 2019, 283, 755 CrossRef CAS.
- J. Li, Y. Wang, S. Sun, A.-M. Lv, K. Jiang, Y. Li, Z. Lia and H. Lin, Analyst, 2020, 145, 2982 RSC.
- D. Kim, J. Kim and T. Lee, Sens. Actuators, B, 2018, 264, 45 CrossRef CAS.
- J. Yang, N. Song and Q. Jia, Microchim. Acta, 2019, 186, 70 CrossRef PubMed.
- R. Taneja, L. Berry, U. Pappu, L. Stitt, P. Sayal, P. Allen, H. Hoogendoorn and A. Chan, J. Cardiothorac. Vasc. Anesth., 2014, 28, 1227 CrossRef CAS PubMed.
Footnotes |
| † Electronic supplementary information (ESI) available: Optical property and stability of CQDs; high-resolution XPS spectra of elements; fluorescence behaviour of CQDs in Try; quenching behaviour of CQDs in Pro; optimized condition of CQDs/Pro for Try detection; comparison of the performance of methods for Try; recovery of this method for Try in diluted serum. See DOI: 10.1039/d0ra03970e |
| ‡ Yiping Chen and Zuan Lin contributed equally to this work. |
| This journal is © The Royal Society of Chemistry 2020 |