DOI:
10.1039/D0RA03965A
(Paper)
RSC Adv., 2020,
10, 26813-26823
Rhodamine B dye is efficiently degraded by polypropylene-based cerium wet catalytic materials
Received
2nd May 2020
, Accepted 5th July 2020
First published on 17th July 2020
Abstract
Polypropylene-based cerium wet catalytic materials (Ce/PPNW-g-PAA) were prepared through ultraviolet grafting and ion exchange technology. They were used as effective and reusable heterogeneous catalysts for rhodamine B (RhB) degradation. The physicochemical properties of Ce/PPNW-g-PAA were characterized by Fourier transform infrared (FT-IR) spectroscopy, scanning electron microscopy (SEM), specific surface area measurements (BET), and X-ray photoelectron spectroscopy (XPS). The catalytic capacity of the Ce/PPNW-g-PAA–H2O2 system for the removal of RhB was tested in comparison with several other systems, which demonstrated that Ce/PPNW-g-PAA effectively promoted the oxidation and degradation of RhB by catalytic wet H2O2 oxidation. The results of the RhB degradation showed that Ce/PPNW-g-PAA exhibited excellent degradation performance by achieving a high removal rate for RhB (97.5%) at an initial RhB concentration of 100 mg L−1, H2O2 dosage of 5.0 mmol, Ce/PPNW-g-PAA dosage of 0.15 g L−1, and initial pH of 5.0 at 298 K. The degradation of RhB by Ce/PPNW-g-PAA conformed to the first-order kinetic reaction model. Consecutive experiments performed with the Ce/PPNW-g-PAA sample showed little activity decay, further confirming the high stability of the catalyst. In addition, the possible degradation mechanism of RhB was also investigated by XPS and electron paramagnetic resonance. The results suggested that Ce3+ and hydroxyl radical played important roles during the RhB degradation process.
1. Introduction
In the process of dyeing woolen fabrics, dyeing efficiency and colorfastness can be effectively improved by rare earth elements. To date, rare earth elements have been widely used in the processing of various natural and chemical fibers.1,2 During the cloth-washing process, a portion of dyes and rare earth elements are eluted, which results in severe environmental pollution.3,4 Therefore, it is extremely important to remove organic pollution from printing and dyeing wastewater to protect the ecological environment.5,6
Compared with the Fenton technology, heterogeneous catalytic wet peroxide oxidation technology is the ideal choice for separation of catalyst from reaction medium.7–9 In the heterogeneous catalytic wet peroxide oxidation system, the carrier plays an important role in the improvement of catalytic oxidation efficiency.10,11 Conventionally, the catalyst carrier has the following functions: (1) a significant increase in the contact area between the reaction liquid and the catalyst;12,13 (2) hydrophobicity and chemical stability improvement of the catalyst;14 (3) rapid separation and recycling of the catalyst.15 Therefore, due to the mild reaction conditions and ease with which the catalyst can be recycled, heterogeneous catalytic wet peroxide oxidation technology has become one of the most advanced oxidation technologies. The key to the heterogeneous catalytic wet peroxide oxidation technology lies in the research and development of high-efficiency and stable heterogeneous catalysts, which mainly depend on the choice of suitable carrier materials.
Polypropylene fiber/cloth is a polymer substrate with a large specific surface area and stable performance. Due to its high crystallinity, it exhibits excellent mechanical properties, and has the advantages of corrosion resistance and heat resistance. The defects of substrate damage caused by the attack of reactive species, such as hydroxyl radicals and superoxide radicals, do not occur when it is used.16–18 Additionally, fiber or cloth-like polypropylene can be easily recycled from water.19 It is even suitable for large-scale industrial application. Therefore, polypropylene substrate, which is a novel functional material, can be used as a heterogeneous catalytic wet peroxide oxidation reaction system for organic pollutant removal.
Rare earth elements have variable valence properties. They can promote the generation of hydroxyl radicals and electron transfer reactions, accelerate the cycle between different valence states of rare earth elements or iron elements, and improve the efficiency of heterogeneous catalytic wet peroxide oxidation degradation.8,9 Therefore, the introduction of rare earth elements into catalytic wet peroxide oxidation systems is conducive to the degradation of organic pollutants in water. The stable valence state of rare earth ions is usually positive trivalent, but under certain conditions, Ce undergoes a valence change and becomes positive tetravalent, which exists in some solids or in solution. In the catalytic wet peroxide oxidation system, the change trend of the valence state of rare earth ions and the process and nature of the transformation of the stable and abnormal valences are all conducive to the production of free radicals and improve the degradation efficiency for organic pollutants. Some researchers have used rare earth elements as catalytic materials,2 some use rare earth elements as doping elements to prepare composite metal oxide catalytic materials,20,21 and others directly use rare earth oxides as catalysts to degrade organic pollutants.22 All these materials exhibit more optimal removal performance.
Heterogeneous catalytic wet peroxide oxidation has shown very remarkable advantages in the treatment of refractory organic pollutants, and it is still being continuously improved.11,23,24 Discharged printing and dyeing wastewater not only contains organic pollutants, but also rare earth ions. These rare earth elements can be recovered by the reactive center of designed wet peroxide oxidation catalysts and fully utilized instead of adding extra ferrous ion as required in the heterogeneous catalytic wet peroxide oxidation system. Based on this assumption, we aimed to prepare polypropylene-based rare earth wet peroxide oxidation catalytic materials for the degradation and removal of organic dye pollutants in water.
In this work, polypropylene-based cerium wet catalytic materials (Ce/PPNW-g-PAA) were successfully fabricated using ultraviolet (UV) light grafting technology followed by an ion exchange process. The effectiveness and efficiencies of Ce/PPNW-g-PAA for rhodamine B (RhB) degradation were evaluated through a systematic investigation of experimental parameters including the Ce/PPNW-g-PAA and H2O2 dosage, initial RhB concentration, solution pH, and temperature. The reusability of Ce/PPNW-g-PAA was also studied by cycling experiments. Furthermore, the possible wet peroxide oxidation degradation mechanism was investigated.
2. Material and methods
2.1 Materials
Polypropylene non-woven (PPNW) fabric was obtained from Shenglian Co., Ltd. in China's Zhejiang province. The PPNW fabric was cut into 4 cm long × 3 cm wide rectangles and then placed in boiling water and thoroughly washed for approximately 30 min to remove the impurities physically attached during the production or transportation process. Finally, the PPNW fabric was placed into a Soxhlet extractor with acetone, extracted for 48 h, and dried at 60 °C. Acrylic acid (AA) was distilled under reduced pressure and refrigerated at 3–5 °C. All starting materials used in this work were of analytical grade and purchased from Sinopharm Chemical Reagent Co., Ltd.
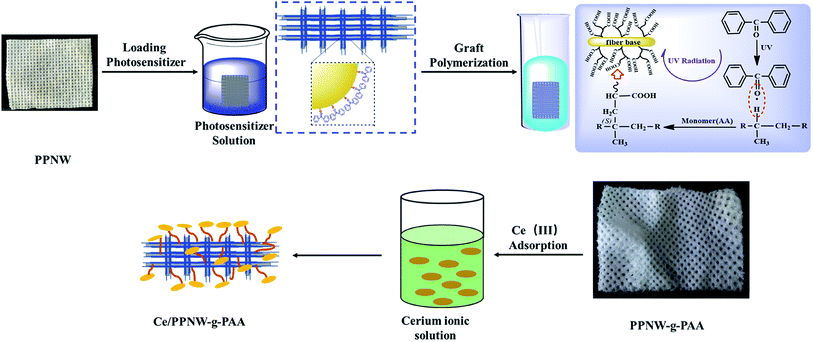
2.2 Preparation of polypropylene-based rare earth wet catalytic materials
The PPNW fabric was immersed in diphenylketone solution for a period and then removed and dried. The PPNW fabric treated with photosensitizer was placed into a quartz tube with a certain concentration of acrylic acid (AA). The quartz tube was fixed in the grafting device and piped with N2. Then, an UV lamp was turned on, and the grafting reaction time was set. After the reaction was completed, the PPNW fabric grafted with polymerized acrylic acid (PPNW-g-PAA) was removed from the quartz tube, repeatedly washed with hot water and anhydrous ethanol, and dried at 60 °C in a vacuum drying oven. Then, PPNW-g-PAA was placed into a leaching column and repeatedly eluted using 300 mg L−1 Ce3+ solution.
Once saturation was reached, PPNW-g-PAA was dried at 60 °C in a vacuum drying oven until constant weight was achieved. The resultant product was named as Ce/PPNW-g-PAA. A schematic illustration of the Ce/PPNW-g-PAA wet catalytic materials preparation process is shown in Fig. 1. The Ce/PPNW-g-PAA wet catalytic materials preparation cost is estimated in Table 1.
 |
| | Fig. 1 Schematic illustration of the Ce/PPNW-g-PAA wet catalytic material preparation process. | |
Table 1 Preparation cost estimation
| Raw materials and reagents |
Dosage (kg) |
Cost (USD per kg) |
| PPNW |
1 |
5.03 |
| AA |
1.05 |
9.76 |
| Cerium(III) nitrate hexahydrate |
0.009 |
47.35 |
| BP |
0.05 |
19.91 |
| Acetone |
4.33 |
5.23 |
| Ce/PPNW-g-PAA |
— |
19.68 |
2.3 Characterization
Fourier transform infrared (FT-IR) spectroscopy (Thermo Fisher IS50 FT-IR spectrophotometer) was employed to characterize all samples using the attenuated total reflectance (ATR) method. The morphology of the catalyst was determined by scanning electron microscopy (SEM) (Hitachi SU8010 SEM) at an acceleration voltage of 5 kV. Brunauer–Emmett–Teller (BET) was used to measure surface properties. X-ray photoelectron spectroscopy (XPS) measurements were performed using a PHI-5300 system with Al Kα radiation (1486.6 eV). The pH was measured using a digital pH meter (Shanghai, model SX-620 pH meter). Solution concentrations were measured by inductively coupled plasma mass spectrometry (ICP-MS, PerkinElmer Elan DRC-e).
2.4 Degradation experiments
Ce/PPNW-g-PAA and H2O2 were added to 50 ml 100 mg L−1 rhodamine B (RhB) solution. RhB was degraded under dark conditions in a 150 ml sealed glass bottle by shaking in a constant thermostatic rotary vibrator (HWZD, Gongyi, China) at 150 rpm. Next, 1.0 ml sample was collected and filtered through a 0.22 μm pore size filter membrane under different conditions (polytetrafluoroethylene, PTFE). The pH values of RhB solutions were adjusted with 0.1 mol L−1 HCl or NaOH solution. The absorbance of each sample was tested at the λmax (554 nm) of RhB using a spectrophotometer, and the concentration of RhB was calculated according to a standard curve. The decoloration percentage (Q%) of RhB is expressed as eqn (2-1):where A0 and At denote the initial absorbance of a RhB solution, and the absorbance of a RhB solution at time t, respectively.
Batch experiments were carried out to investigate the ability of Ce/PPNW-g-PAA to remove RhB. The effects of the Ce/PPNW-g-PAA dosage (0.05, 0.10, 0.15, 0.20, 0.25, 0.30 g), initial RhB concentration (60, 80, 100, 120, 140, 160, 180, 200 mg L−1), H2O2 dosage (1.25, 2.5, 5.0, 7.5, 10.0 mmol), solution pH (2, 3, 4, 5), and temperature (293, 303, 313 K) on the removal of RhB were assessed.
3. Results and discussion
3.1 FTIR analysis
The FTIR spectra of PPNW and Ce/PPNW-g-PAA are shown in Fig. 2a and b, respectively. For PPNW, the bands of 2916, 2867, 2837, 1455, and 1375 cm−1 exhibited the characteristic absorption bands of polypropylene at approximately: 2949, 2867 cm−1 (–C–CH3 stretching vibration), 2916, 2837 cm−1 (–C–CH2–C– stretching vibration), 1455, 1375 cm−1 (–CH3, –CH2– bending vibration), and equal interval bands from 1358 to 1167 cm−1 (–(CH2)n– bending vibration).25 By comparing the spectrum of PPNW before and after modification, it was found that the band at 1697 cm−1 in spectral line b was the –C![[double bond, length as m-dash]](https://www.rsc.org/images/entities/char_e001.gif) O band in graft polymerized PAA.26 The bands at 1546 and 1413 cm−1 were attributable to the asymmetrical and symmetrical stretching vibration of COO−.27 The bands at 1237 and 1413 cm−1 were attributed to the coupled vibration between the C–O stretching vibration in the carboxylic acid dimer28 and the –OH bending vibration in the plane with strong absorption in the range from 3200 to 3500 cm−1.26 It was noted that the –COOH in PAA appeared together with PPNW. The bands at 602 and 510 cm−1 were the vibration absorption of Ce–O, which suggested a possible linkage between –COO− and Ce. The infrared spectrum of Ce/PPNW-g-PAA maintained the characteristic absorption band of PPNW, which indicated that there were no obvious variations in the base material.
O band in graft polymerized PAA.26 The bands at 1546 and 1413 cm−1 were attributable to the asymmetrical and symmetrical stretching vibration of COO−.27 The bands at 1237 and 1413 cm−1 were attributed to the coupled vibration between the C–O stretching vibration in the carboxylic acid dimer28 and the –OH bending vibration in the plane with strong absorption in the range from 3200 to 3500 cm−1.26 It was noted that the –COOH in PAA appeared together with PPNW. The bands at 602 and 510 cm−1 were the vibration absorption of Ce–O, which suggested a possible linkage between –COO− and Ce. The infrared spectrum of Ce/PPNW-g-PAA maintained the characteristic absorption band of PPNW, which indicated that there were no obvious variations in the base material.
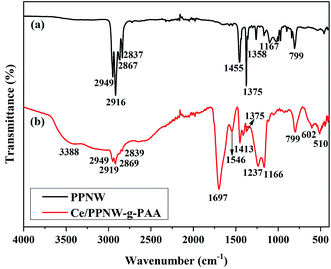 |
| | Fig. 2 FTIR spectra of (a) PPNW and (b) Ce/PPNW-g-PAA. | |
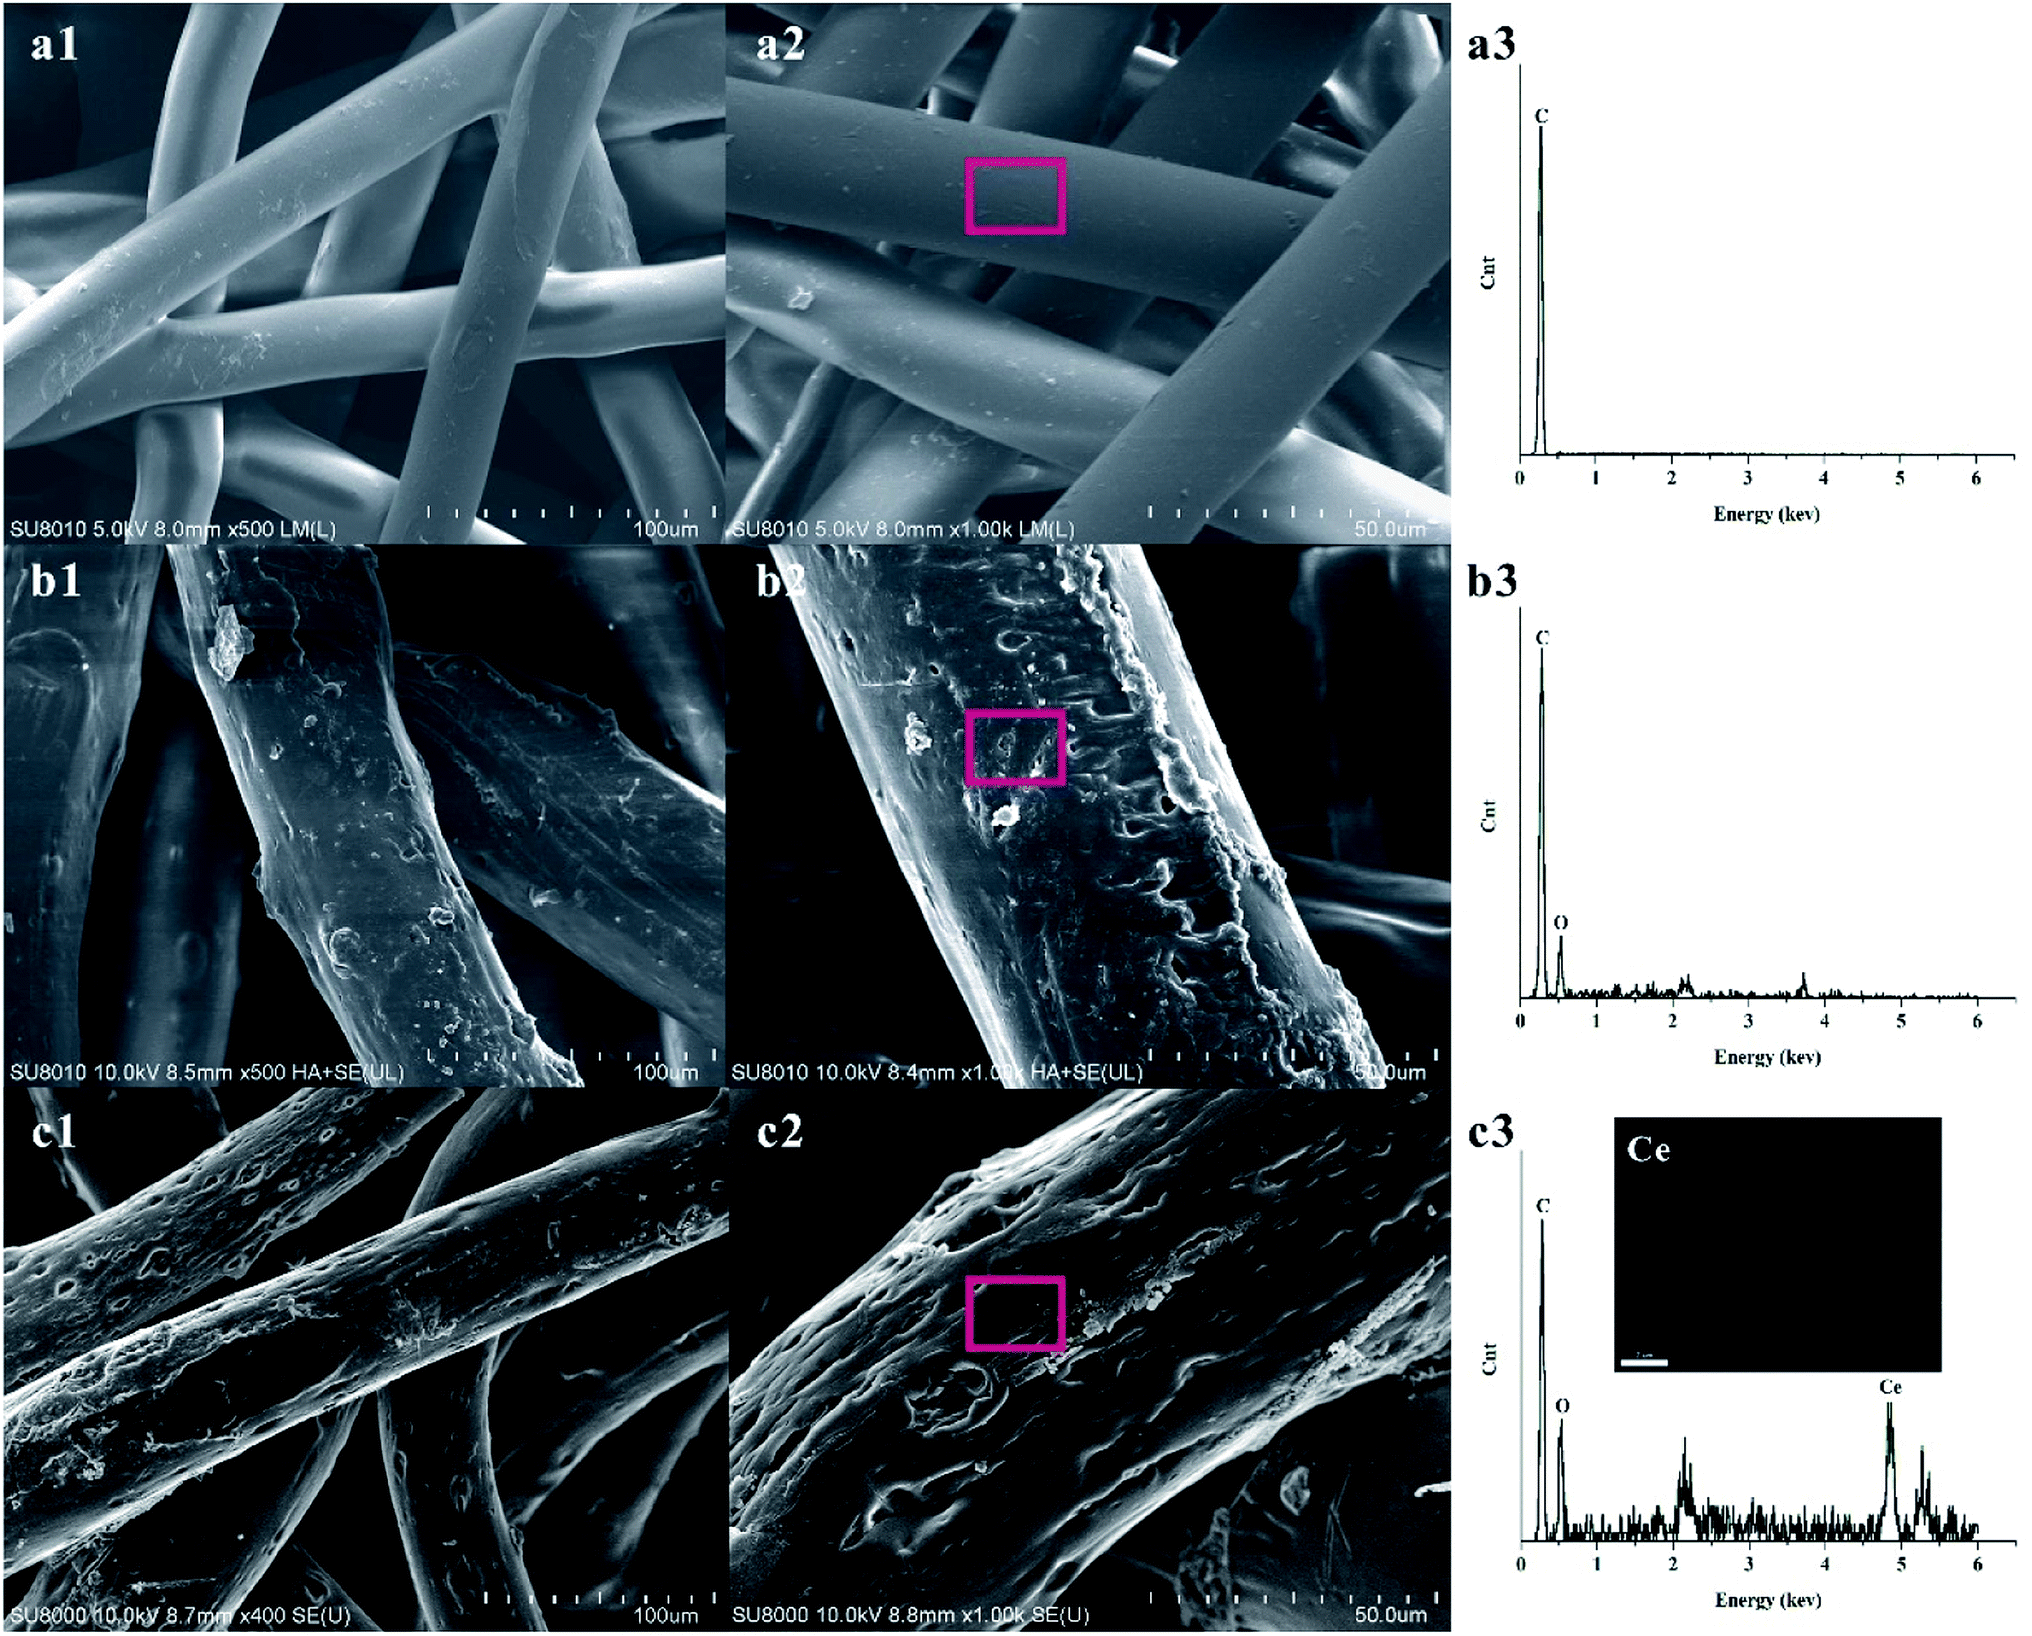
3.2 SEM/EDS analysis
Fig. 3 shows SEM images, EDS spectra of PPNW, PPNW-g-PAA, and Ce/PPNW-g-PAA, and Ce mapping analyses of Ce/PPNW-g-PAA. Fig. 3a1 and a2 shows that the surface of PPNW was relatively smooth, with uniform thickness of the fibers and a diameter of 20–25 μm. The EDS analysis of PPNW is shown in Fig. 3a3. As observed, the major component of pure amorphous graphite was carbon. The images of PPNW-g-PAA are presented in Fig. 3b1 and b2. The surface of PPNW-g-PAA was rough and exhibited a clear irregular graft topography. No obvious adhesion between each fiber can be observed. All fibers significantly thickened, and the diameter notably increased (above 35 μm) after the grafting of PAA.
 |
| | Fig. 3 SEM images and EDS spectra of PPNW (a1, a2, a3), PPNW-g-PAA (b1, b2, b3), Ce/PPNW-g-PAA (c1, c2, c3), and Ce mapping analyses of Ce/PPNW-g-PAA (c3). | |
The appearance of the peaks for oxygen in the EDS spectra of PPNW-g-PAA (Fig. 3b3) indicated the presence of –COOH on the surface of PPNW, thus verifying that PAA was grafted to PPNW. The images of Ce/PPNW-g-PAA (Fig. 3c1 and c2) show that the introduction of active center Ce did not destroy the structure of PPNW, nor change the polymer layer of grafting, which provides the adsorption vector for subsequent degradation of organic pollutants. The appearance of peaks for carbon, oxygen, and cerium in the EDS spectra and the Ce existing in SEM mapping analyses of Ce/PPNW-g-PAA shown in Fig. 3c3 indicate the presence of active center Ce in the structure of the catalytic materials, which increased the ability to degrade organic pollutants.
3.3 BET analysis
The BET test data for the 3 samples (PPNW, PPNW-g-PAA, and Ce/PPNW-g-PAA) are shown in Table 2. After PAA was grafted onto PPNW and covered its surface, the specific surface area decreased from 8.361 to 7.456 m2 g−1. Through the exchange of active center Ce3+, the specific surface area of Ce/PPNW-g-PAA was slightly decreased compared with PPNW-g-PAA. A portion of the pores on the surface of PPNW were occupied, and the pore volume of PPNW-g-PAA and Ce/PPNW-g-PAA naturally decreased, while the average pore size of PPNW-g-PAA and Ce/PPNW-g-PAA compared with PPNW increased because after the smaller holes were occupied, more large holes were left that were not occupied, and thus, the measurement value of pore size increased.
Table 2 BET analysis results
| Sample |
PPNW |
PPNW-g-PAA |
Ce/PPNW-g-PAA |
| Surface area (m2 g−1) |
8.361 |
7.456 |
7.250 |
| Pore volume (cm3 g−1) |
0.0224 |
0.0164 |
0.0168 |
| Pore size (nm) |
0.152 |
0.160 |
0.163 |
3.4 Catalytic activity of Ce/PPNW-g-PAA for degradation of RhB
The ability of PPNW-g-PAA to adsorb Ce3+ was tested by subjecting PPNW-g-PAA to 5 cyclic adsorption–desorption experiments, and the results are shown in Table 3. The data demonstrate that the capacity of PPNW-g-PAA to adsorb Ce3+ was stable, and the average maximum saturation adsorption capacity was 66.14 mg g−1. The stable adsorption capacity of PPNW-g-PAA ensured the uniformity of the number of Ce/PPNW-g-PAA active sites prepared and stability of the degradation performance for Ce/PPNW-g-PAA.
Table 3 Cyclic adsorption capacity of PPNW-g-PAA
| Number of cyclic adsorptions |
1 |
2 |
3 |
4 |
5 |
| Adsorption capacity (mg g−1) |
68.51 |
67.65 |
65.86 |
64.36 |
64.32 |
The capacity of the Ce/PPNW-g-PAA–H2O2 system for degradation of RhB was investigated in comparison with H2O2, PPNW, PPNW–H2O2, and Ce/PPNW-g-PAA systems. The initial RhB concentration, pH, and temperature were maintained over time. The results of RhB decolorization are illustrated in Fig. 4.
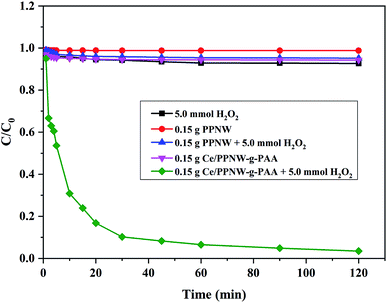 |
| | Fig. 4 The degradation of RhB under different conditions. Experimental conditions: initial RhB concentration = 100 mg L−1, initial pH = 5.0, and T = 298 K. | |
The RhB decolorization ratio was nearly 97.5% in the Ce/PPNW-g-PAA–H2O2 system after 120 min, while the other degradation systems showed a RhB decolorization ratio of less than 10% over the same amount of reaction time. The oxidization and degradation of RhB by H2O2 was poor without catalysts. The RhB removal by PPNW and Ce/PPNW-g-PAA was mainly attributable to physical adsorption in the defect of H2O2. These results demonstrated that Ce/PPNW-g-PAA effectively promoted the oxidation and degradation of RhB by the wet peroxide oxidation process. Additionally, there was no activity on PPNW for the degradation process, with poor RhB degradation in the PPNW–H2O2, PPNW, and H2O2 systems. Total organic carbon (TOC) removal results in different RhB degradation systems after 120 min are included in Table 4. The TOC removal was 80.61% in the Ce/PPNW-g-PAA–H2O2 system after 120 min, while the other degradation systems showed a TOC removal rate of less than 10% during the same reaction time.
Table 4 TOC removal of different RhB degradation systems
| System for degradation of RhB |
TOC removal/% |
| 5.0 mmol H2O2 |
6.1 |
| 0.15 g PPNW |
0.1 |
| 0.15 g PPNW + 5.0 mmol H2O2 |
3.7 |
| 0.15 g Ce/PPNW-g-PAA |
4.0 |
| 0.15 g Ce/PPNW-g-PAA + 5.0 mmol H2O2 |
80.6 |
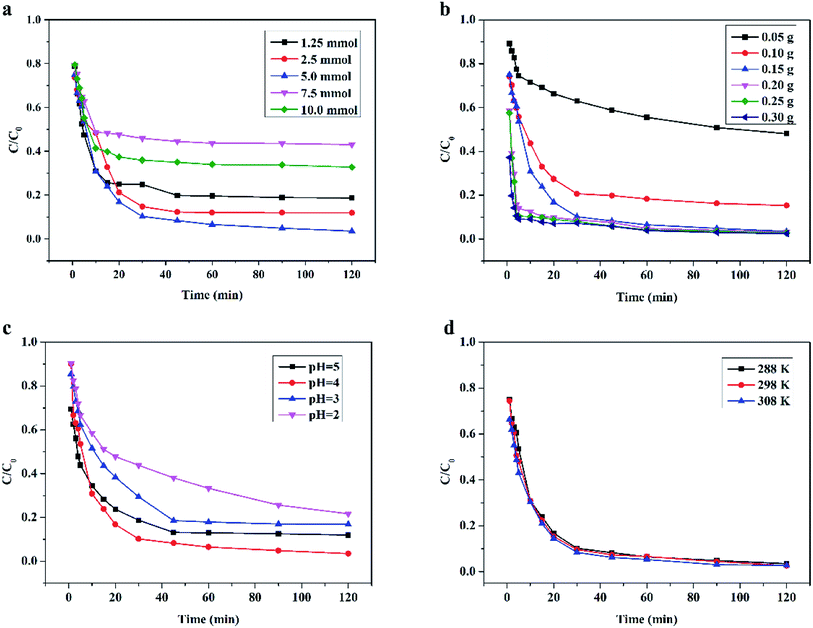
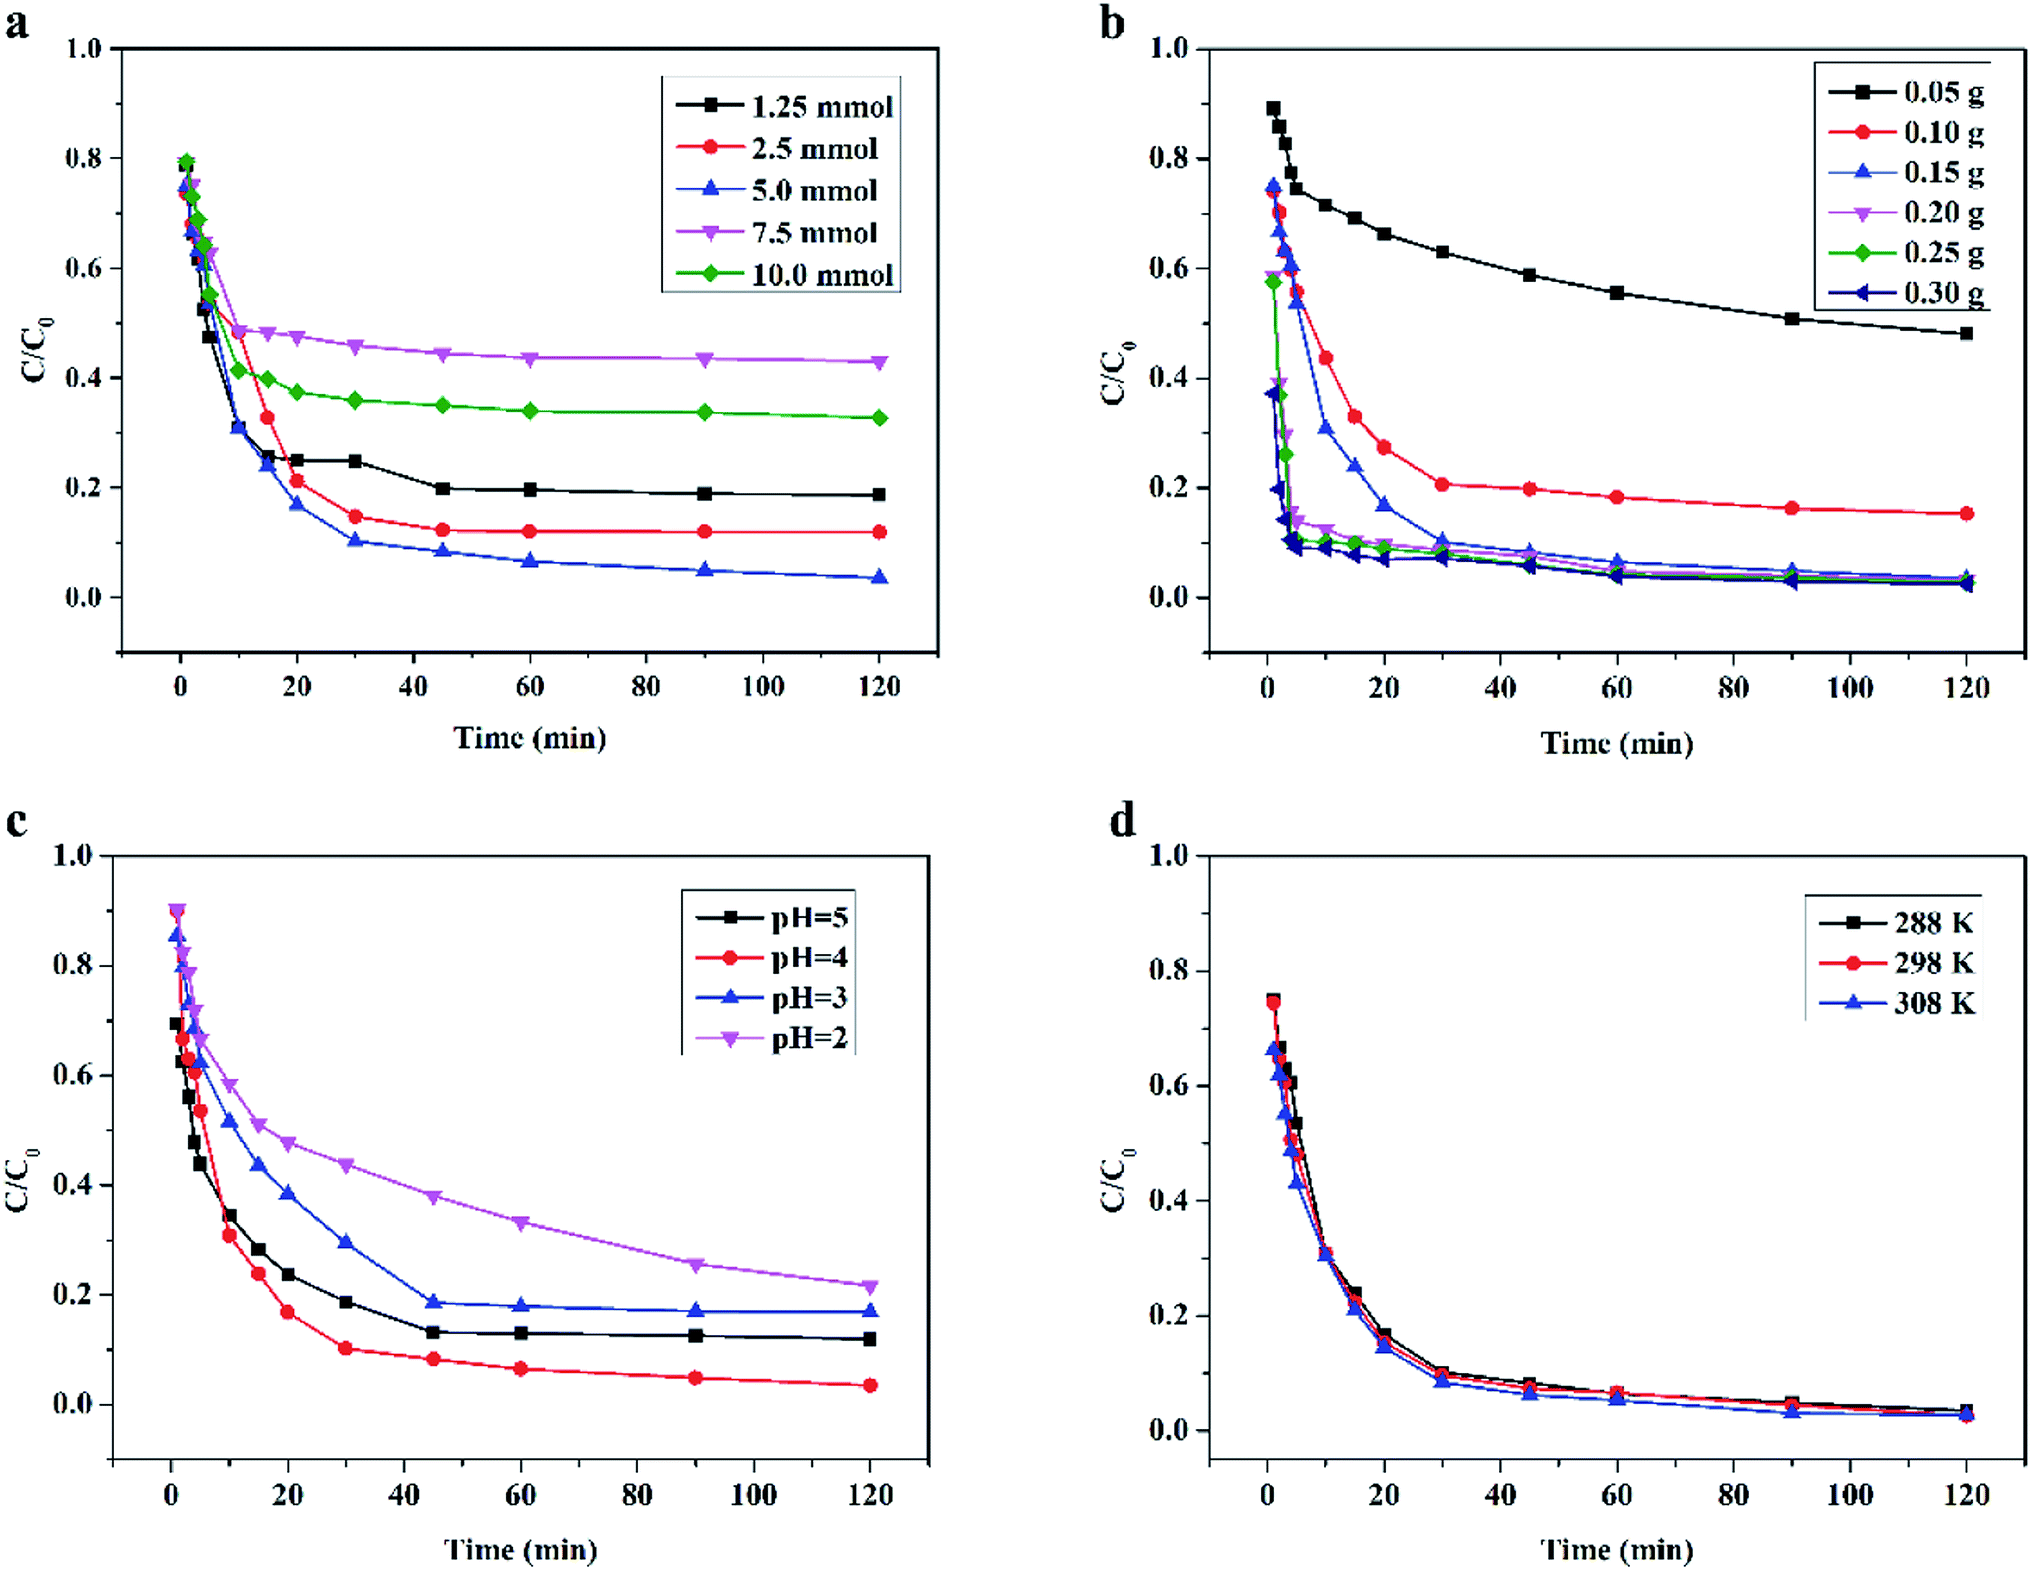
3.4.1 Effect of H2O2 dosage. The dosage of H2O2 in the wet peroxide oxidation system had a significant influence on the RhB degradation efficiency. The effect of H2O2 dosage on RhB degradation by the Ce/PPNW-g-PAA–H2O2 system was monitored at a fixed Ce/PPNW-g-PAA dosage of 0.15 g. The influence of H2O2 dosage is displayed in Fig. 5a. The degradation efficiency of RhB increased from 75.0 to 97.5% in 120 min as the H2O2 dosage increased from 1.25 to 10.0 mmol. This trend was due to the availability of H2O2, which decomposed active free radicals (HO·). From Fig. 5a, the effect of H2O2 dosage on RhB removal implied that the main driving force for RhB degradation was the decomposition of H2O2 to produce free radical HO·. When the H2O2 dosage increased from 1.25 to 10.0 mmol, the concentration of hydroxyl radicals increased in the Ce/PPNW-g-PAA–H2O2 system.
 |
| | Fig. 5 Effect of different parameters on the degradation of RhB in the heterogeneous catalytic wet peroxide oxidation process: (a) H2O2 dosage, (b) Ce/PPNW-g-PAA dosage, (c) initial pH, and (d) reaction temperature. Except for the investigated parameter, the other experimental conditions were: initial RhB concentration = 100 mg L−1, H2O2 dosage = 5.0 mmol, Ce/PPNW-g-PAA = 0.15 g L−1, initial pH = 5.0, and T = 298 K. | |
It was observed that RhB degradation was significantly reduced when the dosages of H2O2 were higher (7.5 and 10.0 mmol). The reason for this phenomenon was that excessive dosages of H2O2 would rapidly consume HO·, and HO· would then react with H2O2 and immediately produce  . The reactive radical activity of HO2˙ was weaker than that of HO·, and the presence of HO2 also inhibited the generation of HO·.29,30 The RhB degradation phenomenon was in accordance with the findings of previous studies.31,32 The RhB degradation ratios were also significantly reduced when the dosage of H2O2 was lower (1.25 and 2.5 mmol), which was due to the concentration of HO· being so low that insufficient free radicals were available for the degradation of RhB. Taking the removal efficiency and economic condition into account, it could be concluded from the above experimental results that 5.0 mmol H2O2 was the optimum dosage for RhB degradation.
3.4.2 Effect of Ce/PPNW-g-PAA dosage. The degradation of RhB in the Ce/PPNW-g-PAA–H2O2 system at pH 5.0 with different catalyst dosages (0.05 to 0.30 g L−1) was studied. The effect of Ce/PPNW-g-PAA dosage on the degradation of RhB is displayed in Fig. 5b. When the amount of Ce/PPNW-g-PAA was increased from 0.05 g L−1 to 0.15 g L−1, the degradation efficiency of RhB was increased from 46% to 97.5% at 120 min. This occurred because more active sites could be provided with the increase in Ce/PPNW-g-PAA dosage. More active sites would activate H2O2 to form more HO· for the degradation of RhB. When the dosage of Ce/PPNW-g-PAA increased from 0.15 to 0.30 g L−1, the efficiency of RhB degradation did not significantly improve, which demonstrated that an excessive dosage of Ce/PPNW-g-PAA had little influence on RhB degradation. This occurred because when an excess of materials was used to reduce scattering, the RhB degradation rate was retarded.33
3.4.3 Effect of initial pH. Conventionally, pH value is a very important factor affecting pollutant removal in heterogeneous catalytic wet peroxide oxidation reactions. The efficiency of Ce/PPNW-g-PAA in degrading RhB at different pH values (2.0–5.0) was investigated by the Ce/PPNW-g-PAA–H2O2 system. The results are shown in Fig. 5c. The degradation efficiency of RhB was higher at pH 4.0 and 5.0, and significantly decreased when the pH decreased. The degradation efficiency decreased from almost 100% at pH 4.0 and 5.0 to approximately 83.2% and 78.3% at pH 3.0 and 2.0 in 120 min, respectively. Similar results on the optimum pH for the heterogeneous catalytic wet peroxide oxidation process have been reported in other studies.29,34 The reason for the low efficiency of Ce/PPNW-g-PAA in RhB degradation is that HO˙ formation was hindered by the high concentration of hydrogen ions at lower pH, which significantly reduced the amount of active sites. At the same time, the oxidation potential of HO· would gradually decrease with an increase in hydrogen ions.35 The higher concentration of hydrogen ions would subsequently accelerate the decomposition of H2O2 and reduce the efficacy of H2O2 in the Ce/PPNW-g-PAA–H2O2 system at lower pH.
3.4.4 Effect of temperature. The effects of temperature on RhB degradation in the Ce/PPNW-g-PAA–H2O2 system was evaluated at temperatures ranging from 288 to 308 K. The degradation results are illustrated in Fig. 5d. RhB was efficiently degraded at all temperatures, and higher temperatures are favorable for RHB degradation. According to the experimental results (Fig. 5d), it could be concluded that efficient RhB degradation can be achieved under the appropriate temperatures, although if the reaction temperature increased beyond 308 K, the efficiency decreased. Furthermore, higher temperatures would accelerate the decomposition of H2O2 and also would garner higher expenses because of the facility requirements where the reactions would take place.
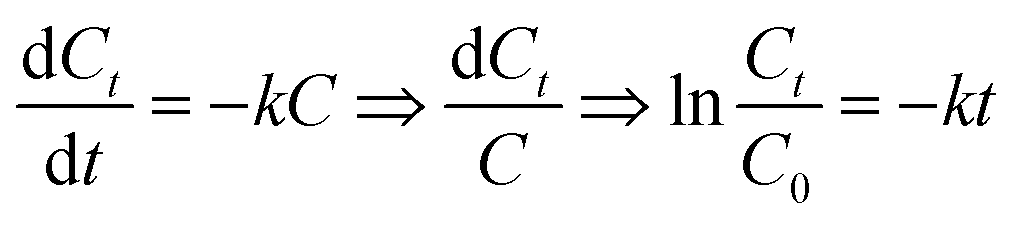
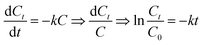
3.4.5 Degradation kinetics study. We used the first order reaction kinetics model (3-1) to analyze the degradation of RhB at different temperatures (experimental conditions: initial RhB concentration = 100 mg L−1, H2O2 dosage = 5.0 mmol, Ce/PPNW-g-PAA dosage = 0.15 g L−1 and initial pH = 5.0).| |
 | (3-1) |
C0: initial RhB concentration; Ct: concentration of RhB at any degradation time; k: reaction rate constant; t: any degradation time.The degradation kinetics study results are shown in Table 5, and the kinetic fitting curves at different temperatures appear in Fig. 6, which demonstrated that there was a satisfactory linear relationship between ln![[thin space (1/6-em)]](https://www.rsc.org/images/entities/char_2009.gif) (C/C0) and t at different temperatures. This indicated that the degradation of RhB by Ce/PPNW-g-PAA conformed to the first-order kinetic reaction model, and the reaction rate constant was first increased and then decreased. This occurred because increasing the reaction temperature raised the reaction rate, and the decolorization rate constant increased from 0.0284 to 0.0397 min−1 when the temperature varied from 288 to 298 K. However, as the temperature increased to 308 K, the rate constant decreased, which indicated that the high temperature caused the decomposition of H2O2 to accelerate. Based on these results, 298 K was chosen as the most optimal temperature in this study.
(C/C0) and t at different temperatures. This indicated that the degradation of RhB by Ce/PPNW-g-PAA conformed to the first-order kinetic reaction model, and the reaction rate constant was first increased and then decreased. This occurred because increasing the reaction temperature raised the reaction rate, and the decolorization rate constant increased from 0.0284 to 0.0397 min−1 when the temperature varied from 288 to 298 K. However, as the temperature increased to 308 K, the rate constant decreased, which indicated that the high temperature caused the decomposition of H2O2 to accelerate. Based on these results, 298 K was chosen as the most optimal temperature in this study.
Table 5 Degradation kinetic constants at different temperatures
| Temperature (K) |
k (min−1) |
R2 |
| 288 |
0.0284 |
0.96 |
| 298 |
0.0397 |
0.98 |
| 308 |
0.0314 |
0.96 |
 |
| | Fig. 6 Degradation of RhB kinetic fitting curves at different temperatures. | |
3.5 Reusability and stability of Ce/PPNW-g-PAA
The stability and reusability of an economic catalyst play a very important part in its application. To evaluate the effectiveness of the reusability of Ce/PPNW-g-PAA, a five-cycle experiment of RhB degradation was carried out under fixed conditions (initial RhB concentration 100 mg L−1, RhB dose 50 ml, Ce/PPNW-g-PAA dose 0.15 g, H2O2 dose 5.0 mmol, pH 5.0, and 298 K). The degradation efficiency and TOC removal results after performing five cycles are depicted in Fig. 7a. The RhB degradation efficiency decreased from 97.5% to 95.3%, and TOC removal decreased from 80.6% to 76.1% in 120 min after five cycles, indicating that the activity of Ce/PPNW-g-PAA slightly decreased.
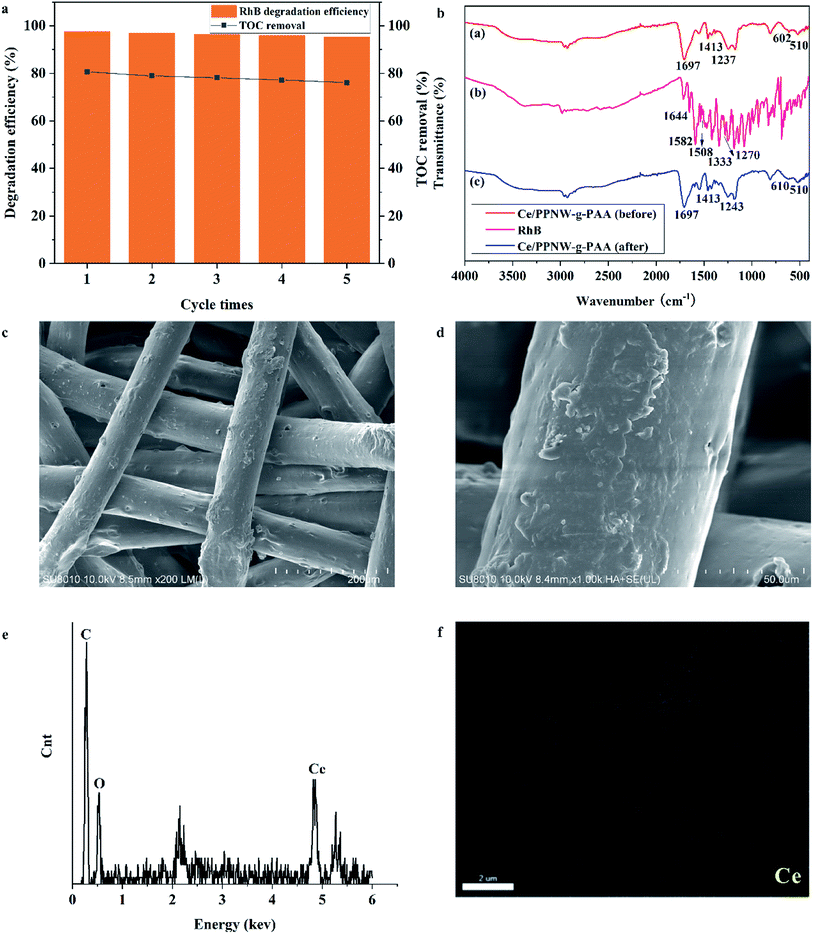 |
| | Fig. 7 Recycling of used Ce/PPNW-g-PAA. (a) Reusability of Ce/PPNW-g-PAA; (b) FTIR spectra of Ce/PPNW-g-PAA before and after the degradation reaction; (c, d, e, f) SEM images (200×, 1000×), EDS spectra, and Ce mapping analyses of Ce/PPNW-g-PAA after five cycles of degradation reaction, respectively. | |
Table 6 shows the relevant work of other researchers. A comparison of relevant research work with our work indicates that we obtained excellent reusability in the current study. It might be confirmed that Ce was steadily bonded with PPNW-g-PAA. Ce/PPNW-g-PAA was also used to decontaminate RhB in industrial water in Deqing county in Guangdong province. We obtained an efficiency of 93.9% for RhB degradation in industrial water, and an efficiency of 72.6% for TOC removal.
Table 6 Results compared with other research work
| No. |
Material |
Substance degraded |
Treatment efficiency |
Ref. |
| 1 |
Fe2O3@CeO2–ZrO2/palygorskite composite |
Congo red |
90% |
36 |
| 2 |
Fe–CeO2 |
Salicylic acid |
70% |
37 |
| 3 |
MWCNT–Ce/WO3 nanocomposite |
BTEX |
89% |
38 |
| 4 |
CuO/CeO2 |
Diclofenac |
86.62% |
39 |
| 5 |
Co3O4/CeO2 |
Tetracycline |
79% |
40 |
| 6 |
FeCeOx |
Diclofenac |
83% |
41 |
| 7 |
Ce0/Fe0–RGO |
Sulfamethazine |
78% |
42 |
| 8 |
Ce/PPNW-g-PAA |
RhB |
97.5% |
This work |
The FTIR spectra of Ce/PPNW-g-PAA before and after RhB degradation are presented in Fig. 7b, in which (a), (b), and (c) show the spectrum of Ce/PPNW-g-PAA (before RhB degradation), RhB, and Ce/PPNW-g-PAA (after RhB degradation), respectively. The bands of 1644, 1582, 1508, 1333, and 1272 cm−1 in spectral line (b) exhibit the characteristic absorption bands of RhB at approximately: 1644, 1582, 1508 cm−1 (–CC– stretching vibration), and 1333 and 1272 cm−1 (–C–N– stretching vibration). There is no characteristic absorption band of RhB after the degradation of RhB in spectral line (c), which indicated that the structure of Ce/PPNW-g-PAA had been modified and revealed excellent stability during the degradation of RhB.
The SEM images of Ce/PPNW-g-PAA after five cycles of RHB degradation are shown in Fig. 7c and d. There was no significant change on the surface of Ce/PPNW-g-PAA compared with the sample before RhB degradation (Fig. 3c1 and c2). This indicated that Ce/PPNW-g-PAA was stable for the degradation of RhB, and the grafted layer, bonded to the surface of PPNW, was not affected by free radicals.
The EDS spectra and SEM mapping analyses of Ce/PPNW-g-PAA after five cycles of RhB degradation are exhibited in Fig. 7e and f, respectively. The peaks for C, O, and Ce appear in the EDS spectra, and Ce exists in the SEM mapping analyses of the structure of catalytic materials. These detailed structural characterization results indicated that Ce stability existed on the material after the reusability studies.
The concentration data for Ce released during RhB degradation are shown in Table 7. From Table 7, in the first three cycles of cyclic RhB degradation, trace Ce could be detected. However, no Ce was detected in the fourth to fifth cycles of repeated RhB degradation. This might have occurred because a very small amount of Ce existed in Ce/PPNW-g-PAA in the form of physical adsorption during the process of active center replacement. This result indicated that Ce stability existed on the material, which is consistent with the above results.
Table 7 The concentration data for Ce released during RhB degradation
| Number of cyclic RhB degradations |
1 |
2 |
3 |
4 |
5 |
| Ce concentration (μg L−1) |
1.6 |
0.80 |
0.02 |
0 |
0 |
3.6 Degradation mechanism
3.6.1 Reactive oxygen species involved. To identify the radical products of the heterogeneous catalytic wet peroxide oxidation reaction occurring with Ce and H2O2, we used a spin trap, DMPO, and electron paramagnetic resonance EPR. DMPO was adopted as the spin trapping agent to capture the HO·. The evidence that hydroxyl radicals are produced or not in the presence of Ce/PPNW-g-PAA, H2O2, and Ce/PPNW-g-PAA and H2O2 is shown in Fig. 8. No detectable signal was observed in the sample of Ce/PPNW-g-PAA and H2O2, indicating that Ce/PPNW-g-PAA and H2O2 did not generate free radicals during the degradation of RhB.
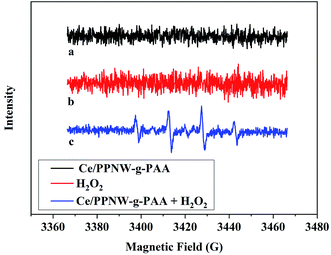 |
| | Fig. 8 DMPO spin-trapping EPR spectra of Ce/PPNW-g-PAA, H2O2, and Ce/PPNW-g-PAA and H2O2: (a) Ce/PPNW-g-PAA, (b) H2O2, and (c) Ce/PPNW-g-PAA + H2O2 in aqueous dispersion for DMPO-HO·. The reaction contained 5 mM H2O2 and 30 mM DMPO. | |
Spectral line c in Fig. 8 shows that four characteristic peaks of DMPO–OH adduct with a 1:2:2:1 ratio were detected in the aqueous solution of Ce/PPNW-g-PAA and H2O2, which was irradiated under simulated solar light. EPR experiments suggested that HO· played important roles during the RhB degradation catalytic process.21,43
3.6.2 Hydroxyl radical scavengers. In order to elucidate the oxidation mechanisms responsible for the degradation of RhB by Ce/PPNW-g-PAA, tert-butanol and methanol were used to scavenge hydroxyl radical. tert-Butanol and methanol had low affinity for the surfaces of catalytic materials and react predominantly with hydroxyl radicals in aqueous medium.44,45 From Fig. 9, the degradation of RhB was strongly inhibited in the presence of tert-butanol and methanol, decreasing from 97.5% to 1.2% and 4.8% after 120 min, respectively. These results indicated that RhB was mainly degraded by HO·, and that HO· plays a significant role in the degradation process. This behavior could be explained by the lower adsorption of RhB onto Ce/PPNW-g-PAA and indicated the existence of surface reactions on the Ce/PPNW-g-PAA catalyst, which are essential for the generation of HO· radicals.46
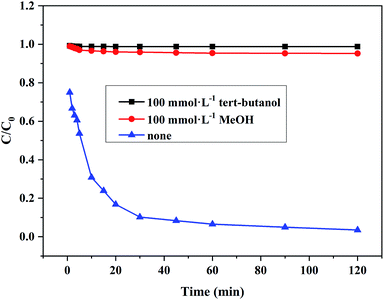 |
| | Fig. 9 Effects of different HO· scavengers on the degradation of RhB. Experimental conditions: initial RhB concentration = 100 mg L−1, H2O2 dosage = 5.0 mmol, Ce/PPNW-g-PAA dosage = 0.15 g L−1, initial pH = 5.0, and T = 298 K. | |
3.6.3 XPS analysis. Fig. 10a shows the full XPS spectrum of PPNW-g-PAA and Ce/PPNW-g-PAA samples. The elements of C and O were detected in the PPNW-g-PAA and Ce/PPNW-g-PAA samples, but the element of Ce was detected in Ce/PPNW-g-PAA, which implies that Ce and O are bonded together. The peak at 532.5 eV could be due to O 1s (Fig. 10b). The Ce 3d high resolution XPS spectrum is shown in Fig. 10c. The peaks at 885 eV and 904 eV are attributed to Ce3+. The peaks located at 882 eV and 901 eV indicate that Ce ion has a +4 oxidation valance state.47 The peaks corresponding to Ce3+ were labeled as “V1, V2”, and the peaks corresponding to Ce4+ were labeled as “V3, V4”, respectively. However, the intensity of V3, V4 is much weaker than that of V1, V2, indicating that Ce3+ was the main valence state. The XPS results show the main existence of Ce3+ in the Ce/PPNW-g-PAA sample.
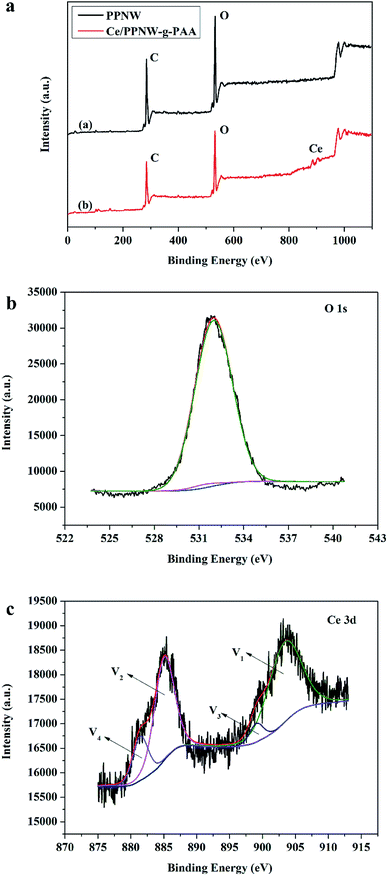 |
| | Fig. 10 (a) Full XPS spectrum of PPNW and Ce/PPNW-g-PAA, and the high resolution XPS spectra of (b) O 1s and (c) Ce 3d. | |
Based on the above results, a possible mechanism for the degradation of RhB by the Ce/PPNW-g-PAA catalyst is proposed. We can infer that HO· forms from a series of reactions analogous to heterogeneous catalytic wet peroxide oxidation reactions:43,48
| Ce3+ + H2O2 + H+ → Ce4+ + HO˙ + H2O |
| Ce4+ + HO2− → Ce3+ + O2 + H+ |
Cerium is a rare earth inner transition metal, and its ionic form served to prepare novel Ce/PPNW-g-PAA with reduced cerium sites in the structure of the prepared material. In a weak acid environment, Ce3+ reacts with H2O2 to produce HO·, and Ce3+ is converted into Ce4+. The reactivity of surface-related Ce3+ sites is the most likely source of reactive oxygen species.21 We have provided substantial evidence from the EPR spin-trapping analysis that HO· is generated in the presence of Ce3+ and H2O2. The Ce/PPNW-g-PAA directly absorbs the RhB dye molecules on its surface, and HO· with high activity is produced by H2O2 and degrades the RhB dye molecules in the aqueous solution. PPNW-g-PAA was highly enriched with Ce3+ after grafting PAA on the PPNW, which provided a large number of active centers for RhB degradation and improved the RHB degradation efficiency. PPNW is a cloth material with a convenient form for use, and it can be adjusted according to practical application.
4. Conclusions
Polypropylene-based rare earth wet catalytic materials were successfully prepared by ultraviolet light grafting and ion exchange technology. The prepared heterogeneous wet peroxide oxidation catalysts efficiently degraded RhB from aqueous solution. The optimal removal rate of RhB (97.5%) was obtained at an initial RhB concentration of 100 mg L−1, RhB dose of 50 ml, Ce/PPNW-g-PAA dose of 0.15 g, H2O2 dose of 5.0 mmol, pH = 5.0, and T = 298 K. Moreover, the reusability results indicated that the prepared Ce/PPNW-g-PAA materials exhibited satisfactory reusability and stability. Additionally, according to the results of the XPS and EPR tests, the possible degradation mechanism was discussed, and the possible catalytic degradation pathway of RhB by Ce/PPNW-g-PAA with wet peroxide oxidation was proposed through a Ce3+ oxidation–reduction reaction.
Conflicts of interest
There are no conflicts to declare.
Acknowledgements
This work was supported by the Natural Science Foundation of Hubei Province (2019CFB256), the National Key R&D Program of China (No: 2017YFB0310805), and the Science and Technology Project of the Hubei Geological Bureau (KJ2019-28).
References
- D. Caschera, F. Federici, T. de Caro, B. Cortese, P. Calandra, A. Mezzi, R. Lo Nigro and R. G. Toro, Appl. Surf. Sci., 2018, 427, 81–91 CrossRef CAS.
- P. Srivastava, S. Goyal and P. K. Patnala, Ultrason. Sonochem., 2014, 21, 1994–2009 CrossRef CAS PubMed.
- M. Oveisi, M. A. Asli and N. M. Mahmoodi, J. Hazard. Mater., 2018, 347, 123–140 CrossRef CAS PubMed.
- J. Wang, T. Zhang, Y. Mei and B. Pan, Chemosphere, 2018, 201, 621–626 CrossRef CAS PubMed.
- S.-M. Lam, J.-C. Sin and A. R. Mohamed, Mater. Sci. Semicond. Process., 2016, 47, 62–84 CrossRef CAS.
- W. Ye, B. X. Zhao, H. Gao, J. J. Huang and X. L. Zhang, J. Porous Mater., 2016, 23, 301–310 CrossRef CAS.
- H. H. Chen, J. Motuzas, W. Martens and J. C. D. da Costa, J. Environ. Sci., 2020, 90, 110–118 CrossRef PubMed.
- F. Tomul, Y. Arslan and H. N. Tran, Ind. Eng. Chem. Res., 2019, 58, 22084–22093 CrossRef CAS.
- H. M. Xie, J. Zeng and G. L. Zhou, Environ. Sci. Pollut. Res., 2020, 27, 846–860 CrossRef CAS PubMed.
- A. D. Manasrah, G. Vitale and N. N. Nassar, Appl. Catal., B, 2020, 264 Search PubMed.
- S. Y. Zhang, Y. Z. Han, L. Wang, Y. L. Chen and P. Y. Zhang, Chem. Eng. J., 2014, 252, 141–149 CrossRef CAS.
- J. Lin, M. Sun, X. Liu and Z. Chen, Chemosphere, 2017, 184, 664–672 CrossRef CAS PubMed.
- A. L. Garcia-Costa, J. A. Zazo, J. J. Rodriguez and J. A. Casas, Appl. Catal., B, 2017, 218, 637–642 CrossRef CAS.
- H. Y. He, Appl. Surf. Sci., 2017, 421, 260–267 CrossRef CAS.
- D. Fan, L. Ding, H. Huang, M. Chen and H. Ren, J. Hazard. Mater., 2017, 340, 390–398 CrossRef CAS PubMed.
- M. Kitis, C. D. Adams and G. T. Daigger, Water Res., 1999, 33, 2561–2568 CrossRef CAS.
- L. F. Gonzalez-Bahamon, F. Mazille, L. N. Benitez and C. Pulgarin, J. Photochem. Photobiol., A, 2011, 217, 201–206 CrossRef CAS.
- R. Joshi, J. Friedrich and M. Wagner, J. Adhes. Sci. Technol., 2011, 25, 283–305 CrossRef CAS.
- Y. Lv, C. Zhang, A. He, S. J. Yang, G. P. Wu, S. B. Darling and Z. K. Xu, Adv. Funct. Mater., 2017, 27, 1–27 Search PubMed.
- F. Li, Y. C. Dong, W. M. Kang, B. W. Cheng, X. Qu and G. X. Cui, Bull. Korean Chem. Soc., 2016, 37, 1934–1941 CrossRef CAS.
- J. Zhu, Z. Zhu, H. Zhang, H. Lu, Y. Qiu, L. Zhu and S. Kuppers, J. Colloid Interface Sci., 2016, 481, 144–157 CrossRef CAS PubMed.
- S. Ben Hammouda, F. P. Zhao, Z. Safaei, I. Babu, D. L. Ramasamy and M. Sillanpaa, Appl. Catal., B, 2017, 218, 119–136 CrossRef CAS.
- K. Huang, Y. Xu, L. G. Wang and D. F. Wu, RSC Adv., 2015, 5, 32795–32803 RSC.
- K. Huang, J. J. Wang, D. F. Wu and S. Lin, RSC Adv., 2015, 5, 8455–8462 RSC.
- Q. Zhou, H. Yang, C. Yan, W. Luo, X. Li and J. Zhao, Colloids Surf., A, 2016, 501, 9–16 CrossRef CAS.
- Y. L. Tang, Y. Q. Li, Y. J. Zhang, C. H. Mu, J. F. Zhou, W. H. Zhang and B. Shi, Ind. Eng. Chem. Res., 2020, 59, 3383–3393 CrossRef CAS.
- V. K. Gupta, S. Agarwal, P. Singh and D. Pathania, Carbohydr. Polym., 2013, 98, 1214–1221 CrossRef CAS PubMed.
- Y. Chen, Y. J. Zhao, S. Y. Zhou, X. Z. Chu, L. L. Yang and W. H. Xing, Appl. Clay Sci., 2009, 46, 148–152 CrossRef CAS.
- Z. R. Lin, L. Zhao and Y. H. Dong, Chem. Eng. J., 2017, 326, 201–209 CrossRef CAS.
- L. Li, M. Zhang, P. Tian, W. Gu and X. Wang, Ceram. Int., 2014, 40, 13813–13817 CrossRef CAS.
- J. Y. Niu, S. W. Zhang, H. N. Chen, J. W. Zhao, P. T. Ma and J. P. Wang, Cryst. Growth Des., 2011, 11, 3769–3777 CrossRef CAS.
- B. L. Fei, N. P. Deng, J. H. Wang, Q. B. Liu, J. Y. Long, Y. G. Li and X. Mei, J. Hazard. Mater., 2017, 340, 326–335 CrossRef CAS PubMed.
- E. S. Emidio, P. Hammer and R. F. P. Nogueira, Chemosphere, 2020, 241 Search PubMed.
- Y. Y. Liu, X. M. Liu, Y. P. Zhao and D. D. Dionysiou, Appl. Catal., B, 2017, 213, 74–86 CrossRef CAS.
- H. Chen, Z. Sun, Z. Yang, Z. Zhang, J. Wang, M. Feng and Q. Yang, Environ. Sci. Pollut. Res. Int., 2017, 24, 18575–18584 CrossRef CAS PubMed.
- J. Ouyang, Z. Zhao, S. L. Suib and H. M. Yang, J. Colloid Interface Sci., 2019, 539, 135–145 CrossRef CAS PubMed.
- W. Wang, Q. Zhu, F. Qin, Q. G. Dai and X. Y. Wang, Chem. Eng. J., 2018, 333, 226–239 CrossRef CAS.
- M. Ranjbar, N. Majidian and M. Samipourgiri, Electrocatalysis, 2019, 10, 628–642 CrossRef CAS.
- J. Zhu, G. M. Zhang, G. Xian, N. Zhang and J. W. Li, Front. Chem., 2019, 7, 1–10 CrossRef PubMed.
- R. P. Guan, X. Z. Yuan, Z. B. Wu, L. B. Jiang, J. Zhang, Y. F. Li, G. M. Zeng and D. Mo, Sep. Purif. Technol., 2019, 212, 223–232 CrossRef CAS.
- S. Chong, G. M. Zhang, N. Zhang, Y. C. Liu, J. Zhu, T. Huang and S. Y. Fang, Ultrason. Sonochem., 2016, 32, 231–240 CrossRef CAS PubMed.
- Z. Wan and J. L. Wang, Environ. Sci. Pollut. Res., 2016, 23, 18542–18551 CrossRef CAS PubMed.
- E. G. Heckert, S. Seal and W. T. Self, Environ. Sci. Technol., 2008, 42, 5014–5019 CrossRef CAS PubMed.
- C. R. Keenan and D. L. Sedlak, Environ. Sci. Technol., 2008, 42, 1262–1267 CrossRef CAS PubMed.
- L. J. Xu and J. L. Wang, Appl. Catal., B, 2012, 123, 117–126 Search PubMed.
- Y. Q. Zhang, Y. J. Xiao, J. F. Zhang, V. W. C. Chang and T. T. Lim, J. Environ. Chem. Eng., 2017, 5, 1133–1139 CrossRef CAS.
- Y. F. Su, Z. C. Tang, W. L. Han, P. Zhang, Y. Song and G. X. Lu, Crystengcomm, 2014, 16, 5189–5197 RSC.
- B. Zhang, H. You, F. Wang and Z. Z. Yang, Catal. Commun., 2017, 88, 56–59 CrossRef CAS.
Footnote |
| † Present address: Engineering Research Center of Nano-Geomaterials of Ministry of Education, Faculty of Materials Science and Chemistry, China University of Geosciences, 388 Lumo Road, Wuhan 430074, P. R. China |
|
| This journal is © The Royal Society of Chemistry 2020 |
Click here to see how this site uses Cookies. View our privacy policy here. 
 Open Access Article
 This Open Access Article is licensed under a Creative Commons Attribution-Non Commercial 3.0 Unported Licence
 *a,
Yunfei Zhoua,
Xiumei Qiub and
Chen Liua
*a,
Yunfei Zhoua,
Xiumei Qiub and
Chen Liua


 . The reactive radical activity of HO2˙ was weaker than that of HO·, and the presence of HO2 also inhibited the generation of HO·.29,30 The RhB degradation phenomenon was in accordance with the findings of previous studies.31,32 The RhB degradation ratios were also significantly reduced when the dosage of H2O2 was lower (1.25 and 2.5 mmol), which was due to the concentration of HO· being so low that insufficient free radicals were available for the degradation of RhB. Taking the removal efficiency and economic condition into account, it could be concluded from the above experimental results that 5.0 mmol H2O2 was the optimum dosage for RhB degradation.