 Open Access Article
Recovery of waste gold for the synthesis of gold nanoparticles supported on radially aligned nanorutile: the growth of carbon nanomaterials
Farai Dziike *ab,
Paul J. Franklyna,
Lerato Hlekelele
 c and
Shane Durbachab
aMolecular Science Institute, School of Chemistry, University of the Witwatersrand, Johannesburg, 2050, South Africa. E-mail: farai.dziike@gmail.com
bDST-NRF Centre of Excellence in Strong Materials, University of the Witwatersrand, WITS, 2050, Johannesburg, South Africa
cPolymers and Composites, Materials and Manufacturing Science, CSIR, Pretoria, 0001 South Africa
First published on 28th July 2020
Abstract
Precious and expensive metals are lost each year through the discarding of old jewellery pieces and mine tailings. In this work, small amounts of gold were recovered by digestion with aqua regia from waste tailings. The recovered gold in the form of HAuCl4 was then used to deposit Au0 onto radially aligned nanorutile (RANR) to form a supported catalyst material. The support material, RANR, was synthesized using the hydrothermal technique whereas the deposition of gold was achieved using the deposition–precipitation with urea method at various loadings. Electron microscopy was used to show that the structure of the support is a sphere formed by multiple nanorods aligned in a radial structure. The Au nanoparticles were observed at the tips of the nanorods. It was confirmed by XRD that the support was indeed a rutile phase of TiO2 and that the Au nanoparticles had a face-centred cubic structure. The various catalysts were then used to synthesize carbon nanomaterials (CNMs) using the chemical vapour deposition technique. A parametric study varying the reaction temperature, duration and carbon source gas flow rate was conducted to study the effects these conditions have on the structural properties of the resulting CNMs. Here, it was found that mainly carbon nanofibers were formed and that the different reaction conditions influenced their graphicity, width, structure and thermal properties.
Introduction
Mineral waste found at mine dumps contains a lot of platinum group metals that are both valuable and intoxicating to flora and fauna.1 Some of the waste is processed to recover minor or associated minerals and metals of value such as gold, titanium, uranium and fluorine, and progress has been made toward processing or utilizing others but more remains to be done. Large volumes of materials still are discarded annually accounting for the loss of significant mineral and metal value which might be recovered to augment our primary mineral and metal resource supply base. In addition to the mineral values lost, the disposal of these materials imposes a substantial economic and environmental burden on the industry and the public. Special attention needs to be given to encouraging their recycling.In this regard, we have endeavoured to recover gold from waste tailings. Apart from its use in jewellery, gold is a very useful material, particularly in its nano form, in biological systems,2,3 heterogeneous catalysis,4,5 plasmonics,6,7 analytical sensors8–10 and devices'.11,12 In heterogeneous catalysis, gold nanoparticles are more useful when supported on other materials in a way that increases (i) the surface area of the active, (ii) stability and (iii) dispersion of the particles over a large surface area. All these improvements yield better catalyst as it has been shown previously with gold and other nano-catalysts in a variety of applications. These include photocatalysis, growth of carbonaceous nanomaterials, water–gas shift reactions and hydrogenation reactions among other heterogeneous catalysis reactions.5,13–15
It was then decided that the gold beneficiated would be used to synthesize gold nanoparticles that would be supported on a TiO2 nanostructure. The choice of TiO2 as catalyst support is supported by extensive research and has been shown to have distinct advantages over other types of supports. For instance, Kumi et al. demonstrated that the reduction temperature of ruthenium nanoparticles supported on rutile-TiO2 was superior to that of unsupported ruthenium, showing increased thermal stability.16 In another study by Klimova et al. they demonstrated that molybdenum catalysts supported on TiO2 were more potent at hydrodesulfurization than their reference materials that did not contain TiO2.
The structural properties of the support material are also an important factor to consider when designing a supported catalyst. For instance, high-temperature catalytic reactions like the growth of carbon nanomaterials, the TiO2-anatase would go through a polymorphism transition at temperatures above 500–600 °C. Rutile, on the other hand, is a much more stable polymorph and can handle the temperatures usually used for the growth of carbon nanomaterials as we had previously demonstrated.17 In other applications, the other polymorphs of TiO2 are preferable over rutile. For instance, the three polymorphs of TiO2 were used as support material for gold for the catalytic oxidation of carbon monoxide.18 They found that exposing the catalysts to temperatures above 300 °C resulted in their deactivation, particularly the Au supported on anatase catalyst while the Au supported on brookite catalyst was the least deactivated.18
Another consideration to be mindful of using TiO2 based catalyst support is the structure of support itself. Nano TiO2 particles often agglomerate and have low surface areas and this limits its effectivity. Franklyn and co-workers observed that gold nanoparticles supported on TiO2 nanoparticles demonstrated oxidized CO almost as efficient as gold nano supported on radially aligned nanorutile at low temperatures.19 However, at high temperatures, Au supported on TiO2 nanoparticles was deactivated because of sintering, a phenomenon commonly observed for catalysts supported on TiO2 nanoparticles.19–23
The application of choice in this work is to use the catalyst to synthesize carbon nanomaterials. This application was selected because the envisioned product consists of carbon nanomaterials, TiO2 and Au nanoparticles, a combination of materials that has been shown to be effective for the photodegradation of organic materials in wastewater.7,20,24–26 furthermore, this study is a parametric study that reports on some of the factors that have been reported to influence the growth of carbon nanomaterials using a CVD setup.27–31
Experimental
Synthetic procedures
Materials characterization
The supported Au–RANR catalysts and the carbon products from CVD reactions were analysed using powder X-ray diffraction (PXRD). This was used to determine crystallographic phases of the catalyst particles on a Bruker D2 Phaser diffractometer in a 2θ range from 7° to 120 using Co Kα radiation. The morphology and material dimensions such as particle sizes of catalyst particles, diameters of the CNFs and the as-synthesised CVD products were determined by transmission electron microscopy (TEM) and scanning electron microscopy (SEM). For TEM analysis, the samples were prepared by dispersing a small amount of the materials in methanol with slight sonication. The drops of the dispersed material were placed on a Cu micro-grid. An FEI Spirit operated at a voltage of 120 kV was employed. For SEM analysis, the samples were directly mounted on a carbon tape on a sample holder stub. An FEI SEISS FIB was used for SEM observation. The average particle size was determined using ImageJ and statistical analysis on TEM and SEM micrographs. A minimum of 200 particles was measured on the TEM micrographs using ImageJ software.Energy-dispersive spectroscopy (EDS) analysis of the chemical composition of the carbon nanomaterials and catalyst surface areas was performed using the TEM FEI Spirit 120 kV. Thermogravimetric analysis (TGA) of the supported catalysts and the carbon materials was performed to determine the thermal stability of these materials. This was supplemented by temperature-programmed reduction (TPR) analysis of the precursor catalyst material and the as-synthesised CVD carbon materials. Raman spectroscopy was used to characterise the sp2 carbons from 0 to 3D such as 3D graphite, 2D graphene, 1D carbon nanotubes, and 0D fullerenes. The 1D and 2D Laser Raman spectroscopy data were used to explain the crystallographic nature of the carbon nanomaterials synthesized in this work. Furthermore, energy-probe microanalysis (EPMA) was used to determine the chemical composition of the carbon nanomaterials and catalyst surface areas and the spatial distribution of materials in the catalyst composite by WDS spectra and EPMA mapping and profiling.
Results and discussion
PXRD and EPMA analyses of catalyst
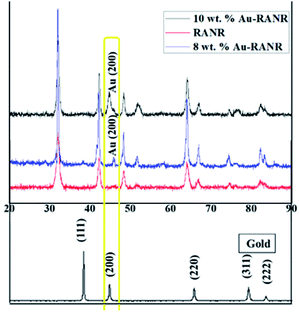
To ascertain that indeed the gold nanoparticles were supported TiO2-rutile, XRD and EPMA analyses were conducted. The PXRD patterns of the support and 10 and 8% Au supported on RANR are shown in Fig. 1.The PXRD pattern of gold nanoparticles is characterized by 4 peaks as shown in Fig. 1. The 2θ positions of these peaks are consistent with the face-centred cubic structure of gold nanoparticles (JCPDS file no. 01-1174). This is consistent with previous reports stating that unless gold nanoparticles are smaller than 2 nm they assume the f.c.c. structure.32
On the other hand, the PXRD pattern of RANR is consistent with that of nano-rutile with some of the major reflections indexed as (110), (101), (111), (211), (220), (002), (311), (301) and (112) observed at respective 2θ positions of 32, 43, 46, 49, 52, 64, 67, 75 and 77° (JC JCPDS, no. 21-1276). Furthermore, when comparing the PXRD pattern of RANR, Au and those of Au–RANR, it was found that only one peak (at 2θ position of 45°) attributable to Au nanoparticles was present in the PXRD patterns of the supported catalysts. The absence of the other Au peaks was attributed to the high crystallinity of RANR particles.
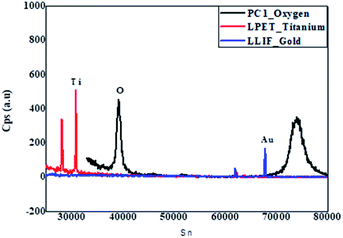
Detailed studies into the chemical composition of the RANR were done using WDS. The WDS spectra of the 10 wt% Au–RANR in Fig. 2 shows strong Ti and O peaks at lower signal points (Sn) of 32![[thin space (1/6-em)]](https://www.rsc.org/images/entities/char_2009.gif) 000 and 39
000 and 39![[thin space (1/6-em)]](https://www.rsc.org/images/entities/char_2009.gif) 000 respectively. However, at higher Sn-value, the Au peak became substantively significant. Notably, the cps of Au at this Sn is almost the same intensity as that of O at its lower Sn-value. The inset in Fig. 2 is a plot of the respective data points of the WD spectrum. It presents the two major peaks of O-species at Sn-values 40
000 respectively. However, at higher Sn-value, the Au peak became substantively significant. Notably, the cps of Au at this Sn is almost the same intensity as that of O at its lower Sn-value. The inset in Fig. 2 is a plot of the respective data points of the WD spectrum. It presents the two major peaks of O-species at Sn-values 40![[thin space (1/6-em)]](https://www.rsc.org/images/entities/char_2009.gif) 000 and 75
000 and 75![[thin space (1/6-em)]](https://www.rsc.org/images/entities/char_2009.gif) 000. This may be attributed to oxygen in both the rutile TiO2 support and the residual oxygen in the Au catalyst nanoparticles (Au2O3) respectively.
000. This may be attributed to oxygen in both the rutile TiO2 support and the residual oxygen in the Au catalyst nanoparticles (Au2O3) respectively.
The Ti, O and Au in the Au–RANR were measured against the LPET, PCO and LLIF crystal standards respectively. The peak intensity variation is comparable to the trend presented in the PXRD pattern in Fig. 1. The Au atoms have a peak intensity of 2500 cps and Ti has a high intensity of 28![[thin space (1/6-em)]](https://www.rsc.org/images/entities/char_2009.gif) 800 cps while that of O is about 5000 cps. This trend is also presented in the WDS maps of the Au–RANR catalyst nanoparticles as shown in Fig. 3. The AuNPs are observable on the EPMA with a micro-scale because the particles are supported on the RANR with a diameter range of 50 nm to 3 μm as presented in Fig. 4(b). The EPMA maps are showing the distribution of gold, titanium and oxygen in the supported catalyst. The gold map shows that there is a homogeneous spatial distribution of the nanosized Au particles across the whole wide support matrix. The density distribution shows how the AuNPs are dispersed on the TiO2 nanorods of the RANR support.
800 cps while that of O is about 5000 cps. This trend is also presented in the WDS maps of the Au–RANR catalyst nanoparticles as shown in Fig. 3. The AuNPs are observable on the EPMA with a micro-scale because the particles are supported on the RANR with a diameter range of 50 nm to 3 μm as presented in Fig. 4(b). The EPMA maps are showing the distribution of gold, titanium and oxygen in the supported catalyst. The gold map shows that there is a homogeneous spatial distribution of the nanosized Au particles across the whole wide support matrix. The density distribution shows how the AuNPs are dispersed on the TiO2 nanorods of the RANR support.
 | ||
| Fig. 3 EPMA maps of 10 wt% Au–RANR catalyst showing the elemental quantitative compositional map of (a) Au, (b) O and (c) O. | ||
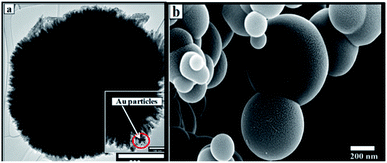 | ||
| Fig. 4 (a) TEM micrograph of the AuNPs dispersed on RANR of the 5 wt% Au–RANR supported catalyst. (b) SEM image showing a 3D structure of the RANR. | ||
The morphological structure of the RANR was observed to take a spherical structure assimilating to the dandelion-like shape as shown in both the TEM and SEM images in Fig. 4(a) and (b) respectively. Detailed analysis showed that the RANR support is spherical in structure and consisted of nanorods which were radially aligned (Fig. 4(a)). However, PXRD analyses of this RANR support had shown that they are composed of titania in the rutile phase (Fig. 1). Hence TEM (Fig. 4(a)) confirms the presence of radially aligned rutile nanorods.
Previous studies on the mechanism of RANR formation was depicted as a crystal growth process, leading to the formation of rutile nanorod-aggregated objects, driven by a low degree of supersaturation.33 J. Zhou postulated that the required low degree of supersaturation is achieved by the existence of the acid medium HCl. The Ti(IV) oxo species are generally considered to be intermediates between TiO2+ and TiO2, consisting of partly dehydrated polymeric Ti(IV) hydroxide.34 The highly acidic condition and selectively adsorption of Cl− on rutile (110) plane facilitate the anisotropic growth of rutile nanorods along [001] orientation. The nanorods aggregate into RANR microspheres to lower their total free energy. It may be concluded that the growth mechanism of the 3D RANR nanostructures is such that low concentration of TiCl4 gives rise to a small amount of Ti(OH)n 4 − n, the hydrolysate of TiCl4.35 It enhances the preferred growth of longer rodlike rutile TiO2 along the c-axis and the formation of sector-like nanostructure.36
The surfaces of these rutile nanorods were observed upon closer examination (see encircled region in the enlarged area in Fig. 4(a)) to be covered with darker coloured nanoparticles. Since PXRD, as well as WDS, had detected the presence of Au (Fig. 1 and 2), and EPMA showed that Au is homogeneously dispersed on the support (Fig. 4(a)), it was concluded that these darker coloured nanoparticles are AuNPs that were deposited around the tips of the rutile nanorods by DPU. This was consistent with studies that have been conducted in our laboratory before, where it was observed that narrow spaces between these rutile nanorods assisted controlling the sizes of the AuNPs that could be formed.32 Size distribution analyses of the rutile nanorods and the AuNPs were then conducted. The results are shown in Fig. 5(a) and (b).
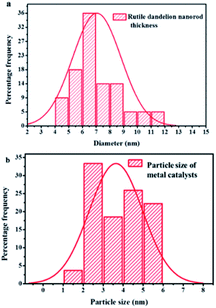 | ||
| Fig. 5 Size distribution analysis of (a) RANR nanorods diameter (b) Au catalyst nanoparticles supported on the RANRs. | ||
The narrow porosity range of the RANR also controls the size of AuNPs that can access the interstitial spaces between the RANR nanorods. This implies that large-sized Au particles are preferentially excluded from being deposition-precipitated rendering them more susceptible to further chemo-pulverization by urea. Zanella R. et al. carried out a detailed study of the mechanism of deposition–precipitation methods. A comparison was made between the colloidal method, DP NaOH and DP urea. It was determined that for the DP urea method, the mechanism of gold deposition on titania is a mechanism of typical deposition–precipitation. The pH increase was determined to trigger rapid precipitation of a gold compound, which is Au(OH)3, onto the support.35 The fast formation of this gold precipitate at pH close to 3 suggested the fact that gold is deposited on the support within the first hour of the preparation.
The deposition–precipitation mechanism first involved an initial electrostatic interaction between anionic gold species [AuCl4]− or [AuCl3(OH)]− and the positively charged TiO2 surface at acidic pH.35 This is then followed by the growth of the particles of gold precipitate on these sites, which act as precipitation nuclei. When the pH increases during the DP urea, the surface charge density of the gold precipitate particles are modified, leading to fragmentation, and then to a decrease in the gold particle size with increasing deposition time.35 The inset in Fig. 4(a) shows how the nanosized particles access the inner interstitial spaces of the RANR support material.
The combined effect of the support morphological structure and the mechanism of the DPU method afforded the rutile nanorods characterised by a thickness range of 4–12 nm to support AuNPs of the particle size range of 1–6 nm as shown in Fig. 5(a) and (b) respectively. The choice of using TiO2 rutile nanorods as a support material for AuNPs in CVD reactions was based on the known properties and characteristics of TiO2. The CVD reactions are thermal processes ranging from 100–900 °C. At this temperature range, rutile nanorods are thermally stable structurally and chemically. The rutile does not undergo further phase transitions or structural disintegration as a result of the thermal processes. Therefore, the RANR structure provides a unique topology on which metal nanoparticles are supported on the ordered RANR nanorods.
The properties and characteristics of the catalyst materials including large surface area, small Au particle size and high chemical stability at a wide temperature range, gives the catalysts good qualities and high catalytic activity and performance. It was observed that at short deposition time, the average metal particle size of the deposited Au is large, but with an increase in DPU time, the size decreases, coupled with a high metal loading.35 This explains the observed small particle size distribution of the metal catalyst with mean sizes ranging from Au: 1–6 nm across the whole percentage composition range. The small size of the metal particles observed by TEM suggests that a strong interaction occurs between RANR support and the metal catalysts precipitated during deposition.37
The observed strong interaction at the catalyst–support interface is postulated to propagate high metal catalyst dispersion around the tips of the RANR. Deposition of 10 wt% composition metal catalysts showed increased metal loadings on the RANR support material. Here it was observed that the rutile nanorods had widths that ranged between 4–12 nm and that the AuNPs ranged in size from 1–6 nm, as shown in Fig. 5(a) and (b) respectively. It was therefore concluded that the RANR structure provided a unique topology on which the AuNPs were supported. It was anticipated that increase in percentage metal loading will consequentially increase in particle size. The only observed phenomenon is the increased density in terms of particle distribution on the nanorods of the RANR.38 The lower compositions resulted in a sparsely distributed particle density. It may be concluded that at this percentage composition range, time plays a pivotal role in determining the particle size distribution as observed by a narrow particle size range.
The catalysts were used to synthesize shaped carbon nanomaterials (SCNMs) in a chemical vapour deposition (CVD) process. The Au–RANR at different percentage weight loadings catalysed the synthesis of a variety of carbon materials at different reaction conditions of temperature, time and flow rates. The catalysts at 0.5, 1, 2, 5, 8 and 10 wt% of metal compositions were compared in their catalytic performance. Fig. 6 presents CVD products formed over the 0.5–2.0 wt% Au–RANR catalysts.
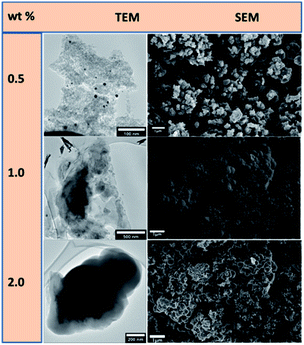 | ||
| Fig. 6 TEM and SEM comparisons of carbon nanomaterials synthesised at low compositions of 0.5, 1.0 and 2.0 wt% Au–RANR at 400 °C, 1 h, 75 mL min−1. | ||
The Au/RANR catalysts were then tested for their ability to synthesize SCNMs in the CVD process that was previously described. Here it was found that the Au/RANR catalysts, at different wt% loadings (i.e. 0.5, 1, 2, 5, 8 and 10 wt%), catalysed the synthesis of a variety of SCNMs under different reaction conditions (e.g. temperature, time and flow rate). For example, the CVD products which formed over Au/RANR catalysts (0.5–2.0 wt%) in 1 h, when the flow rate (75 mL min−1) and temperature (i.e. 400 °C) were kept constant, were observed to vary as can be seen in the TEM and SEM micrographs in Fig. 6. This is due to low Au particles distribution that the catalysts performed more like plain RANR which does not support the synthesis of SCNMs.
TEM and SEM images in Fig. 6 show that the low wt% loading catalysts catalysed the synthesis of amorphous carbon material. The Au catalyst particles do not have crystal planes on which the carbon material is sufficiently shaped into structures such as SCNMs such as the observed CNFs. However, higher wt% metal loading synthesised CNFs at a wide range of parametric conditions. Fig. 7 shows that at higher wt% Au loading, the catalysts catalyse the synthesis of CNFs under different sets of synthesis parametric conditions.
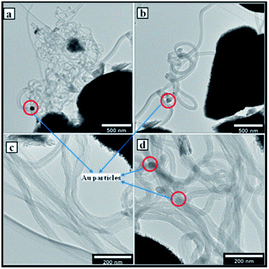
Au/RANR at higher wt% loading was observed to catalyse the synthesis of both straight and coiled or twisted CNFs (Fig. 7, 9 and 10). In our previous detailed account of the growth mechanism of CNFs synthesised over La, a similar phenomenon was observed for Au/RANR catalysts. This also implies that tip-growth occurred on RANR supported catalysts as the Au particles were dislodged from the RANR support. The CNFs were found to be characterised by different thickness and lengths attributable to the Au particle size on being dislodged from the support during CNFs growth. This phenomenon preceded temperature enhanced sintering and particles grew to larger sizes. The variations were brought about by variations in reaction parameters. wt% loading determined particle size of the Au catalyst to a large extent as it affected catalyst particles dispersion density. Increase in wt% loading from 0.5–10 wt% gave rise to increased dispersion density such that during sintering, more particles were available to form large-sized particles. It is these sintered particles that determined the internal diameters of the CNFs synthesized. The gas flow rate and period of catalyst-carbon source exposure had a direct effect on the CNFs' length and thickness (Fig. 8). However, the supported Au catalysts favoured a tip-growth mechanism of synthesis as opposed to the base-growth model. This phenomenon is exhibited by the fibres in Fig. 7 micrographs which are characterized by Au catalyst particle at the tip of each fibre.
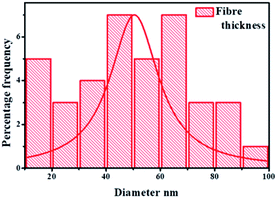
The fibres synthesized under different parametric conditions ranged from 10–100 nm in thickness with an average diameter of 50 nm (Fig. 8). The wide range of thickness distribution was due to the polydispersion of the Au nanoparticle distribution and wt% composition variation. It was determined that the tip-growth mechanism set the Au catalyst particle to serve as a seed around which the CNFs grew via a bottom-up mechanism.
Under effective reaction parametric conditions, higher percentage loading lead to higher CNFs deposition. It is apparent that at high temperatures (500–700 °C) and intermediate to high flow rates (75–100 mL min−1), long stretching, thick and more crystalline CNFs were synthesised. Percentage catalyst weight loading is comparable to the effect of concentration in the reaction system. It was observed that at low percentage loading (<5), none to very few CNFs formed for the whole range of parametric conditions. Detailed studies showed that both the diameter and the thickness distribution range increase drastically with increase in temperature.30
This is because metal catalyst particles tend to sinter or agglomerate such that they catalyse the synthesis of thicker CNFs. This is coupled by temperature enhanced decomposition of C2H2 and thus more carbon available for knitting the carbon matrix of the CNFs. Fig. 9 shows the effect of temperature variation with percentage weight composition.
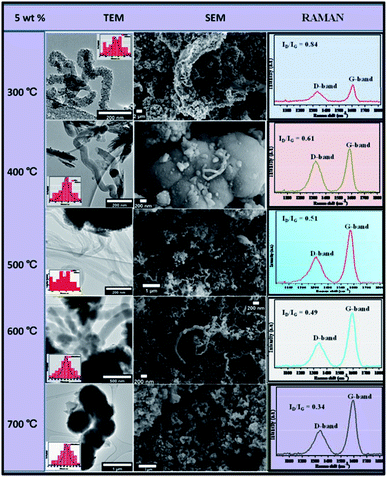 | ||
| Fig. 9 TEM and SEM comparisons of carbon nanomaterials synthesised at different temperatures over 5 wt% Au–RANR, 1 h, 100 mL min−1. | ||
At 5 wt% Au composition, it was observed that yield, crystallinity and graphicity increased with temperature. The fibres synthesised over the 5 wt% catalyst is simple straight-chain fibres also having a 10–100 nm diameter range.
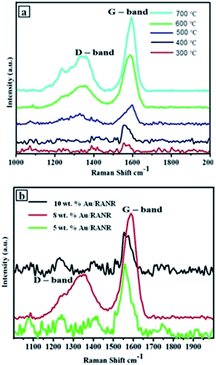
Raman spectra showed how the G-peak was becoming more intense than the D-peak with an increase in temperature. Fig. 9 showed ID/IG ratios decreasing with an increase in temperature from 0.84 at 300 °C to 0.34 at 700 °C. It may be concluded that at 5 wt%, the Au/RANR catalyst supported the growth of graphitic CNFs at high temperatures with an average diameter that also increased with temperature. This phenomenon was also observed on CNFs synthesized over 5 wt% Au/RANR at 30 min and 1 h time intervals. This implies that both wt% and temperature influenced the degree of graphicity of the CNFs synthesised in the CVD reactions. Table 1 summarises the trends of the characteristics of the CNFs synthesised over 5 wt% Au/RANR at 100 mL min−1 over a 2 h period. Increased CNFs density was observed at 8 wt% Au catalysts loading. However, at 600 °C, the CNFs produced had a perfect coiled morphology as shown in TEM and SEM images in Fig. 10. A mixture of coiled and straight CNFs was produced at 700 °C. This implies that at high temperature, there is rapid C2H2 decomposition and nucleation of carbon such that shaping of the fibres into perfect coils was interrupted. Raman analysis showed an increase in graphicity with temperature.
| T °C | 300 | 400 | 500 | 600 | 700 |
| CNFs mean dia. (nm) | 76 | 78 | 80 | 83 | 85 |
| ID/IG | 0.74 | 0.51 | 0.50 | 0.45 | 0.32 |
| TGA T °C | 380 | 350 | 420 | 580 | 580 |
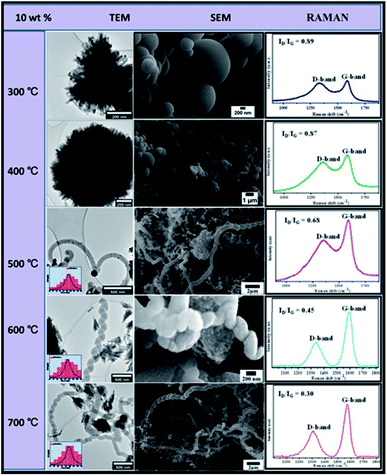 | ||
| Fig. 10 TEM and SEM comparisons of carbon nanomaterials synthesised at different temperatures over 10 wt% Au–RANR 2 h, 100 mL min−1. | ||
In Table 1, also presented, is the thermal decomposition temperatures of the CNFs synthesised under these parametric conditions. It was observed that the decomposition temperature shifted towards higher values with increase in temperature. This is attributable to increased graphicity and crystallinity of the CNFs as shown by the increase in ID/IG ratios with temperature.
Increased CNFs density was observed at 8 wt% Au/RANR. However, at 600 °C, the CNFs produced had a perfect coiled morphology as shown in TEM and SEM micrographs in Fig. 10. Detailed analyses revealed that at 8 wt%, the mean diameter (insets on TEM micrographs in Fig. 10) of CNFs synthesised across the 300 to 700 °C temperature range was higher as compared to those of CNFs synthesised over 5 wt% Au/RANR. The CNFs mean diameter increased from 76 nm at 300 °C to 85 nm at 700 °C. Similarly, LRS analysis showed an increase in graphicity with temperature.
The ID/IG ratios of CNFs synthesised over 8 wt% Au/RANR presented in Fig. 10 decreased with increase in temperature. It was also observed that these ratios are lower than those of CNFs synthesised over 5 wt% Au/RANR. ID/IG ratios of CNFs on 8 wt% Au/RANR decreased from 0.74 at 300 °C to 0.32 at 700 °C. This implied that the 8 wt% Au/RANR synthesised more crystalline and graphitic CNFs than those over 5 wt% Au/RANR. However, TGA analysis showed similar decomposition temperatures of CNFs over both 5 and 8 wt%. This may be explained in terms of the same respective temperatures over which they were synthesized. Table 2 compares trends in the characteristics of the CNFs synthesised over 8 wt% Au/RANR.
| T °C | 300 | 400 | 500 | 600 | 700 |
| CNFs mean dia. (nm) | 50 | 52 | 52 | 55 | 58 |
| ID/IG | 0.84 | 0.61 | 0.51 | 0.49 | 0.34 |
| TGA T °C | 380 | 350 | 420 | 580 | 580 |
The data presented in Table 2 showed that at 8 wt%, both CNFs mean diameter and decomposition temperature increased with an increase in temperature. This corresponded to the observed decrease in ID/IG ratios. It can be concluded that at 8 wt%, the catalyst supported the synthesis of more graphitic CNFs. The observed improved characteristics are attributable to coiling that suggests increased crystallinity in the carbon framework of the fibres.
Similar trends were observed with 10 wt% Au catalysts loading. However, at low temperatures (300–400 °C) the catalysts agglomerated and lost their catalytic properties. This may be attributed to consequential increased metal loading of 10 wt% as shown in TEM and SEM images in Fig. 10.
Low-temperature agglomeration took place as a result of high particle density distribution. Thus high-temperature syntheses of carbon materials were untenable. At 500–700 °C, CNFs of predominantly coiled or twisted morphology were synthesized and a few straight-chain CNFs were produced as shown in the TEM and TEM micrographs in Fig. 10.
Detailed analysis showed that the CNFs increased in diameter ranges with an increase in temperature. The ID/IG ratios sharply decreased at this temperature range from 0.68 to 0.30, showing that the mostly coiled CNFs were of high graphicity and crystallinity. Table 3 compares the trends in the characteristics of CNFs produced during CVD using 10 wt% Au/RANR.
| T °C | 300 | 400 | 500 | 600 | 700 |
| CNFs mean dia. (nm) | 104 | 106 | 108 | ||
| ID/IG | 0.89 | 0.87 | 0.68 | 0.45 | 0.30 |
| TGA T °C | 320 | 340 | 420 | 580 | 600 |
Compared to trends presented in Tables 1 and 2 for CNFs synthesises at 5 and 8 wt% respectively, Table 3 presented trends that are at higher ranges. The CNFs mean diameter at 0–108 nm, ID/IG ratio at 0.89–0.30, and a decomposition temperature range of 320–600 °C. This implied that the high wt% gave rise to Au particles of the highest particle sizes that catalysed the synthesis of CNFs with the highest diameters, with the highest degree of crystallinity and graphicity. However, CNFs density around was lower mainly because sintering could have taken place to a large extent that most Au particles lost their catalytic activity. The effect of flow rate and time variation was studied in details in the following section.
Gas flow rates and time variation
In this work, the gas flow rate was varied from 50–100 mL min−1 while all other parameters were held constant. The flow rate of the gas mixture determines the overall vapour pressure in the reaction region of the CVD setup. The influx of C2H2/H2 to the catalysts bed in the quartz boat and its catalytic decomposition is a function of the flow rate and time of exposure of the catalyst to the carbon source. Detailed analysis shows that low flow rates at short periods yield none to very little CNFs (Fig. 10). Whereas intermediate flow rates favour more crystalline, more graphitized and densely covering CNFs (Fig. 11). High flow rates are at times characterised by highly disordered CNFs and amorphous carbon materials. This is because, at low flow rates (<50 mL min−1), and short time (30 min), the catalysts receive too little carbon that could be fabricated into CNFs (Fig. 11(c)).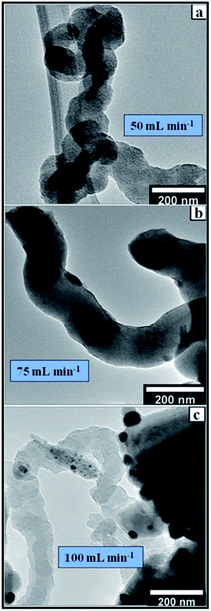 | ||
| Fig. 11 TEM micrographs of CNFs synthesized at different flow rates at (a) 50 mL min−1, (b) 75 mL min−1 and (c) 100 mL min−1 over 8 wt% Au/RANR 2 h, at 500 °C. | ||
At longer periods (1–2 h), the little carbon received is used to make short but highly graphitized CNFs. The intermediate flow rate (75 mL min−1), allows sufficient interaction of the carbon and the catalyst such that proper knitting of the CNFs matrix takes place consistently (Fig. 11). However, a combination of high flow rate and high temperature only supports the synthesis of pyrolysis products with a few CNFs. The lack of more ordered well-knit carbon materials is because of the high flow rates that result in rapid accumulation of carbon and clogging the catalysts such that less crystallisation takes place as shown in Fig. 8–10. At high temperatures, the rapidly accumulating carbon is converted to pyrolytic products such as glassy carbon and carbon nanospheres.
Laser Raman spectroscopy
Laser Raman spectroscopic measurements performed on the CNFs synthesised over the supported Au–RANR catalysts shows D and G-band peaks of selected CVD products. In Fig. 12(a), the G-band is shifting more towards 1600 cm−1 with an increase in temperature. This is due to tangential modes corresponding to vibrations of the C–C bonds in the plane of graphene matrix of the CNFs which are becoming stronger with an increase in temperature.31 This implies that high temperatures (500–700 °C) propagate temperature-enhanced decomposition of the C2H2 making carbon sufficiently available for the knitting of the more ordered form of the CNFs (Fig. 9 and 10). It was observed that the higher the reaction temperature, the more intense the G–band peak. This is because crystallinity of the CNFs increases with an increase in temperature as the orderliness result in more sp3 hybrid bonding in the carbon and hence more graphitisation. The Raman spectra in Fig. 12(a) show that the G–band occurring around 1590 cm−1 is more intense than the D-band occurring around 1350 cm−1. Their intensities generally increased with temperature.32It was expected that graphitization will increase with the percentage of weight loading. Fig. 12(b) shows that the trend is not as expected. This is because at lower percentage weight loading, the density of catalyst coverage is very low and thus there is the little or less catalytic conversion of carbon to the fibrous carbon material. However, there is significant graphitisation from a combination of other reaction parameters such as time and temperature as shown by the Raman spectrum for CNFs@5 wt% Au–RANR in Fig. 12(b). 8 wt% loading, there is sufficient catalyst on the reaction interface such that efficient conversion takes place and CNFs that are more graphitic are produced. At 10 wt% loading the G-band peak seems to be lower. This coupled with other reaction parameters suggest that a lot of carbon is dissolved into the catalyst and atomised (Fig. 11). However, the high influx of carbon favours the accumulation of amorphous carbon while little carbon is sufficiently crystallised into a more graphitised form in the CNFs formed. It can be inferred that percentage weight catalyst loading cannot be distinctively used to account for the Raman performance of the carbon nanomaterials synthesised over catalysts of different loadings.
Thermogravimetric analysis (TGA)
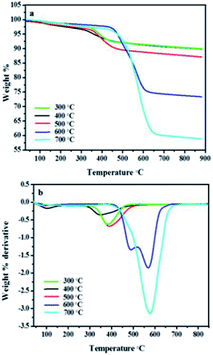
The temperature has exhibited great influence on the nature of the CNFs synthesised under different conditions. Thermogravimetric analysis of CNFs synthesised over 5 wt% Au–RANR confirmed a trend presented in Raman analysis.Fig. 13(a) is a TGA profile of CNFs synthesised over a period of 2 h and gas flow rate of 100 mL min−1. The temperature variation presented in Fig. 13 suggests that the CNFs became more thermally stable with an increase in temperature. At low temperatures very little CNFs formed and were mostly amorphous and where graphitisation occurred, the yield was very little. Hence less than 10% of material decomposed at a temperature range 300–500 °C and the 90% residual weight comprises mainly the catalyst material which is thermally stable.
Fig. 13(b) shows that for CNFs synthesised at 600 °C there are two thermal peaks such that a decomposition temperature of 500 °C may be attributed to amorphous and the less crystalline carbon in the CNFs while that at 600 °C is due to the more crystalline graphitized carbon form of the CNFs. The more ordered the carbon network in the CNF matrix, the more thermally stable the carbon material as a result of strong bonding in the sp3 hybrid bonding in the carbon framework of the CNFs. Fig. 13(a) and (b) shows that the crystallinity of the as-synthesised CNFs produced at 700 °C is high. The weight loss at this temperature is also increased (60%) indicating high purity and more graphitised CNFs. This indicates that high temperatures result in the Au–RANR possessing the highest selectivity towards the growth of more crystalline and highly graphitised CNFs.
Conclusions
The RANR morphology provided a unique topology on which AuNPs were deposited with homogeneous dispersion. The ability of DPU method to afford mono dispersion of the AuNPs along the radial length of the nanorods of the RANR enabled Au to be deposited in very small particle size range with average diameters of around 4 nm. EPMA elemental analysis confirmed the spatial distribution of the AuNPs in the Au–RANR catalysts matrix. Depositions ranging from 0.5–10 wt% were achieved. It can be concluded that the percentage weight composition can be used to control the particle size distribution of the AuNPs, while the particle size determines the thickness of the CNFs synthesised. It was also observed that the mechanism of CNFs growth may be described as the tip-growth method as the CNFs are characterised by an Au – seed at the tips of the fibres. The RANR morphology as presented on TEM micrographs held the AuNPs in fixed positions preventing sintering and agglomeration of AuNPs. This provides further control of the CNFs thickness. The parametric reaction conditions have a synergic effect on the overall characteristics of the CNFs synthesised. Thus temperatures significantly contribute towards the formation of ordered forms of CNFs hence their degree of graphicity.Conflicts of interest
This work is an extract from my PhD presented in my thesis examined for the purpose of awarding my degree in Doctor of Chemistry at The University of Witwatersrand, Johannesburg, South Africa.Acknowledgements
The authors would like to thank Dr Z. Tetana for her assistance with the editing of this paper. This work is based on the research supported in part by the National Research Foundation of South Africa (Grant Number 88076) and the DST-NRF Centre of Excellence in Strong Materials at the University of the Witwatersrand. We are thankful to the Microscopy and Microanalysis Unit (MMU) at the University of the Witwatersrand for TEM and SEM analysis and Prof. D. G. Billing for providing facilities for PXRD measurements.Notes and references
- C. Candeias, E. F. da Silva, P. F. Ávila and J. P. Teixeira, Geosci., 2014, 4, 240–268 CrossRef.
- E. C. Dreaden, A. M. Alkilany, X. Huang, C. J. Murphy and M. A. El-Sayed, Chem. Soc. Rev., 2012, 41, 2740–2779 RSC.
- R. A. Sperling, P. Rivera Gil, F. Zhang, M. Zanella and W. J. Parak, Chem. Soc. Rev., 2008, 37, 1896–1908 RSC.
- D. Astruc, F. Lu and J. R. Aranzaes, Angew. Chem., Int. Ed., 2005, 44, 7852–7872 CrossRef CAS.
- M. Haruta, Catal. Surv. Jpn., 1997, 1, 61–73 CrossRef CAS.
- F. Dziike, P. J. Franklyn, S. H. Durbach, M. Maubane and L. Hlekelele, Mater. Res. Bull., 2018, 104, 220–226 CrossRef CAS.
- X. Zhou, G. Liu, J. Yu and W. Fan, J. Mater. Chem., 2012, 22, 21337–21354 RSC.
- W. Chansuvarn, T. Tuntulani and A. Imyim, TrAC, Trends Anal. Chem., 2015, 46(1), 1–10 Search PubMed.
- G. Sener, L. Uzun and A. Denizli, Anal. Chem., 2014, 86(1), 514–520 CrossRef CAS.
- S. J. Mpofu, O. A. Arotiba, L. Hlekelele, D. T. Ndinteh and R. W. M. Krause, Nat. Prod. Commun., 2014, 9(1), 41–43 CrossRef CAS.
- T. Ogawa, K. Kobayashi, G. Masuda, T. Takase and S. Maeda, Thin Solid Films, 2001, 393(1–2), 374–378 CrossRef CAS.
- C. O. Baker, B. Shedd, R. J. Tseng, A. A. Martinez-Morales, C. S. Ozkan, M. Ozkan, Y. Yang and R. B. Kaner, ACS Nano, 2011, 5(5), 3469–3474 CrossRef CAS.
- V. Idakiev, T. Tabakova, K. Tenchev, Z. Yuan, T. Ren and B. Su, Catal. Today, 2007, 128, 223–229 CrossRef CAS.
- S. Lee, M. Yamada and M. Miyake, Sci. Technol. Adv. Mater., 2005, 6, 420–426 CrossRef CAS.
- L. Hlekelele, P. J. Franklyn, F. Dziike and S. H. Durbach, New J. Chem., 2018, 42, 1902–1912 RSC.
- D. O. Kumi, T. N. Phaahlamohlaka, M. W. Dlamini, I. T. Mangezvo, S. D. Mhlanga, M. S. Scurrell and N. J. Coville, Appl. Catal., B, 2018, 232(1), 492–500 CrossRef CAS.
- F. Dziike, P. J. Franklyn, L. Hlekelele and S. H. Durbach, Diamond Relat. Mater., 2019, 99, 107519 CrossRef CAS.
- W. Yan, B. Chen, S. M. Mahurin, V. Schwartz, D. R. Mullins, A. R. Lupini, S. J. Pennycook, S. Dai and S. H. Overbury, J. Phys. Chem. B, 2005, 109(21), 10676–10685 CrossRef CAS PubMed.
- D. H. Barrett, M. S. Scurrell, C. B. Rodella, B. Diaz, D. G. Billing and P. J. Franklyn, Chem. Sci., 2016, 7, 6815–6823 RSC.
- M. Haruta and M. Daté, Appl. Catal., A, 2001, 222(1–2), 427–437 CrossRef CAS.
- M. Haruta, Catal. Today, 1997, 36, 153–166 CrossRef CAS.
- S. H. Overbury, V. Schwartz, D. R. Mullins, W. Yan and S. Dai, J. Catal., 2006, 241(1), 56–65 CrossRef CAS.
- Z. Ma, S. H. Overbury and S. Dai, J. Mol. Catal. A: Chem., 2007, 273(1–2), 186–197 CrossRef CAS.
- C. G. Silva, R. Juárez, T. Marino, R. Molinari and H. García, J. Am. Chem. Soc., 2011, 133, 595–602 CrossRef PubMed.
- S. Horikoshi, A. Tokunaga, H. Hidaka and N. Serpone, J. Photochem. Photobiol., A, 2004, 162, 33–40 CrossRef CAS.
- L. Hlekelele, P. J. Franklyn, F. Dziike and S. H. Durbach, New J. Chem., 2018, 42, 4531–4542 RSC.
- E. N. Nxumalo and N. J. Coville, Materials, 2010, 3, 2141–2171 CrossRef CAS.
- D. Jariwala, K. Chandra, A. Cao, S. Talapatra and M. Shima, Dig. J. Nanomater. Bios., 2012, 17, 1279–1288 Search PubMed.
- N. Hintsho, A. Shaikjee, H. Masenda, D. Naidoo, D. Billing, P. Franklyn and S. Durbach, Nanoscale Res. Lett., 2014, 9, 1–11 CrossRef CAS PubMed.
- N. Hintsho, A. Shaikjee, P. Franklyn and S. Durbach, RSC Adv., 2015, 5, 53776–53781 RSC.
- L. Hlekelele, P. Tripathi, P. J. Franklyn and S. H. Durbach, RSC Adv., 2016, 6, 76773–76779 RSC.
- V. Jovic, W. T. Chen, D. Sun-Waterhouse, M. G. Blackford, H. Idriss and G. I. N. Waterhouse, J. Catal., 2013, 305, 307–317 CrossRef CAS.
- L. Liu, Y. Zhao, H. Liu, H. Z. Kou and Y. Wang, Nanotechnology, 2006, 17, 5046–5050 CrossRef CAS.
- J. Zhou, G. Zhao, G. Han and B. Song, Ceram. Int., 2013, 39, 8347–8354 CrossRef CAS.
- R. Zanella, L. Delannoy and C. Louis, Appl. Catal., A, 2005, 291, 62–72 CrossRef CAS.
- L. Ren, X. Huang, F. Sun and X. He, Mater. Lett., 2007, 61, 427–431 CrossRef CAS.
- Z. Cai, J. Li, K. Liew and J. Hu, J. Mol. Catal. A: Chem., 2010, 330, 10–17 CrossRef CAS.
- F. Dziike, P. J. Franklyn, S. H. Durbach and M. Maubane, Mater. Res. Bull., 2018, 104, 220–226 CrossRef CAS.
| This journal is © The Royal Society of Chemistry 2020 |

