 Open Access Article
Retracted Article: Nanocurcumin: preparation, characterization and cytotoxic effects towards human laryngeal cancer cells
Demiana H. Hanna * and
Gamal R. Saad
Department of Chemistry, Faculty of Science, Cairo University, Giza 12613, Egypt. E-mail: dr_demiana@yahoo.com
First published on 1st June 2020
Abstract
The aim of the present study was to prepare curcumin nanoparticles (nanocurcumin) by a sol-oil method to improve curcumin absorption and bioavailability, and to investigate the therapeutic effects of the prepared nanoparticles on the inhibition mechanisms towards human Hep-2 cancer cells. The nanoparticles were characterized by Fourier transform infrared spectroscopy, transmission electron microscopy, X-ray diffraction, and zeta potential analysis. The prepared curcumin nanoparticles possessed a narrow particle size distribution with an average diameter of 28 nm. The inhibition effects on the growth of human Hep-2 cells were investigated using neutral red uptake and lactate dehydrogenase assays. The results indicated that the nanocurcumin has a selective effect in inhibiting Hep-2 cell growth in a dose- and time-dependent mode with the most effective IC50 value (17 ± 0.31 μg ml−1) obtained after 48 h of incubation without any cytotoxic effects on normal cells. This IC50 value of nanocurcumin revealed a significant increase of early and late apoptotic cells with an intense comet nucleus of Hep-2 cells as a marker of DNA damage. Flow cytometry analysis of the progression of apoptosis in nanocurcumin Hep-2 treated cells showed that arresting in the cell cycle in the G2/M phase with increasing apoptotic cells in the sub-G1 phase. At the same time, real-time PCR analysis indicated that the treatment of Hep-2 cells with nanocurcumin resulted in upregulation of P53, Bax, and Caspase-3, whereas there was downregulation of Bcl-XL. These findings gave insights into understanding that the inhibition mechanisms of nanocurcumin on the proliferation of Hep-2 cancer cells was through the G2/M cell cycle arrest and the induction of apoptosis was dependent on Caspase-3 and p53 activation. However, in vivo studies with an animal model are essential to validate these results.
1. Introduction
New studies to discover new drugs aim to find ones that have anti-proliferative effects on cancer cells with fewer side effects on the immune system.1 There has been a great amount of attention given to the use of natural phytochemicals as anti-cancer agents because they have little toxicity on normal cells and fewer side effects as compared to chemical drugs.2 Many plant-based anticancer drugs have been given approval from the Food and Drug Administration (FDA) for commercial output.3 Curcumin (diferuloylmethane) is a natural hydrophobic polyphenol derived from Curcuma longa which is considered to be one of the promising chemo-preventive agents which have anticarcinogenic and antioxidant properties. The diverse chemo-preventive effects of curcumin display several mechanisms of action, which are significant in its therapeutic effect against cancer.4 Previous studies have shown that curcumin can inhibit the growth of a variety of tumor cells,5 induce cell differentiation,6 and apoptosis in some tumors.7The cytotoxicity efficacy of curcumin depends mostly on suppression of numerous pathways of cellular signal transduction, which have an important role in growing, differentiation, and malignant transformation,8 or activation of some of apoptotic-related enzymes such as P53 and Caspase-8, which induce cleavage of BID, leading to upregulation of Bax which resulted in the release of cytochrome C and induced activation of Caspase-3 with inhibition of the expression of the BCL-2 gene.9 Also, deregulation of the cell cycle is a characteristic mark of cancer cells, so targeting the proteins which mediate critical processes through the cell cycle is considered to be an approach worth developing for cancer treatment, where during the normal phases of the cell cycle, cells have checkpoints as control mechanisms to confirm the correct performance of cell cycle events.10 Several studies have mentioned that curcumin induces apoptosis through cell cycle arrest and Caspase-3 pathway activation in different human cancer cells.11–13
Unfortunately, all the useful chemoprotective effects of curcumin, suffer from limiting effects in patients, due to some major problems such as poor bioavailability because of its poor solubility in water, a higher rate of metabolic activity and rapid excretion from the body.14,15 Thus, these limitations of native curcumin stimulated some investigators to use curcumin as nanoparticles using different methods for decreasing its particle size to nanoscale,16 for improvement in curcumin bioavailability and therapeutic efficacy against chronic diseases.
Nanotechnology is a science relating to the synthesis of nanoscale sized particles within a range of 1–100 nm, which results in a large increase in surface (area and atoms), and physical and chemical characteristics of nanoparticles (bioavailability and stability) from native molecules.17 So, nanotechnology can be applied in different fields such as biomedical and pharmaceutical science. Among the different nanosized systems, the sol-oil technique for preparing curcumin nanoparticles has been given significant attention because the simplicity of the preparation steps diminish the existence of toxic reagents that may be loaded into nanoparticle formulations for future in vivo studies.18 Nanocurcumin is the nanoparticle form of native curcumin which has higher solubility, enhanced absorbed, higher cellular uptake efficiency, requires low dosages, and better targeting of the affected tissue to efficiently display its therapeutic effects, than native curcumin.14,19 Nanocurcumin was found to be more effective at low concentrations against different types of human cancer cell lines such as lung (A549), liver (HepG2), and skin (A431), when compared to the effects of normal curcumin using different in vitro cytotoxic techniques.20
One of the most common cancers of the respiratory tract is laryngeal cancer, which is a significant source of morbidity and mortality.21 Human epithelial type 2 (Hep-2) cells are generally recognized as a human laryngeal cancer cell line that originate from a human laryngeal carcinoma reflecting its origin from the squamous cells which form the majority of the laryngeal epithelium.22 However, earlier studies showed that curcumin has less efficacy for inhibition of the viability of Hep-2 cancer cells,23,24 but the efficiency of the nanocurcumin drug against the human Hep-2 cancer cell line has not yet been studied.
Based on the previous considerations, the target of the current study was to prepare nanocurcumin with a view to improving its absorption, bioavailability and to examine its therapeutic effects against the human Hep-2 cancer cell line by elucidating the mechanisms of the cytotoxic action.
2. Materials and methods
2.1. Chemicals and reagents
Curcumin, olive oil, and all the other chemical reagents used were purchased from Sigma-Aldrich, Germany, and used as received.2.2. Preparation of curcumin nanoparticles (nanocurcumin)
Nanocurcumin was prepared by a sol-oil technique described before,18,25 with some slight modification. Briefly, 10.0 mg (2.7 mmol) was dissolved in 0.1 ml of DMSO and then added to 10.0 ml of olive oil under stirring at 600 rpm for 1 h. Next, the solution was sonicated for 2 h at 80 °C under ultrasonic conditions, where the sonication amplitude was 5 mm and the pulses were 4 s long with an interval of 1 min between successive pulses. The resulting mixture was directly frozen in liquid nitrogen for 10 min and was then incubated at room temperature for 4 h. The particles formed were obtained by centrifugation at 6000 rpm for 10 min at 4 °C, followed by washing with diethyl ether and then dissolved in distilled water and finally freeze-dried to obtain nanocurcumin powder.2.3. Characterization of the prepared nanocurcumin
The ultraviolet-visible (UV-vis) spectroscopy (Shimadzu, UV-3101PC UV-vis-NIR spectrophotometer) was used to characterize the nanocurcumin by measuring the absorption ranges from 200–700 nm.The Fourier transform infrared (FT-IR) spectra of curcumin and nanocurcumin were recorded on a FT-IR spectrophotometer (Varian, 640-IR, USA). The spectra were measured in the wavenumber region of 4000–500 cm−1 at a resolution of 4 cm−1 with a KBr pellet.
The crystalline structure of the dried nanocurcumin powder was recorded by an X-ray diffraction method using two instruments (PANalytical, X'Pert Pro, and Bruker, D-8 Advance).
The mean particle diameter and zeta potential measurements were performed using a particle size molecular size measurement instrument (Malvern Instruments Ltd., NanoSight NS500, Malvern, UK). The sample was prepared by taking 1 mg of the lyophilized nanocurcumin powder in 10 ml of distilled water.
The morphology and particle size of nanocurcumin were observed using transmission electron microscopy (TEM, Jeol JEM-1400, Japan). The images were visualized at 120 kV at 40![[thin space (1/6-em)]](https://www.rsc.org/images/entities/char_2009.gif) 000 magnifications.
000 magnifications.
The nuclear morphology of cells was examined using fluorescence microscopy (Carl Zeiss, Axiostar Plus 1169–149, Germany).
2.4. Preparation of cell lines
The human laryngeal cancer cell line (Hep-2) and baby hamster kidney normal cell line (BHK) were purchased from the American Type Culture Collection (ATCC). The cells were developed in Dulbecco's Modified Eagle's Medium (DMEM), supplemented with fetal bovine serum (10%), penicillin (100 U ml−1) and 1% of streptomycin (100 mg ml−1) at 37 °C in a humidified incubator with a 5% CO2 atmosphere. Cells were trypsinized using trypsin–EDTA and sub-cultured in tissue culture flasks for routine preservation and as required in the experiments.2.5. Neutral red uptake assay
The neutral red uptake (NRU) assay is an in vitro viability test which is dependent on the ability of living cells for incorporation and binding with neutral red (NR), which is a neutral cationic dye with the ability for penetration into the cells through non-ionic diffusion at physiological pH. Thus, this assay gave a sensitive, comprehensive indication of cell integrity and cell growth inhibition.26 The anti-proliferative effect of the prepared curcumin nanoparticles against different cell lines (human Hep-2 cells at concentrations of 5–75 μg ml−1 and normal cell lines BHK normal cell lines at concentrations of 75–300 μg ml−1) for incubation times of 24 h and 48 h, were tested using the NRU assay as described previously.27 Briefly, developing cells were collected using trypsin–EDTA (0.25%), then the hemocytometer was used for counting the cells in the cell suspension, and furthermore, the viability of these tested cells (Hep-2 and BHK) was checked using trypan blue (100% viability). After that, the cell suspension was diluted with the medium until there were approximately 1.0 × 10⁵ cells per ml, and using a multichannel pipette, 200 μl of cell suspension (containing ≈20![[thin space (1/6-em)]](https://www.rsc.org/images/entities/char_2009.gif) 000 cells per well) was added into 60 wells of the 96 well plates but the peripheral wells of the plates were filled with PBS, and then the plates were incubated for 24 h before treatment with the nanocurcumin particles to allow the cells to attach to the walls of the plates. After preparation different concentrations of curcumin nanoparticles, were dispensed (200 μl of each concentration) into four replicates of the plate wells, other wells were used as a negative control which were filled with cells only without any treatment and other wells were used as a positive control which were filled with doxorubicin HCL (6 μg ml−1). Then, the plates were incubated at 37 °C for 24 h and 48 h. After each incubation time, the medium and extracts were removed and 100 μl of NR solution (50 mg ml−1) was added, and the centrifuged at 1800 rpm for 10 min to eliminate any precipitated dye crystals. After incubation for 3 h at 37 °C, the dye media were removed and the microplates were washed twice times with 150 μl of PBS to eliminate any unabsorbed dye that was contained in the wells of the test plates. Finally, the cellular morphology of the cells (Hep-2 and BHK) treated with nanocurcumin was examined using inverted microscopy (Leica, DMI3000B). Furthermore, the absorbance of acidified ethanol solutions which had been extracted with NR dye was measured with a microplate reader (BioTek, ELx808) at 540 nm for the determination of the optical density (OD) and the percentage of cell viability and cell cytotoxicity were calculated using eqn (1) and (2), respectively.
000 cells per well) was added into 60 wells of the 96 well plates but the peripheral wells of the plates were filled with PBS, and then the plates were incubated for 24 h before treatment with the nanocurcumin particles to allow the cells to attach to the walls of the plates. After preparation different concentrations of curcumin nanoparticles, were dispensed (200 μl of each concentration) into four replicates of the plate wells, other wells were used as a negative control which were filled with cells only without any treatment and other wells were used as a positive control which were filled with doxorubicin HCL (6 μg ml−1). Then, the plates were incubated at 37 °C for 24 h and 48 h. After each incubation time, the medium and extracts were removed and 100 μl of NR solution (50 mg ml−1) was added, and the centrifuged at 1800 rpm for 10 min to eliminate any precipitated dye crystals. After incubation for 3 h at 37 °C, the dye media were removed and the microplates were washed twice times with 150 μl of PBS to eliminate any unabsorbed dye that was contained in the wells of the test plates. Finally, the cellular morphology of the cells (Hep-2 and BHK) treated with nanocurcumin was examined using inverted microscopy (Leica, DMI3000B). Furthermore, the absorbance of acidified ethanol solutions which had been extracted with NR dye was measured with a microplate reader (BioTek, ELx808) at 540 nm for the determination of the optical density (OD) and the percentage of cell viability and cell cytotoxicity were calculated using eqn (1) and (2), respectively.| Cell viability (%) = (OD of tested compound/OD of control) × 100 | (1) |
| Cell cytotoxicity (%) = 100 − cell survival (%) | (2) |
The used concentration of nanocurcumin that was needed to inhibit cell growth by 50% (IC50) was generated from the dose–response curve for Hep-2 cells for 24 h and 48 h. It was expressed as the half-maximal inhibitory concentration (IC50) value. The IC50 values were calculated from a calibration curve obtained by linear regression using Microsoft Excel.
2.6. Lactate dehydrogenase (LDH) release assay
The cytotoxic effect of nanocurcumin against Hep-2 cells was further examined by evaluating LDH leakage into the culture medium of the tested cell lines, because after cell death, LDH enzyme will leak into the culture medium. The LDH activity in the treated Hep-2 cells that were previously incubated with an IC50 value of nanocurcumin for 48 h (determined from the NRU assay) and untreated control cells was determined spectrophotometrically by measuring the decrease in absorbance at 340 nm in the cellular lysates and in the culture medium, as previously described.28 Briefly, Hep-2 cancer cells were harvested and placed in a 96-well plate at a density of 2 × 10⁴ cells per well and incubated for 18 h before treatment with nanocurcumin. After treatment with nanocurcumin, 40 μl of the supernatant was removed and placed in a fresh well in a 96-well plate for the estimation of the amount of LDH released. The original plate was refilled with 40 μl of Triton X-100 for estimation of the total LDH concentration. Then 100 μl of pyruvic acid was added into each well of the plate that containing the supernatant only. Subsequently, 100 μl of reduced β-NADH in potassium phosphate buffer (pH 7.5) was dispensed into the plate wells. The kinetic change, which depended on the loss of NADH to NAD+ as pyruvate was changed into lactate, was detected by a decrease in absorbance at 340 nm using an ELISA microplate reader (Bio-Rad, Model 550). This method was repeated with 40 μl of the total cell lysate from the original plate containing cells for the estimation of the total LDH concentration. The percentage of LDH leakage into the culture medium was calculated by the following equation:| LDH activity (%) = activity of the supernatant/total activity × 100 | (3) |
2.7. Annexin V/PI staining assay
Flow cytometry is considered to be a reliable technique for the detection of cell apoptosis, where Annexin V-fluorescein isothiocyanate (FITC) specifically binds to the phosphatidyl serine (PS) that translocates to the outer cell membrane after early apoptosis. To confirm the death of the treated cells induced by nanocurcumin undergoes apoptosis or necrosis, quantitative estimation of the percentage of apoptosis/necrosis in untreated control cells and the treated Hep-2 cells that were previously incubated with an IC50 value of nanocurcumin for 48 h, was determined using an Annexin V-FITC detection kit I (BD Biosciences) as previously reported.29,30 Briefly, cells were harvested and placed in a 6-well culture plate so that each well contained 1 × 10⁶ cells per well then incubated overnight to allow the cell adhesion to take place. Next the cells were treated with nanocurcumin for 48 h. Subsequently, the treated cells and untreated control cells were trypsinized, centrifuged and finally washed twice with cold PBS. After washing, the cells were suspended in Annexin V Binding Buffer (1×), and then 100 μl of this cell solution was transferred to a 5 ml culture tube for incubation with 5 μl Annexin V-FITC and 5 μl of propidium iodide (PI) for 15 min at room temperature in the dark. Next, these stained cells were diluted with 400 μl of the binding buffer (1×) and were examined for the presence of both apoptotic cells (early and late) and necrotic cells populations using a flow cytometer (BD Biosciences, BD FACSCalibur™).2.8. AO/EB staining assay
Apoptosis induction of Hep-2 cells by nanocurcumin was investigated using an acridine orange/ethidium bromide (AO/EB) stain assay. The AO/EB stain is a viability stain that identifies the percentages of apoptotic cells. After the penetration of AO into intact membranes of normal and early apoptotic cells, it binds with their DNA and gives green fluorescence, whereas the EB can only penetrate damaged membranes of late apoptotic and dead cells and gives an orange-red fluorescence after binding with their concentrated DNA fragments or apoptotic bodies.31 So, the morphological alterations of untreated control cells and treated Hep-2 cell lines that were previously incubated with an IC50 value of nanocurcumin for 48 h were investigated using this assay.32 Briefly, Hep-2 cells were grown in 6-well tissue culture plates in 2 ml of growth medium and after incubation overnight, supernatants from the plates were replaced with fresh growth medium containing the treated cells with nanocurcumin. Subsequently, the cells were incubated for 24 h, then washed with PBS and fixed in paraformaldehyde (4%) for 20 min and then washed twice with PBS. Finally, the cells were stained with 1 ml of AO/EB mixed (1![[thin space (1/6-em)]](https://www.rsc.org/images/entities/char_2009.gif) :
:![[thin space (1/6-em)]](https://www.rsc.org/images/entities/char_2009.gif) 1 ratio in PBS) dual stain. After 2 min of incubation, the stained cells were washed with PBS and the nuclear morphology of control and nanocurcumin treated cells were examined using fluorescence microscopy (Carl Zeiss, Axiostar Plus, Germany) with three independent cell counts and the percentages of apoptosis were estimated.
1 ratio in PBS) dual stain. After 2 min of incubation, the stained cells were washed with PBS and the nuclear morphology of control and nanocurcumin treated cells were examined using fluorescence microscopy (Carl Zeiss, Axiostar Plus, Germany) with three independent cell counts and the percentages of apoptosis were estimated.
2.9. DNA fragmentation (comet assay)
The single-cell gel electrophoresis assay or comet assay is a common method for the DNA damage measurement in individual cells. Under the effect of an electrophoretic field, the damaged cellular DNA (containing strand breaks and fragments) was detached from intact DNA, giving a comet tail shape under the fluorescence microscope. This technique was described previously,33 and was used as follows: briefly, frosted slides were covered with low melting point agarose (100 μl) which was prepared in PBS (Ca- and Mg-free) at 37 °C, and then this agarose was solidified under a coverslip on ice. Subsequently, the nanocurcumin treated Hep-2 cells were centrifuged at 2000 rpm for 5 min, then re-suspended in ice-cold PBS (Ca- and Mg-free). After that 10 μl of the prepared cell suspension was mixed with 100 μl of low melting point agarose, and quickly placed on a slide that was primarily covered with normal melting point agarose (1%) until it solidified on ice. These agarose slides which were fixed with nanocurcumin treated cells and untreated control cells were incubated in cold lysis buffer at 4 °C for 2 h to solubilize their cellular proteins. After that, DNA unwinding was carried out by placing the slides into a horizontal gel electrophoresis chamber filled with electrophoresis buffer (pH 13.0) at 25 V and 300 mA for 20 min in cold conditions. Next, the slides were dipped slightly (three times) in neutralization buffer (pH 7.5) to eliminate the extra detergents and alkali. Finally, the slides were stained with ethidium bromide, EB, (20 μg ml−1) and then examined with a fluorescence microscope (Zeiss), where 100 images of random comets per slide were captured. A computerized image analysis system analyzed the captured images and determined the comet parameters using TriTek Comet Score™ software (TriTek Corp., Sumerduck, VA, USA). The two most common parameters that were used for analyzing the results were ‘tail moment’ and ‘tail DNA’ (%). The tail moment came to be known as the Olive tail moment (OTM).34 This parameter is considered to be the best parameter that reflects DNA damage considering both the migration of the genetic material as well as the relative amount of DNA in the tail,35 which was calculated using the following equation:| OTM = tail moment × tail DNA/100 | (4) |
2.10. Gene expression analysis using real-time PCR (RT-PCR)
To determine the mRNA expression levels of the target apoptosis-related genes, the total cellular RNA was isolated from untreated control cells and the treated Hep-2 cells that had previously been incubated with an IC50 value of nanocurcumin for 48 h using a Gene JET RNA Purification Kit (ThermoFisher Scientific, catalog #K0731) and the manufacturer's recommended instructions. Using a spectrophotometer (ThermoFisher Scientific, NanoDrop 2000C), the purity of the extracted RNA was assessed by determining the A260/A280 ratio. Then, cDNA was generated from the extracted RNA samples using a RevertAid First Strand cDNA Synthesis Kit (ThermoFisher Scientific, Catalog #K1621) according to the standard protocol of the supplier. Real-time PCR amplification was performed using a Maxima SYBR Green/ROX qPCR Master Mix (2X) kit (ThermoFisher Scientific, Catalog #K0221). Thermal cycling was performed on the a RT-PCR System (Applied Biosystems, StepOnePlus™) to determine the expression levels of some apoptosis related genes (B-cell lymphoma-extra-large (Bcl-XL), Bcl-2 associated X protein (Bax), P53 (Tumor protein) and Caspase-3). Relative quantification of these apoptosis related genes was calculated using a comparative threshold cycle method (Ct). The value of the expression levels of each target gene was quantified by the formula of 2−ΔCt.36 All the tested samples were run in duplicates. The sequences of the specific primers (Invitrogen) for the target genes, are listed in Table 1. All the target genes were normalized to the housekeeping gene, β-actin (endogenous control) and compared to untreated samples.| Gene | Sequence of forward (F) and reverse (R) primers |
|---|---|
| β-Actin (F) | 5′-AGTTGCGTTACACCCTTTCTTC-3′ |
| β-Actin (R) | 5′-TCACCTTCACCGTTCCAGTTT-3′ |
| Bax (F) | 5′-AGGATGCGTCCACCAAGAAG-3′ |
| Bax (R) | 5′-TGTCCAGCCCATGATGGTTC-3′ |
| Bcl-XL (F) | 5′-AAAAGATCTTCCGGGGGCTG-3′ |
| Bcl-XL (R) | 5′-CCCGGTTGCTCTGAGACATT-3′ |
| P53 (F) | 5′-CCCCTCCTGGCCCCTGTCATCTTC-3′ |
| P53 (R) | 5′-GCAGCGCCTCACAACCTCCGTCAT-3′ |
| Caspase-3 (F) | 5′-TTC ATTATT CAG GCC TGC CGA GG-3′ |
| Caspase-3 (R) | 5′-TTC TGA CAG GCC ATG TCA TCC TCA-3′ |
2.11. Cell cycle arrest assay
The fluorescent PI dye is used for binding and labeling nucleic acids (DNA), for estimation of the content of cellular DNA by flow cytometric analysis and for the identification of hypodiploid cells. The percentages of untreated cells and the treated Hep-2 cells with an IC50 value of nanocurcumin for 48 h in different phases of the cell cycle were measured using a commercial flow cytometry kit (Abcam, Propidium Iodide Flow Cytometry Kit, catalog ab139418) as previously reported,37,38 Briefly, the Hep-2 cells were harvested and placed in the wells of a 6-well culture plate with each well containing a cell density of 1 × 10⁶ cells, and the plates were then left for 24 h for cell adhesion to occur. Then the cells were incubated with nanocurcumin for 48 h. Next, the cells were transferred to a tube then trypsinized using (trypsin–EDTA, 0.25%) and harvested by centrifuging at 1500 rpm for 5 min and finally fixed in 70% ice cold ethanol overnight. After fixation, the cells were centrifuged and their pellets were washed twice with PBS and then PI solution (40 μM ml−1 in PBS) containing RNase (100 μM ml−1) was added to stain the cells and then they were left for 30 min in the dark at 37 °C. The percentage of cells present in each phase of the cell cycle (sub-G1, G0/G1, S, and G2/M phases) were detected by single-cell quantification of stained DNA using flow cytometry and the results were given in the form of a histogram.2.12. Statistical analyses
One-way analysis of variance (ANOVA) was performed using SPSS Statistics 20 software (IBM) with a post hoc correction to determine differences. All data were presented as mean ± SD. A confidence interval of 95% was selected and a value of p < 0.05 was considered significant.3. Results
3.1. UV-vis and FT-IR measurements
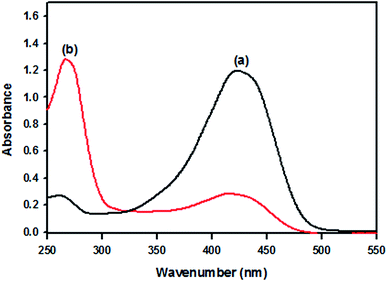
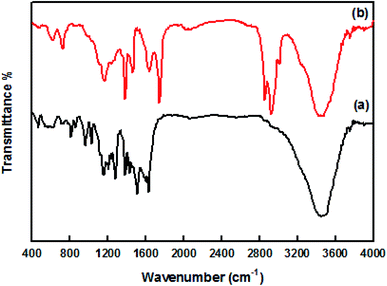
The UV-visible spectra of original curcumin and nanocurcumin in methanol are shown in Fig. 1. The absorption bands of original curcumin and nanocurcumin were found to be 426 nm and 419 nm, respectively, indicating that nanocurcumin exhibited a blue shift when compared with curcumin. Fig. 2 shows the FT-IR spectra of the curcumin and nanocurcumin. In the FT-IR analysis, the peaks correspond to different functional groups. Among these, the absorption peaks of original curcumin (Fig. 2a) showed shifts from characteristic vibrations at 3445 cm−1 (O–H), 1628 cm−1 (–C![[double bond, length as m-dash]](https://www.rsc.org/images/entities/char_e001.gif) O), 1157 cm−1 (C–H), and 1026 cm−1 (C–N) to 3426 cm−1, 1636 cm−1, 1165 cm−1 and 1034 cm−1, respectively, in nanocurcumin (Fig. 2b).
O), 1157 cm−1 (C–H), and 1026 cm−1 (C–N) to 3426 cm−1, 1636 cm−1, 1165 cm−1 and 1034 cm−1, respectively, in nanocurcumin (Fig. 2b).
3.2. X-ray diffraction techniques
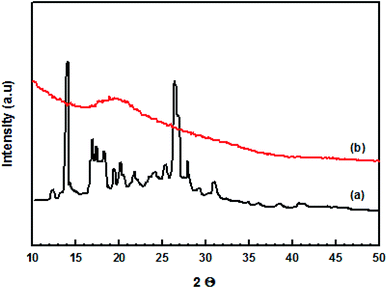
Comparison of the X-ray diffractograms for original curcumin and the prepared nanocurcumin (Fig. 3) indicated that the nanocurcumin exhibited a mainly amorphous character as shown by the disappearance of the main characteristic peaks of the original curcumin.3.3. TEM and DLS techniques
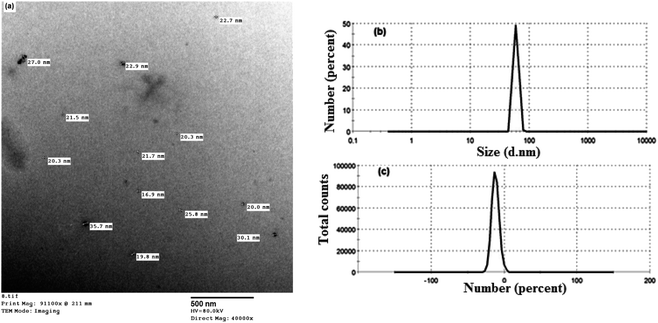
The size distribution and morphology of the prepared nanocurcumin particles were evaluated by dynamic light scattering (DLS) and TEM techniques, respectively. Based on the TEM image shown in Fig. 4a, the nanocurcumin exhibited an almost spherical shape with an average diameter of 28 nm. In addition, DLS was also used to obtain the size distribution of nanocurcumin. The results displayed in Fig. 4b, show that the prepared nanocurcumin possessed a narrow size distribution with an average particle size of about 59 nm. The zeta potential of nanocurcumin (Fig. 4c) was found to be about −12 mV, indicating a moderate stability of the colloid of the prepared nanocurcumin.3.4. Effect of nanocurcumin on cell viability
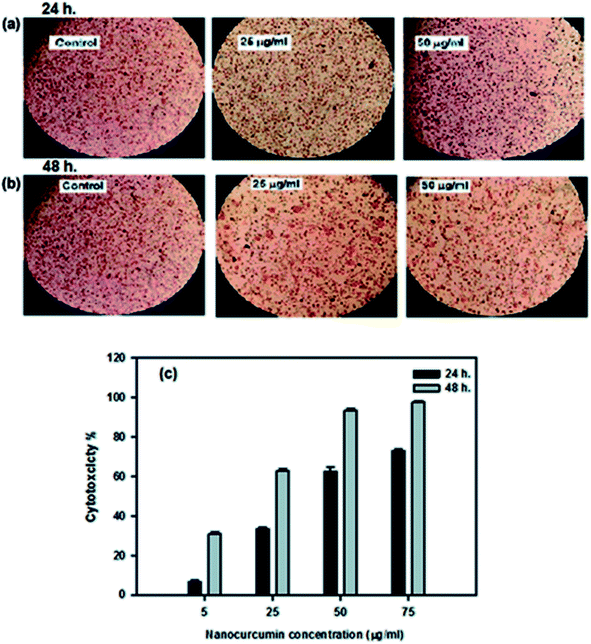
The cytotoxic effect of the curcumin nanoparticles against Hep-2 cancer cells and BHK normal cells was determined using the NRU assay. The efficacy of nanocurcumin on the growth of Hep-2 cells is summarized in Table 2 and represented graphically in Fig. 5c. The results revealed that changes in the Hep-2 cell viability depends on the dose concentration of nanocurcumin and the incubation time. The cytotoxicity (%) was significantly increased by increasing the nanocurcumin concentration as well as the duration time, and at the highest concentration of nanocurcumin (75 μg ml−1), the maximum cytotoxicity reached 73 ± 1% and 97.8 ± 0.6% during 24 h and 48 h of incubation, respectively. Also, with the lowest concentration of nanocurcumin (5 μg ml−1), the minimum cytotoxicity reached 6.7 ± 1% and 30.8 ± 1.2% during 24 h and 48 h of incubation, respectively. Thus, the strongest anti-proliferative effect of nanocurcumin was detected with an IC50 value (17 ± 0.31 μg ml−1) for an incubation time of 48 h which was lower than the IC50 value (45.1 ± 1.1 μg ml−1) obtained at 24 h for Hep-2 cells treated with nanocurcumin. Also, the microscopic examination of the control and treated nanocurcumin Hep-2 cells for incubation at 24 h and 48 h are shown in Fig. 5a and b, respectively. Compared with the normal shape of the control cells, the morphological changes in nanocurcumin treated cells indicated that the cell survival decreased with an increase of nanocurcumin concentration and incubation time and this agreed well with the obtained cytotoxicity data. For further confirmation on the strongest cytotoxic effect of nanocurcumin on Hep-2 cells, an LDH assay was performed. This assay showed that the percentage of LDH leakage was significantly increased in nanocurcumin treated cells (86.2 ± 0.7%) when compared with control cells (13.5 ± 0.2%), P < 0.001, whereas the control cells retained the LDH enzyme and showed minimal loss of enzyme activity.| Concentration (μg ml−1) | Cytotoxicity (%) | |
|---|---|---|
| (24 h) | (48 h) | |
| 5 | 6.7 ± 1 | 30.8 ± 1.2 |
| 25 | 33.4 ± 1 | 63 ± 1 |
| 50 | 62.5 ± 2.3 | 93.3 ± 1.2 |
| 75 | 73 ± 1 | 97.8 ± 0.6 |
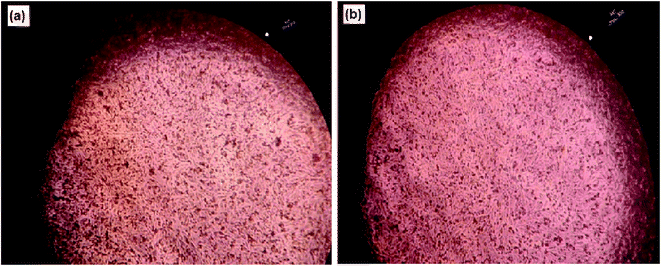
Nanocurcumin, also showed a highly increased percentage of cell viability against BHK normal cell lines after culturing the cells with different concentrations of curcumin nanoparticles (75–300 μg ml−1) for a maximum incubation period (48 h) and the results are summarized in Table 3. These results were supported by the microscopic examination for nanocurcumin treated BHK normal cells, which did not show any significant morphological changes when compared with untreated cells (negative control) and the results are presented in Fig. 6. From the results obtained it was suggested that nanocurcumin had efficient and selective effects on cancer cell proliferation without any significant effect on normal cells.
| Concentration (μg ml−1) | Cell viability after 48 h (%) |
|---|---|
| 75 | 98.2 ± 1.2 |
| 100 | 97.5 ± 1.5 |
| 200 | 96.2 ± 1 |
| 300 | 95.4 ± 0.5 |
3.5. Annexin V-FITC/PI assay
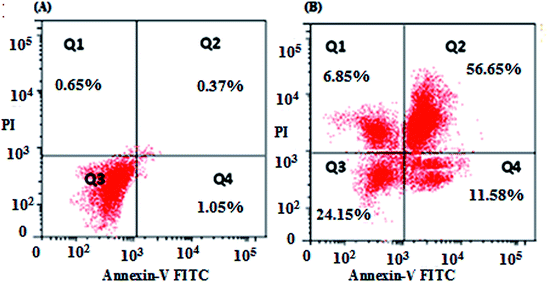
The results of the flow cytometric analysis of apoptotic induction by nanocurcumin against Hep-2 cells are displayed in Fig. 7. There was a significant increase in the percentages of early apoptotic, late apoptotic, and necrotic cells in the nanocurcumin treated cells: 11.85%, 56.65% and 6.85%, respectively, when compared to their percentages in control cells: 1.05%, 0.37%, and 0.65%, respectively. These results suggested that there was induction of apoptosis in nanocurcumin treated cells.3.6. Dual staining (AO/EB) assay
For further confirmation of apoptosis induction by nanocurcumin, the nuclear morphology changes related to apoptosis of Hep-2 cells after treatment with nanocurcumin were examined using a dual staining (AO/EB) assay and the results are displayed in Fig. 8a–c. There was no significant apoptosis observed in the negative control group (Fig. 8a), whereas viable, early, and late apoptotic cells in nanocurcumin treated cells were shown as green AO nuclear staining, yellow-green AO nuclear staining and orange nuclear EB staining, respectively (Fig. 8b and c). Also, the percentages of viable and apoptotic cells in control and treated cells are shown in (Fig. 9), where there was a significant increase in the percentage of apoptotic cells in the nanocurcumin treated cells (74% ± 2.6) when compared to the apoptotic cells in control cells (16% ± 1), P < 0.001.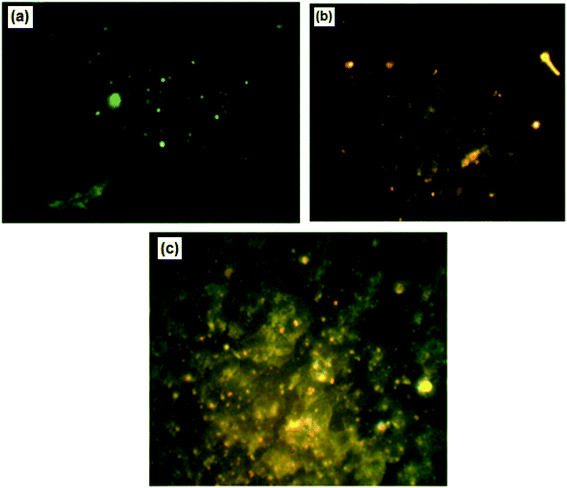 | ||
| Fig. 8 The nuclear morphological changes in control cells (a) compared with nanocurcumin treated Hep-2 cells (b and c) using fluorescence microscopy with AO/EB staining. | ||
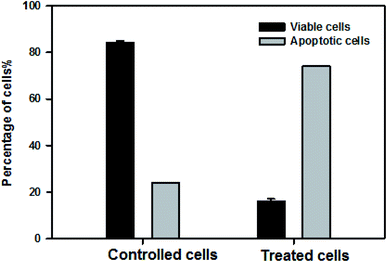 | ||
| Fig. 9 The percentages of viable and apoptotic cells in control and nanocurcumin treated Hep-2 cells. Data represented as mean ± SD of three independent tests, P < 0.001. | ||
3.7. Comet assay
The assessment of DNA damage as a result of apoptosis was studied using a comet assay. As shown in Table 4, there is a significant increase in OTM (1.9 ± 0.2) in nanocurcumin treated Hep-2 cells for 48 h when compared with control cells (0.46 ± 0.04), P < 0.001. Also, the fluorescence microscopic images (Fig. 10) confirmed that the control cells had an intact nucleus, but the nanocurcumin treated cells had an intense comet nucleus as a marker of DNA damage. These results suggested the progression of apoptosis in nanocurcumin treated Hep-2 cells.| Parameter | Tail length | DNA in tail | Tail moment | Olive tail moment |
|---|---|---|---|---|
| Untreated Hep-2 cancer cell lines (control) | 8.4 ± 1.9 | 2.7 ± 0.2* | 0.24 ± 0.04* | 0.46 ± 0.04** |
| Nanocurcumin treated Hep-2 cancer cell lines | 9.3 ± 2.8 | 8.3 ± 1.2* | 1.1 ± 0.3* | 1.9 ± 0.2** |
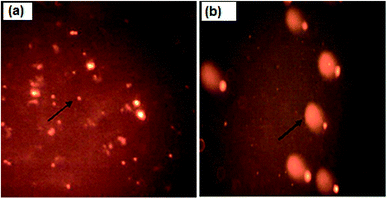 | ||
| Fig. 10 Fluorescence microscopic images of untreated control cells with an intact nucleus (a) and nanocurcumin treated Hep-2 cells with a comet nucleus formation pattern as a sign of DNA damage (b). | ||
3.8. Gene expression analysis using real-time PCR
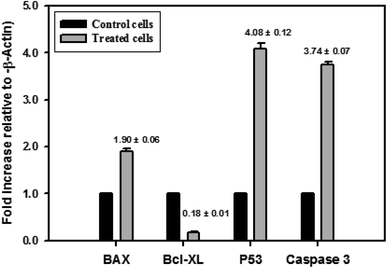
The different pathways for the apoptosis induction in nanocurcumin treated Hep-2 cells were investigated. The expression levels of some selected gene coding for proteins that may play an important role in the apoptosis pathway using RT-PCR are shown in Fig. 11. There was a significant increase in the expression levels of P53, Bax and Caspase-3 and, also a significant reduction in the expression level of Bcl-XL in Hep-2 cells treated with nanocurcumin when compared to control cells, P < 0.001.3.9. Cell cycle analysis
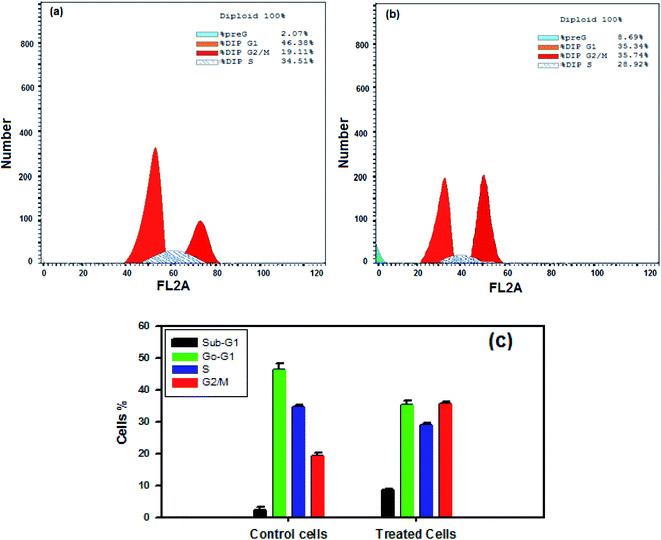
The effect of nanocurcumin on cell cycle distribution in control cells (a) compared with the effect on nanocurcumin treated Hep-2 cells (b) using flow cytometry are shown in Fig. 12a and b. A significant increase was detected in the percentages of cells in the G2/M and sub G1 phases in nanocurcumin treated Hep-2 cells (Fig. 12b), (35.74 ± 0.4% and 8.69 ± 0.3%, respectively) when compared to the percentages in the control cells (Fig. 12a), (19.11 ± 1.1% and 2.07 ± 1.3%, respectively), P < 0.001 and the percentages of the cells in each phase of the cell cycle in treated Hep-2 cells and control cells are presented in a representative histogram (Fig. 12c). However, there was a significant decrease in the G0/G1 and S phases in treated cells (35.34 ± 1.4% and 28.92 ± 0.7%, respectively) when compared to control cells (46.38 ± 1.8% and 34.51 ± 0.8%, respectively), P < 0.001. These results suggested that nanocurcumin induced cell cycle arrest at the G2/M phase with an increase in apoptotic cells in a sub-G1-phase in Hep-2 cells.4. Discussion
The prepared nanocurcumin particles were characterized using different parameters which confirmed the formation of well characterized nanoparticles. The results obtained for the UV-visible spectroscopy revealed the successful formation of curcumin nanoparticles. The blue shift observed between curcumin and nanocurcumin absorption bands may be due to the formation of nanocurcumin as a result of size reduction, which was consistent with previous findings.39–41 Also, the simple shift in absorption peaks of the FT-IR spectra of nanocurcumin were compared with pure curcumin and may indicate minor structural changes that occurred at the molecular level through the preparation of the nanocurcumin by the sol-oil method. Some previous studies also described such a minor structural changes between curcumin and the synthesized curcumin nanoparticles using different synthesis techniques.42–44 Also, the FT-IR spectrum for solid curcumin nanoparticles (Fig. 2b) did not show any specific spectra for the presence of olive oil, suggesting that a pure form of the dried nanocurcumin was obtained. Similar results were previously reported for the absence of any signs in the IR spectra of the existence of olive oil in the final dried form of their prepared apotransferrin nanoparticles.25Furthermore, the results of the X-ray diffraction analysis demonstrated that nanocurcumin exhibited an amorphous character. The reduction in the crystallinity caused a decrease in thermodynamic stability, so increasing dissolution rate and bioavailability of curcumin molecules as a result of dissolution of the curcumin molecules into well dispersed curcumin nanoparticles.42 Also, it was established that the prepared nanocurcumin had a narrow size distribution with average particle size higher than the average size that was determined using TEM images, presumably due to the hydrodynamic radius of the solvated nanoparticles. It was reported previously that nanoparticles with a size of 38–75 nm can easily diffuse between digestive mucosa and showed a higher absorption than molecules with a larger size and thus the nanoparticles were suitable for targeting cancer cells via improved permeability and retention.45,46 Therefore, the size reduction of the curcumin nanoparticles prepared here may improve the bioavailability and have a better therapeutic efficacy in cancer treatment. Compared to several previous studies,40,42,47 the size of the curcumin nanoparticles prepared in this research was much smaller. In addition, the spherical shape, narrow size distribution and surface features of the curcumin nanoparticles confirmed by TEM and DLS studies, may have a critical role in the cellular uptake by this curcumin nanoparticle in vitro. In addition, the zeta potential is a vital key for the evaluation of the nanoparticles' stability by determining the surface charges. Therefore, a highly stable nanoparticle can be synthesized by adjusting the zeta-potential to greater than 30 mV or less than −30 mV.48 Thus, in this study, the zeta potential value of the prepared curcumin nanoparticles (−12 mV), suggested that it had a moderate stability.
The cytotoxic effect of nanocurcumin against normal BHK cells and human Hep-2 cancer cells was investigated and the data obtained using the NRU assay revealed that both the dose and incubation time were critical factors in evaluating the inhibition efficiency of nanocurcumin towards Hep-2 cells. The results indicated that the growth and proliferation rate of Hep-2 cells significantly gradually decreased with an increase of time of cellular exposure and concentration. It was found that the IC50 value of nanocurcumin for 48 h was more effective with a higher anti-proliferative effect aganist Hep-2 cells than the IC50 value for 24 h. In addition, using microscopic examination, the nanocurcumin Hep-2 treated were more shrinking, greater decrease of viable cells, more round, and less adherent at a higher concentration for a longer incubation period (48 h). This observation was in agreement with the obtained NRU assay results. Similar reports mentioned that inhibiting the growth of HT-29 colon cancer cells by curcuminoid microemulsion was also dependent on increasing the dose and incubation time with a lower more potent IC50 value for incubation of 48 h than IC50 for 24 h.30 It was reported before that curcumin was considered to be less active against a human Hep-2 cancer cell line at a minimum concentration.24 However, in the current study, it was found that, nanocurcumin had a more potent cytotoxicity with a low concentration.
Also, the measurement of LDH activity is additional marker for cell viability. Therefore, highly significant percentages of LDH leakage were detected in nanocurcumin Hep-2 treated cells when compared with control cells. Thus, these results suggested that cytotoxicity by nanocurcumin was through an effect on membrane integrity, which can occur through either necrosis or apoptosis. All the results obtained were supported by results of previous studies, which proved the anti-proliferative effects of nanocurcumin against different cancer cells.49–52
Furthermore, the results suggested a lack of cytotoxicity of the prepared nanocurcumin against BHK normal cells using the NRU assay, where at a concentration of 75 μg ml−1, nanocurcumin showed the highest inhibition (%) for Hep-2 cell viability (97.8%), but the lowest inhibition (%) for BHK cell viability (1.8%). This supported the idea that the prepared nanocurcumin possessed efficient and selective effects on the proliferation of the tested cancer cells leaving the normal cells unaffected, thus confirming that nanocurcumin could potentially have variety of applications in the biomedical science and cancer therapy fields.
The studied cytotoxicity techniques (NRU and LDH) cannot be used for differentiation between different mechanisms of cell death. So, different techniques were used for the detection apoptosis such as Annexin V-FITC and flow cytometry and were assessed using PI analyses.52 Apoptosis is a type of programmed cell death that is genetically regulated for controlling the growth of tissues and multicellular organisms by an extremely organized physiological method to remove abnormal cells and physical damage.53 The cytometric results obtained using the Annexin V-FITC/PI method confirmed the apoptosis induction of Hep-2 cells by nanocurcumin where the results revealed that the percentages of apoptotic cells (early and late) and necrotic cells were significantly higher in nanocurcumin treated Hep-2 cells than the control cells.
This finding confirmed the synergistic effect of nanocurcumin towards cancer cells. Previous reports observed that higher percentages of a population of HT-29 cells,31 and breast carcinoma,49 underwent early and late apoptosis with the use of a curcuminoid microemulsion and basic nanocurcumin, respectively.
Also, the findings for apoptosis progression by the Annexin V-FITC/PI method was supported using the dual staining (AO/EB) assay. The AO/EB staining technique was used for the identification of nuclear morphological changes of cell membranes during apoptosis under a fluorescence microscope.54 In addition, it can be used for differentiation between different cell types (normal viable cells, early and late apoptotic cells, and necrotic cells). So, AO/EB staining is considered to be a qualitative and quantitative technique for detecting apoptosis.55 The detection of the different nuclei shapes for the viable and the apoptotic cells (Fig. 8) indicated a significantly higher percentages of apoptotic cells (early and late) in nanocurcumin treated Hep-2 cells than in control cells which was in agreement with the previously reported results.56
The DNA damage in apoptotic cells as a result of apoptosis in nanocurcumin treated cells was investigated using various parameters (nucleus diameter, OTM, and length of comet tail) and was studied using the comet assay.57–59 Based on this technique, the results evaluated from the OTM showed a significant increase in DNA damage in nanocurcumin Hep-2 treated cells than the control cells. The DNA damage was also confirmed by the difference in the fluorescence microscopy images for the nucleus of nanocurcumin treated cells (intense comet nucleus) and the untreated control cells (intact nucleus), Fig. 10. Similar results for apoptosis induction by nanocurcumin in different cancer cells were described previously.49
It is well known that the proteins of the Bcl-2 family have been identified as regulators of apoptosis, their functions being pro-apoptotic (Bax, Bak and Bad) or anti-apoptotic (Bcl-2 and Bcl-XL) regulators.60 Also, apoptosis can be induced by p53 through the transcription-dependent mechanism, where p53 induces expression of Bax, which is the main intrinsic pathway of apoptosis.61 In addition, the upregulation of Bax resulted in the stimulation of cytochrome C released from mitochondria for Caspase activation to execute apoptosis with inhibition expression of the BCL-2 gene.9,62 Therefore, in the current study, it was found that there was a significant increase in the expression levels of P53, Bax and Caspase-3 accompanied by a significant reduction in the expression level of Bcl-XL in nanocurcumin Hep-2 treated cells when compared to the control cells (Fig. 11). Thus, these results revealed that p53 induces apoptosis in nanocurcumin treated cells through the activation of a Caspase cascade pathway in the transcription-dependent mechanism.63 These findings were consistent with the results of previous studies that showed the down-regulation of Bcl-XL by curcumin, which resulted in apoptosis.63 Lately, it has been found thatCaspase-3 is necessary for the fragmentation of DNA and the morphological changes associated with apoptosis.64 Therefore, in the current study, it was detected that was a significant increase in the expression levels of Caspase-3 in nanocurcumin Hep-2 treated cells, which suggested that, the apoptotic pathway also depended on Caspase-3 activity.
On the other hand, flow cytometry is considered to be a classical technique with a high sensitivity for the detection of cell apoptosis and simultaneous cell cycle analyses.65 The cells of the normal cell cycle have check points which act as control mechanisms for the detection of the correct execution of cell cycle events, so apoptosis induction and cell proliferation inhibition are presumably due to the action of signal transduction molecules that participate in the cell cycle.24 There are specific genes that regulate the pre-mitosis G2/M phase and pre-replication G1/S phase which are the two important check points for DNA damage.66 Therefore, in the present study, the percentages of Hep-2 cells that present were in each phase of the cell cycle were determined, after treatment with nanocurcumin, using flow cytometry, and the results (Fig. 12a–c) showed a significant decrease in the number of cells in the proliferative G0/G1 and S phases with a significant increase in the number of cells in the G2/M and sub G1 phases when compared with the control results. The results obtained suggested that there was an accumulation in apoptotic cells at G2/M phase which preceded the G1 phase, which is known as pre G1 apoptosis, thus the percentages of Hep-2 cancer cells that will enter G1 will decrease. In addition, current studies suggested that p53 has a role in regulating the G2/M transition,67–69 where P53 and P21 are important proteins in the regulation of the cell cycle and induction of apoptosis.70,71 The RT-PCR showed that the apoptotic profile for the nanocurcumin treated cells was accompanied by an increase in the expression levels of P53 (Fig. 11). Thus, these results may suggest that P53 has an important role for the induction of G2/M Hep-2 cell cycle arrest after treatment with nanocurcumin. Similarly, arresting the G2/M phase in lung cancer cells by nanocurcumin was previously reported.72 Based on the previous findings, it was concluded that the induction of apoptosis of Hep-2 cells after nanocurcumin treatment was through two mechanisms: G2/M cell cycle arrest and induction of apoptosis which was dependent on Caspase-3 and p53 activation.
5. Conclusions
Nanocurcumin with a narrow particle size distribution was successfully prepared by an easy method using a sol-oil technique. The prepared nanocurcumin displayed a significant inhibition effects against the proliferation of human Hep-2 cancer cells using neutral red uptake and lactate dehydrogenase assays. The inhibition mechanisms of the action of the investigated curcumin nanoparticles on the inhibition growth of human Hep-2 cancer cells was investigated via apoptosis detection methods (Annexin V/PI staining, AO/EB staining, and comet assays), flow cytometric analyses and gene expression studies, and the results revealed that cytotoxic effect of nanocurcumin against Hep-2 cancer cells inhibition may occur through G2/M cell cycle arrest and the induction of apoptosis, which was dependent on Caspase-3 and p53 activation. Although future studies using nanocurcumin in an in vivo animal experimental model are required, these results suggest that nanocurcumin could potentially be used for laryngeal cancer treatment.Funding
This research did not receive any specific grant from funding agencies in the public, commercial, or not-for-profit sectors.Conflicts of interest
The authors declare no known conflicts of interest associated with this publication.Acknowledgements
The authors express their thanks to the Faculty of Science, Cairo University for supporting them while they were completing the research work.References
- G. M. Cragg and D. J. Newman, J. Ethnopharmacol., 2005, 100, 72–79 CrossRef CAS PubMed.
- D. S. Fabricant and N. R. Farnsworth, Environ. Health Perspect., 2001, 109, 1–69 Search PubMed.
- P. Anand, C. Sundaram, S. Jhurani, B. K. Ajaikumar and B. B. Aggarwal, Cancer Lett., 2008, 267, 33–164 CrossRef PubMed.
- C. J. Weng and G. C. Yen, Cancer Treat. Rev., 2012, 38, 76–87 CrossRef CAS PubMed.
- F. Ye, G. H. Zhang, B. X. Guan and X. C. Xu, World J. Gastroenterol., 2012, 18, 126–135 CrossRef CAS PubMed.
- S. P. Tu, H. Jin, J. D. Shi, L. M. Zhu, Y. Suo, G. Lu, A. Liu, T. C. Wang and C. S. Yang, Cancer Prev. Res., 2012, 5, 205–215 CrossRef CAS PubMed.
- W. W. Quitschke, PLoS One, 2012, 7, e39568 CrossRef CAS PubMed.
- C. R. Ireson, D. J. Jones, S. Orr, M. W. Coughtrie, D. J. Boocock, M. L. Williams, P. B. Farmer, W. P. Steward and A. J. Gescher, Cancer Epidemiol., Biomarkers Prev., 2002, 11, 105–111 CAS.
- R. J. Anto, A. Mukhopadhyay, K. Denning and B. B. Aggarwal, Carcinogenesis, 2002, 23, 143–150 CrossRef CAS PubMed.
- A. N. Tse, R. Carvajal and G. K. Schwartz, Clin. Cancer Res., 2007, 13, 1955–1960 CrossRef CAS PubMed.
- G. G. Mackenzie, N. Queisser, M. L. Wolfson, C. G. Fraga, A. M. Adamo and P. I. Oteiza, Int. J. Cancer, 2008, 123, 56–65 CrossRef CAS PubMed.
- R. P. Sahu, S. Batra and S. K. Srivastava, Br. J. Cancer, 2009, 100, 1425–1433 CrossRef CAS PubMed.
- R. G. Pillai, A. S. Srivastava, T. I. Hassanein, D. P. Chauhan and E. Carrier, Cancer Lett., 2004, 208, 163–170 CrossRef PubMed.
- P. Anand, A. B. Kunnumakkara, R. A. Newman and B. B. Aggarwal, Mol. Pharm., 2007, 4, 807–818 CrossRef CAS PubMed.
- V. Karri, G. Kuppusamy, S. V. Talluri, S. S. Mannemala, R. Kollipara, A. D. Wadhwani, S. Mulukutla, K. R. Raju and R. Malayandi, Int. J. Biol. Macromol., 2016, 93, 1519–1529 CrossRef CAS PubMed.
- B. Singh, R. K. Basniwal, H. S. Buttar, V. Jain and N. Jain, J. Agric. Food Chem., 2011, 59, 2056–2061 CrossRef PubMed.
- Y. J. Chen, B. S. Inbaraj, Y. S. Pu and B. H. Chen, Nanotechnology, 2014, 25, 155102 CrossRef PubMed.
- U. Gandapu, R. K. Chaitanya, G. Kishore, R. C. Reddy and A. K. Kondapi, PLoS One, 2011, 6, e23388 CrossRef CAS PubMed.
- C. Wen, Y. Zhou, C. Zhou, Y. Zhang, X. Hu, J. Li and H. Yin, J. Nanomater., 2017, 2017, 8 CrossRef.
- R. K. Basniwal, R. Khosla and N. Jain, Nutr. Cancer, 2014, 66, 1015–1022 CrossRef CAS PubMed.
- E. Conor, M. D. Steuer, M. D. Mark El-Deiry, R. Jason, M. D. Parks, A. Kristin, M. D. Higgins, F. Nabil and M. D. Saba, Ca-Cancer J. Clin., 2017, 67, 31–50 CrossRef PubMed.
- P. A. Marck and A. J. Lupin, J. Otolaryngol., 1989, 18, 344–349 CAS.
- P. Srivastava and A. Srivastava, Int. J. Eng. Res. Gen. Sci., 2015, 3, 495–508 Search PubMed.
- M. Kumaravel, P. Sankar, P. Latha, C. S. Benson and R. Rukkumani, Nat. Prod. Commun., 2013, 8, 183–186 CrossRef CAS PubMed.
- A. D. S. Krishna, R. K. Mandraju, G. Kishore and A. K. Kondapi, PLoS One, 2009, 4, e7240 CrossRef PubMed.
- E. Borenfreund and J. Puerner, J. Tissue Cult. Methods, 1984, 9, 7–9 CrossRef.
- G. Repetto, A. Del Peso and J. L. Zurita, Nat. Protoc., 2008, 3, 1125–1131 CrossRef CAS PubMed.
- M. Radwan, R. Abdullah, M. S. Al-Qubaisi, M. E. El Zowalaty, S. E. Naadja, N. B. Alitheen and A. R. Omar, Mol. Med. Rep., 2016, 13, 3945–3952 CrossRef PubMed.
- I. Vermes, C. Haanen, H. Steffens-Nakken and C. Reutelingsperger, J. Immunol. Methods, 1995, 184, 39–51 CrossRef CAS PubMed.
- Y. C. Chen and B. H. Chen, RSC Adv., 2018, 8, 2323–2337 RSC.
- D. Ribble, N. B. Goldstein, D. A. Norris and Y. G. Shellman, BMC Biotechnol., 2005, 5, 12 CrossRef PubMed.
- S. Arora, J. Jain, J. Rajwade and K. Paknikar, Toxicol. Appl. Pharmacol., 2009, 236, 310–318 CrossRef CAS PubMed.
- N. P. Singh, M. T. Mccoy, R. T. Tice and E. l. Schneider, Exp. Cell Res., 1988, 175, 184–191 CrossRef CAS PubMed.
- P. L. Olive, J. P. Banath and R. E. Durand, Radiat. Res., 1990, 122, 86–94 CrossRef CAS PubMed.
- P. L. Olive, Mutat. Res., 2009, 681, 13–23 CAS.
- K. J. Livak and T. D. Schmittgen, Methods, 2001, 25, 402–408 CrossRef CAS PubMed.
- D. Chakraborty, A. Samadder, S. Dutta and A. R. Khuda-Bukhsh, Exp. Biol. Med., 2012, 237, 64–76 CrossRef CAS PubMed.
- S. V. Bava, V. T. Puliappadamba, A. Deepti, A. Nair, D. Karunagaran and R. J. Anto, J. Biol. Chem., 2005, 280, 6301–6308 CrossRef CAS PubMed.
- M. Ghosh, A. Singh, W. Xu, T. Sulchek, L. Gordon and R. Ryan, Nanomedicine, 2011, 7, 162–167 CrossRef CAS PubMed.
- A. Rajasekar and T. Devasena, J. Nanosci. Nanotechnol., 2015, 15, 4119–4125 CrossRef CAS PubMed.
- P. Gupta and M. Ramrakhiani, Open Nanosci. J., 2009, 3, 15 CrossRef CAS.
- Z. Zhao, M. Xie, Y. Li, A. Chen, G. Li, J. Zhang, H. Hu, X. Wang and S. Li, Int. J. Nanomed., 2015, 10, 3171–3181 CrossRef CAS PubMed.
- K. Araki, M. Yoshizumi, S. Kimura, A. Tanaka, D. Inoue, T. Furubayashi, T. Sakane and M. Enomura, AAPS PharmSciTech, 2020, 21, 17 CrossRef CAS PubMed.
- R. S. Pandit, S. C. Gaikwad, G. A. Agarkar, A. K. Gade and M. Rai, 3 Biotech, 2015, 5, 991–997 CrossRef PubMed.
- J. Fang, H. Nakamura and H. Maeda, Adv. Drug Delivery Rev., 2011, 63, 136–151 CrossRef CAS PubMed.
- M. P. Desai, V. Labhasetwar, G. L. Amidon and R. J. Levy, Pharm. Res., 1996, 13, 1838–1845 CrossRef CAS PubMed.
- M. Abirami, M. J. Raja, P. Mekala and P. Visha, Int. J. Sci. Environ. Technol., 2018, 7, 1100–1103 Search PubMed.
- P. Lakshmi and G. A. Kumar, Int. J. Pharm. Pharm. Sci., 2010, 2, 35–40 Search PubMed.
- O. A. R. A. Zaid, F. A. Ahmed, M. A. Badwi and N. M. H. Ibrahim, Benha Veterinary Medical Journal, 2017, 33, 107–116 CrossRef.
- F. Milano, L. Mari, W. van de Luijtgaarden, K. Parikh, S. Calpe and K. K. Krishnadath, Oncol, 2013, 3, 137–148 Search PubMed.
- M. Shariati, S. Hajigholami, Z. Veisi Malekshahi, M. Entezari, N. Bodaghabadi and M. Sadeghizadeh, Iran. Biomed. J., 2017, 22, 171–179 Search PubMed.
- P. Ziasarabi, A. Hesari, M. Bagheri, M. Baazm and F. Ghasemi, Iran. J. Toxicol., 2018, 12, 47–50 Search PubMed.
- A. K. Taraphdar, M. Roy and R. Bhattacharya, Curr. Sci., 2001, 80, 1387–1396 CAS.
- I. C. Gherghi, S. T. Girousi, A. N. Voulgaropoulos and R. Tzimou-Tsitouridou, Talanta, 2003, 61, 103–112 CrossRef CAS PubMed.
- D. Baskić, S. Popović, P. Ristić and N. N. Arsenijević, Cell Biol. Int., 2006, 30, 924–932 CrossRef PubMed.
- J. J. Pillai, A. K. T. Thulasidasan, R. J. Anto, N. C. Devika, N. Ashwanikumar and G. V. Kumar, RSC Adv., 2015, 5, 25518 RSC.
- M. Klaude, S. Eriksson, J. Nygren and G. Ahnström, Mutat. Res., 1996, 363, 89–96 Search PubMed.
- C. M. Hughes, S. E. M. Lewis, V. J. McKelvey-Martin and W. Thompson, Mol. Hum. Reprod., 1996, 2, 613–619 CrossRef CAS PubMed.
- N. P. Stephens and R. E. Singh, Mutagenesis, 1998, 13, 75–79 CrossRef PubMed.
- J. M. Adams and S. Cory, Science, 1998, 281, 1322–1326 CrossRef CAS PubMed.
- M. Oren, Cell Death Differ., 2003, 10, 431–442 CrossRef CAS PubMed.
- M. Hassan, H. Watari, A. AbuAlmaaty, Y. Ohba and N. Sakuragi, BioMed Res. Int., 2014, 2014, 150845 Search PubMed.
- A. Susin, H. K. Lorenzo, N. Zamzami, I. Marzo, C. Brenner, N. Larochette, M. C. Prévost, P. M. Alzari and G. Kroemer, J. Exp. Med., 1999, 189, 381–394 CrossRef PubMed.
- R. U. Jänicke, M. L. Sprengart, M. R. Wati and A. G. Porter, J. Biol. Chem., 1998, 273, 9357–9360 CrossRef PubMed.
- M. Meyer, M. Essack, S. Kanyanda and J. Rees, Biotechniques, 2008, 45, 317–320 CrossRef CAS PubMed.
- J. Bartek and J. Lukas, FEBS Lett., 2001, 490, 117–122 CrossRef CAS PubMed.
- M. L. Agarwal, A. Agarwal, W. R. Taylor and G. R. Stark, Proc. Natl. Acad. Sci. U. S. A., 1995, 92, 8493–8497 CrossRef CAS PubMed.
- C. Guillouf, F. Rosselli, K. Krishnaraju, E. Moustacchi, B. Hoffman and D. A. Liebermann, Oncogene, 1995, 10, 2263–2270 CAS.
- N. Stewart, G. G. Hicks, F. Paraskevas and M. Mowat, Oncogene, 1995, 10, 109–115 CAS.
- K. H. Vousden and D. P. Lane, Nat. Rev. Mol. Cell Biol., 2007, 8, 275–283 CrossRef CAS PubMed.
- Y. L. Lin, Y. T. Su and B. H. Chen, Eur. J. Pharmacol., 2010, 637, 1–10 CrossRef CAS PubMed.
- H. Chang and B. Chen, Int. J. Nanomed., 2015, 10, 5059–5080 CAS.
| This journal is © The Royal Society of Chemistry 2020 |

