DOI:
10.1039/D0RA00177E
(Paper)
RSC Adv., 2020,
10, 20713-20723
Bismuth–iron-based precursor: preparation, phase composition, and two methods of thermal treatment†
Received
8th January 2020
, Accepted 2nd May 2020
First published on 1st June 2020
Abstract
Bismuth ferrite (BiFeO3) is a promising Bi-based perovskite-type material, which is multiferroic due to the coexistence of anti-ferromagnetism and ferroelectricity. During the preparation of pure BiFeO3 nanoparticles, however, the phase structures and species of bismuth–iron-based precursor (BFOH) were still unclear, and so related precursors were prepared. X-ray diffraction, Raman, Fourier transform infrared, and X-ray absorption near-edge structure techniques were used to probe the phase structure and species of the precursors. It was found that the precursor BFOH is composed of Bi6O6(NO3)4(OH)2·2H2O, Bi6O5(NO3)5(OH)3·3H2O, Fe(OH)3, and α-Bi2O3. Calcination treatment and hydrothermal synthesis were used to prepare the pure BiFeO3 phase from the precursor BFOH. The calcination temperature was optimized as 400 °C for preparation of the pure BiFeO3 phase. Meanwhile, hydrothermal conditions for the synthesis of the pure BiFeO3 phase were also optimized as follows: the reaction solution was the mixture solution of Bi(NO3)3·5H2O and Fe(NO3)3·9H2O with cetyltrimethyl ammonium bromide (CTAB) as the surfactant and KOH as the mineralizer; the hydrothermal synthesis was performed at 180 °C for 48 h; the concentration of KOH should be at least 3 M; and the surfactant CTAB can be used to regulate the morphology of the as-prepared BiFeO3 nanoparticles. From the point of view of the microstructure, BiFeO3 nanoparticles prepared by calcination or hydrothermal methods have no notable differences. A formation mechanism from the precursor BFOH to the BiFeO3 product is proposed. By providing an understanding of the precursors, this work is very helpful in the synthesis of bismuth–iron-based nanoparticles.
1. Introduction
Magnetic and ferroelectric materials, as conventional research subjects, have a wide and important range of applications1 in the field of electrical and sensor devices. Only a few materials exhibit both ferroelectric and magnetic polarizations,2 and these are called multiferroic. Bismuth ferrite (BiFeO3) is currently one3 of the most studied multiferroic materials due to its promising applications at room temperature. BiFeO3 shows a rhombohedrically distorted perovskite structure4 with space group R3c at room temperature and atmospheric pressure. Its cell parameters are arh = brh = crh = 3.965 Å, and αrh = βrh = γrh = 89.3°. In addition, the BiFeO3 structure is also frequently described with a hexagonal unit cell,3 in which ahex = bhex = 5.58 Å, chex = 13.90 Å, αhex = βhex = 90°, and γhex = 120°. The ferroelectricity of BiFeO3 originates from the stereochemically active lone-pair orbital5 of the bismuth ions, which are largely displaced with respect to the octahedra and generate spontaneous polarization along the [111] axis of the rhombohedral unit cell. Furthermore, BiFeO3 is a G-type anti-ferromagnet6 in which all neighboring magnetic spins are oriented anti-parallel to each other, and the BiFeO3 structure presents spin canting, which results in a weak magnetic moment in the unit cell according to the Dzyaloshinskii–Moriya interaction7 due to the oxygen octahedral distortion. Typically, its ferroelectric Curie temperature (TC) is about 830 °C, and the anti-ferromagnetic Neel temperature8 (TN) is about 370 °C.
In the past decade, BiFeO3 nanoparticles (NPs) with different morphologies have been prepared, including nanospheres,9 micro10/nanorods,11 nanowires,12–14 nanotubes,15 and micro16/nanoplates.17 Among the many synthesis methods for BiFeO3 NPs, the hydrothermal method11,14,18–27 is the most widely accepted and used. In addition, V. A. Reddy et al.28 prepared nano-crystalline BiFeO3 samples using the spray pyrolysis method. Nandini Das et al.29 synthesized nano-sized bismuth ferrite powder through sonochemical and microemulsion techniques. H. Ke,30 M. Y. Shami31 and H. Shokrollahi32 et al. obtained nano-sized BiFeO3 powders by using a chemical co-precipitation method. S. Ghosh et al.33 produced bismuth ferrite products by utilizing the solid-state reaction between Bi2O3 and Fe2O3. N. A. Lomanova et al.34 investigated the influence of synthesis temperature on the formation of BiFeO3 NPs. C. Paraschiv et al.35 obtained nano-sized BiFeO3 by the combustion of Fe(NO3)3·9H2O/Bi(NO3)3·5H2O/glycine or urea systems. For all these methods, complicated synthesis steps are involved. Even for calcination and hydrothermal methods, many different types of starting materials, surfactants, or fuels are needed. To our knowledge, the phase structures and compositions of the precursors used in preparing BiFeO3, which are very important for the synthesis of BiFeO3 and its related Bi-based nanomaterials, are rarely studied. The formation processes for the precursors have puzzled researchers for a long time. In addition, impurity phases, such as Bi2O3, Bi25FeO40, and Bi2Fe4O9, are easily produced during the preparation4,23 of BiFeO3 if the reaction conditions are not controlled properly. How to prepare pure BiFeO3 product is also an important issue.
In this paper, the bismuth–iron-based precursor (BFOH) and other related precursors are prepared at room temperature. X-ray diffraction (XRD), Raman, Fourier transform infrared (FTIR), and X-ray absorption near-edge structure (XANES) spectroscopies are used to investigate the phase structures and compositions of the precursor BFOH for calcination and hydrothermal methods. The influence of synthetic conditions on the final products are systematically investigated, including reaction time, mineralizer concentration, the type and amount of surfactant in the hydrothermal synthesis, as well as the calcination temperature in the calcination synthesis. The optimal conditions to form pure BiFeO3 product using calcination synthesis or hydrothermal synthesis are described.
2. Experimental details
2.1 Materials
The reagents, including bismuth nitrate pentahydrate (Bi(NO3)3·5H2O, abbreviated as BNO), iron nitrate nonahydrate (Fe(NO3)3·9H2O, abbreviated as FNO), cetyltrimethyl ammonium bromide (C16H33(CH3)3NBr, abbreviated as CTAB), polyvinyl pyrrolidone ((C6H9NO)n, abbreviated as PVP), ethylenediaminetetraacetic acid (C10H16N2O8, abbreviated as EDTA), potassium hydroxide (KOH), and standard sample bismuth oxide (Bi2O3-std) were purchased from Aladdin Chemistry Co. Ltd. These reagents were analytical pure grade and were not further purified for use. In addition, absolute ethanol and distilled water were used in the sample preparation. A GSL-1600X/1400X double-temperature vacuum tube furnace was purchased from Hefei Kejing Material Technology Co. Ltd. The hydrothermal apparatus of a teflon-lined stainless steel autoclave was purchased from Anhui Kemi Machinery Technology Co. Ltd.
2.2 Preparation of precursors
In a typical synthesis process, BNO and FNO were used as metal sources and distilled water was used as solvent. First, 4 mmol of BNO and 4 mmol FNO were, respectively, dissolved in 20 ml of distilled water, then the two solutions were mixed to give 40 ml of solution. An aqueous solution of 3 M KOH (40 ml) was added dropwise into the mixture with vigorous stirring for 30 min, forming a homogeneous reddish-brown colloid. The resulting precipitate was collected after centrifuging the colloid. Finally, the precipitate was dried at 60 °C for 6 h. After grinding the dry precipitate, the bismuth–iron-based precursor powders were prepared and labeled as BFOH. With a similar synthesis process, precipitates were also obtained in the absence of FNO and BNO, respectively, and the two precipitates were labeled as BNO–KOH and FNO–KOH, respectively. In addition, the hydrolysate of BNO was also specifically obtained, and labeled as BNO–H2O.
2.3 Calcination of BFOH
To investigate the phase transition process, the precursor BFOH was calcinated at temperatures of 25, 200, 300, 400, 500, and 600 °C, respectively, for 3 h in the GSL-1600X/1400X double-temperature vacuum tube furnace. After cooling the furnace to room temperature and grinding the calcination products into powders, the final powders were collected and labeled as BFOH-x, where x refers to the calcination temperature.
2.4 Hydrothermal treatment of BFOH
First, the as-prepared BFOH precursor was dispersed in 3 M KOH aqueous solution. After vigorously stirring for 20 min, the precursor solution was transferred into a 100 ml teflon-lined stainless steel autoclave and maintained at 180 °C for 48 h. Afterwards, the autoclave was cooled to room temperature and the hydrothermal precipitate was collected by centrifugation. After washing several times with distilled water and absolute ethanol to remove impurities as much as possible, the precipitate was dried at 80 °C for 4 h to form the final product, denoted as BFO. With a similar synthesis process as for the preparation of BFOH, CTAB as surfactant was added into the reaction solution, which was used to tune the morphologies of the final products. After hydrothermal treatment, the resulting products were also obtained after centrifuging and washing and were labeled as BFOC-y, here y represents the amount (0.1, 0.3, and 0.5 g) of CTAB in the preparation. The synthesis conditions and parameters for all the samples are summarized in Table 1.
Table 1 Synthesis details for all precursors and their corresponding products
| Sample types |
Starting materials |
Synthesis conditions |
Labels |
| Precursors |
4 mmol BNO, 4 mmol FNO, deionized water, KOH (3 M) |
Room temperature, mixing dropwise, and stirring |
BFOH |
| 4 mmol BNO, deionized water, KOH (3 M) |
Room temperature, mixing dropwise, and stirring |
BNO–KOH |
| 4 mmol FNO, deionized water, KOH (3 M) |
Room temperature, mixing dropwise, and stirring |
FNO–KOH |
| 4 mmol BNO, deionized water |
Room temperature, mixing, and stirring |
BNO–H2O |
| Calcined products |
BFOH |
Calcined at 200 °C for 3 h |
BFOH-200 °C |
| Calcined at 300 °C for 3 h |
BFOH-300 °C |
| Calcined at 400 °C for 3 h |
BFOH-400 °C |
| Calcined at 500 °C for 3 h |
BFOH-500 °C |
| Calcined at 600 °C for 3 h |
BFOH-600 °C |
| Hydrothermal products |
4 mmol BNO, 4 mmol FNO, deionized water, KOH (3 M) |
Hydrothermal treatment at 180 °C for 48 h |
BFO |
| 4 mmol BNO, 4 mmol FNO, deionized water, KOH (3 M), CTAB |
Hydrothermal treatment at 180 °C for 48 h |
BFOC-0.1 g |
| BFOC-0.3 g |
| BFOC-0.5 g |
2.5 Characterization
Powder XRD patterns were collected at the XRD station of beamline 4B9A at the Beijing Synchrotron Radiation Facility (BSRF), with incident X-ray energy of 8050 eV (λ = 1.5402 Å). Raman spectra were also collected with a Raman spectrometer (HORIBA, LabRAM HR Evolution). FTIR spectra were recorded on a Bruker TENSOR27 instrument equipped with a quartz sample holder with KBr windows. The X-ray absorption spectra for the Bi L3-edge and Fe K-edge were measured at the X-ray absorption fine structure (XAFS) station of beamline 1W1B and the XRD station of beamline 4B9A of BSRF, respectively, in transmission mode. Scanning electron microscopy (SEM, HITACHI S-4800) and high-angle annular dark field scanning transmission electron microscopy (HAADF-STEM, FEI Titan G2 microscope, accelerating voltage: 300 kV, equipped with a probe spherical aberration corrector, enabling sub-angstrom imaging using HAADF-STEM detectors) were used to observe the morphologies of the samples. Thermogravimetric analysis (TGA) and differential scanning calorimetry (DSC) analysis were performed on a Mettler Toledo TGA/DSC1 STARe system. The samples were heated from ambient temperature to 1000 °C with a heating rate of 10 °C min−1 under N2 flow.
3. Results and discussion
3.1 Phase structures of precursors
To judge the structure of precursor BFOH in the preparation of BiFeO3, first the Raman and FTIR spectra of the four precursors BNO–KOH, BFOH, FNO–KOH, and BNO–H2O were collected, as shown in Fig. 1. It can be seen that the Raman spectral characteristics of BFOH are very similar to those of BNO–H2O and FNO–KOH within the Raman shift region from 224 to 430 cm−1. This result could imply that the Bi–O–Bi and Bi–OH bond vibrations,36 as in BNO–H2O, as well as the Fe–O–Fe and Fe–OH bonds vibrations,37 as in FNO–KOH, are combined and included in the BFOH precursor. Similarly, the Raman spectral characteristics of BFOH in the range 40–165 cm−1, as shown in Fig. 1(a), can also be attributed to a combination of the Bi–O bond vibrations36 in BNO–H2O and the Fe–O bond vibrations37 in FNO–KOH, and even the Bi–Bi bond vibrations38 in BNO–KOH. Several major absorption band features of the FTIR spectrum of the BFOH precursor are visible, as shown in Fig. 1(b). The feature at 538 cm−1 corresponds to the Bi–O vibrations39,40 of the BiO6 coordination polyhedron. However, the relatively wide feature near 538 cm−1 in BFOH seem to be a joint contribution of the 565 cm−1 feature in BNO–H2O and the 642 cm−1 feature in FNO–KOH. The features around 849, 1036, 1325, and 1487 cm−1 correspond to the symmetric and asymmetric stretching vibrations41–43 of the nitro group, with the two features at 849 and 1036 cm−1 also found in the FTIR spectra of FNO–KOH and BNO–H2O at the same position. The other two features, at 1325 and 1487 cm−1, confirm that BFOH is more similar to FNO–KOH than to BNO–H2O. The feature at 3356 cm−1 corresponds to the vibration mode of the water molecule44 or hydroxyl (–OH) group45 stretching vibrations. Similar features can be also found in the FTIR spectra of FNO–KOH and BNO–H2O. Generally, these Raman and FTIR spectra imply that the BFOH precursor has some similar vibration modes or molecular groups as the precursors FNO–KOH and BNO–H2O.
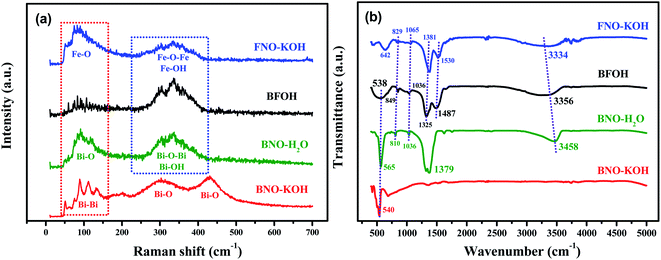 |
| | Fig. 1 (a) Raman spectra and (b) FTIR spectra of the four as-prepared precursors (BFOH, BNO–H2O, FNO–KOH, and BNO–KOH). | |
To further verify the composition and structure of the precursors, transmission XAFS spectra of the four precursors, BNO, and FNO were collected. The normalized Bi L3-edge XAFS spectra of BFOH, BNO–H2O, BNO–KOH, BNO and the normalized Fe K-edge XAFS spectra of BFOH, FNO–KOH, and FNO are shown in Fig. S1 (ESI†). The Fe K-edge XAFS spectrum of BFOH is almost the same as that for FNO–KOH. However, the Bi L3-edge XAFS spectrum of BFOH is not completely overlapping with that of BNO–KOH. This result means that the near-neighbor structures around the Fe center are almost the same in BFOH and FNO–KOH, but that the near-neighbor structures around the Bi center are different from those of BNO–KOH. To refine the fraction of each species, the linear combination fitting (LCF) method was used to quantify the species in the precursor BFOH performing the ATHENA program.46 Here, LCF was performed for the normalized XANES spectra over the range 13![[thin space (1/6-em)]](https://www.rsc.org/images/entities/char_2009.gif) 399 to 13
399 to 13![[thin space (1/6-em)]](https://www.rsc.org/images/entities/char_2009.gif) 519 eV (Bi L3-edge) or from 7092 to 7212 eV (Fe K-edge), respectively. In the fitting of the Bi L3-edge XANES spectrum, BNO–KOH, BNO–H2O, and BNO were used as the reference species. And, FNO–KOH and FNO were used as the reference species in the fitting of Fe K-edge XANES spectrum. The XANES components and the fitting results are shown in Fig. 2. From the Bi L3-edge spectrum, as shown in Fig. 2(a), the fitting components of BFOH are BNO–KOH (48.5%) and BNO–H2O (50.1%), as well as extremely small amounts of BNO (about 1.4%). From the Fe K-edge spectrum, as shown in Fig. 2(b), the fitting result indicates that BFOH contains only the species of FNO–KOH. These XANES results demonstrate that the main components in the precursor BFOH could be the species BNO–KOH, BNO–H2O and FNO–KOH, which is consistent with the results of Raman and FTIR.
519 eV (Bi L3-edge) or from 7092 to 7212 eV (Fe K-edge), respectively. In the fitting of the Bi L3-edge XANES spectrum, BNO–KOH, BNO–H2O, and BNO were used as the reference species. And, FNO–KOH and FNO were used as the reference species in the fitting of Fe K-edge XANES spectrum. The XANES components and the fitting results are shown in Fig. 2. From the Bi L3-edge spectrum, as shown in Fig. 2(a), the fitting components of BFOH are BNO–KOH (48.5%) and BNO–H2O (50.1%), as well as extremely small amounts of BNO (about 1.4%). From the Fe K-edge spectrum, as shown in Fig. 2(b), the fitting result indicates that BFOH contains only the species of FNO–KOH. These XANES results demonstrate that the main components in the precursor BFOH could be the species BNO–KOH, BNO–H2O and FNO–KOH, which is consistent with the results of Raman and FTIR.
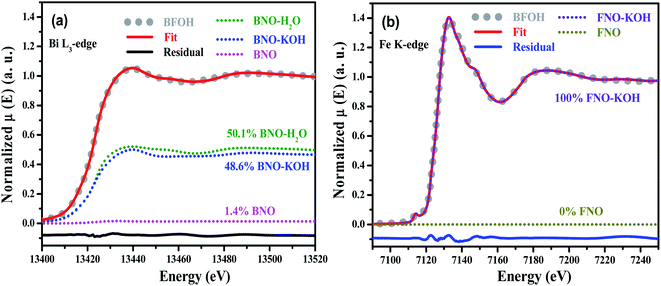 |
| | Fig. 2 Normalized LCF XANES spectra of (a) Bi L3-edge and (b) Fe K-edge for the precursor BFOH. The as-prepared BNO–H2O, BNO–KOH, and BNO were used as the standard species for the Bi L3-edge spectrum, and FNO–KOH and FNO were used as the standard species for the Fe K-edge spectrum. | |
Based on the Raman, FTIR, and XAFS results, the phase of precursor BFOH is still not completely determined. Therefore, the XRD technique was further used to analyze the phase content of the precursor BFOH. First, the XRD pattern of BNO–KOH is shown in Fig. 3(a), which can be attributed to a monoclinic bismite (Bi2O3) structure with space group P21/c as indicated by the PDF code 41-1449, where a = 5.850, b = 8.170, and c = 7.512 Å, α = γ = 90°, β = 112.977°. For comparison, the XRD pattern (Fig. S2, ESI†) of another purchased bismuth oxide (marked as Bi2O3-std) was also measured and can be attributed to the space group P![[4 with combining macron]](https://www.rsc.org/images/entities/char_0034_0304.gif) 21/c as indicated by the PDF code 27-0050, where a = 7.742, b = 7.742, and c = 5.631 Å, α = β = γ = 90°. Although both the precursor BNO–KOH and the purchased standard bismuth oxide sample have the same chemical formula (Bi2O3) and very similar molecule vibration modes (Fig. S3, ESI†), their crystal structures (Fig. S2, ESI†) and colors (Fig. S4, ESI†) are different. Actually, the precursor BNO–KOH and the purchased bismuth oxide are the so-called α-Bi2O3 (ref. 47) and β-Bi2O3,48 respectively. Therefore, the following reaction occurred as KOH was added dropwise into the BNO aqueous solution:
21/c as indicated by the PDF code 27-0050, where a = 7.742, b = 7.742, and c = 5.631 Å, α = β = γ = 90°. Although both the precursor BNO–KOH and the purchased standard bismuth oxide sample have the same chemical formula (Bi2O3) and very similar molecule vibration modes (Fig. S3, ESI†), their crystal structures (Fig. S2, ESI†) and colors (Fig. S4, ESI†) are different. Actually, the precursor BNO–KOH and the purchased bismuth oxide are the so-called α-Bi2O3 (ref. 47) and β-Bi2O3,48 respectively. Therefore, the following reaction occurred as KOH was added dropwise into the BNO aqueous solution:
| | |
2Bi(NO3)3·5H2O + 6KOH + H2O → α-Bi2O3↓ + 6KNO3 + 14H2O
| (1) |
Here, the reaction precipitate between BNO and KOH is α-Bi
2O
3, instead of Bi(OH)
3, as previously reported in the literature.
49
 |
| | Fig. 3 XRD patterns of the as-prepared precursors (a) BNO–KOH and (b) BNO–H2O. The relevant XRD patterns of α-Bi2O3, Bi6O5(NO3)5(OH)3·3H2O and Bi6O6(NO3)4(OH)2·2H2O are also presented. | |
Second, the XRD pattern of BNO–H2O is shown in Fig. 3(b). It is well known that bismuth nitrate (BNO)50,51 is easy to hydrolyze after dissolving it in distilled water, which seriously impedes the synthesis of pure BiFeO3 and the monodispersity of the product particles. In our previous work, monodisperse and pure bismuth nanoparticles (Bi NPs)52 were successfully prepared by dissolving BNO in ethylene glycol (EG). Although distilled water is still the best solvent in the synthesis of BiFeO3, the phase structure of the BNO hydrolysate (BNO–H2O) puzzles many researchers. X. Wang9 and Q. Wang53 et al. reported that bismuth subnitrate (BiONO3) can be prepared by dispersing BNO in distilled water, based on the following reaction:
| | |
2Bi(NO3)3·5H2O → 2BiONO3↓ + 4HNO3 + 8H2O.
| (2) |
Y. He et al. reported54 that the hydrolysate of BNO is Bi6O5(NO3)5(OH)3·3H2O, according to the following hydrolysis equation:
| | |
6Bi(NO3)3·5H2O → Bi6O5(NO3)5(OH)3·3H2O↓ + 13HNO3 + 19H2O.
| (3) |
In this work, the hydrolysate of BNO (BNO–H2O powder) was also prepared. Evidently, its powder color (Fig. S5, ESI†), XRD pattern (Fig. S6(a), ESI†), and molecular vibration (Fig. S6(b), ESI†) are different from the starting material BNO. By carefully comparing its XRD pattern with some known species and structures, it can be determined that the precursor BNO–H2O can be attributed to a mixture consisting of Bi6O6(NO3)4(OH)2·2H2O (PDF code 28-0654) and Bi6O5(NO3)5(OH)3·3H2O (PDF code 48-0575) as shown in Fig. 3(b). A possible reaction process to form the mixture phases can be described as below:
| | |
12Bi(NO3)3·5H2O → Bi6O6(NO3)4(OH)2·2H2O + Bi6O5(NO3)5(OH)3·3H2O + 27HNO3 + 39H2O.
| (4) |
To figure out the species and structure of the precursor BFOH, XRD patterns of the four precursors BFOH, BNO–KOH, FNO–KOH, and BNO–H2O are compared in Fig. 4. Obviously, there is an amorphous bulge located at 20–40° on the XRD pattern of the precursor BFOH, and some sharp diffraction peaks superimposed on the amorphous background. For each diffraction peak of BFOH, a corresponding diffraction peak can always be found from the three XRD patterns of BNO–KOH, FNO–KOH, and BNO–H2O. This result implies that the precursor BFOH is a mixture containing these precursors of BNO–KOH, FNO–KOH and BNO–H2O. The color changes of the BFOH, BNO–KOH, FNO–KOH, and BNO–H2O powders (Fig. S7, ESI†) also support this result. We note that the diffraction intensity for FNO–KOH is relatively weak. Several weak diffraction peaks in the XRD pattern of FNO–KOH mean that most of the precursor FNO–KOH forms noncrystalline ferrite and a small fraction forms a crystalline phase. The reflection at 23.5° in the XRD pattern of FNO–KOH can only be attributed to diffraction from crystalline Fe(OH)3 (PDF code 46-1436 (Fig. S8, ESI†)). Previous research21 claimed that the precursor FNO–KOH was amorphous Fe(OH)3, but in this work at least some precipitates of Fe(OH)3 were crystalline. The formation of Fe(OH)3 in the solution reaction can be described as follows:
| | |
Fe(NO3)3·9H2O + 3KOH → Fe(OH)3↓ + 3KNO3 + 9H2O.
| (5) |
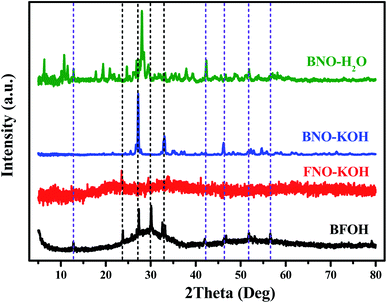 |
| | Fig. 4 XRD patterns of the four as-prepared precursors (BFOH, FNO–KOH, BNO–KOH, and BNO–H2O). | |
On the basis of the above discussion, it can be concluded that the amorphous bulge on the XRD pattern of BFOH may come from the amorphous component of FNO–KOH. The precursor BFOH may be a mixture containing the amorphous component, Fe(OH)3, and α-Bi2O3, Bi6O6(NO3)4(OH)2·2H2O, and Bi6O5(NO3)5(OH)3·3H2O.
3.2 Calcination of BFOH
To investigate the changes of structure and phase, the precursor BFOH was further calcined at different temperatures from 25 to 600 °C. The calcined samples are marked as BFOH-x, where x denotes the calcined temperature. Their XRD patterns and FTIR spectra were collected as shown in Fig. 5(a) and (b), respectively. Comparatively speaking, the first three samples (BFOH, BFOH-200 °C, and BFOH-300 °C) have negligible diffraction intensities compared with the other samples. Obviously, the noncrystalline phase is the main component of the first three samples. When the calcined temperature was 400 °C, significant diffraction peaks can be observed from the corresponding XRD pattern (BFOH-400 °C) and can be indexed as a hexagonal BiFeO3 phase with space group R3c, as indicated by JCPDS card no. 86-1518, where a = b = 5.587 Å, c = 13.867 Å, α = β = 90°, γ = 120°. The formation of BiFeO3 can be described by the following reaction:| | |
α-Bi2O3 + 2Fe(OH)3 → 2BiFeO3 + 3H2O.
| (6) |
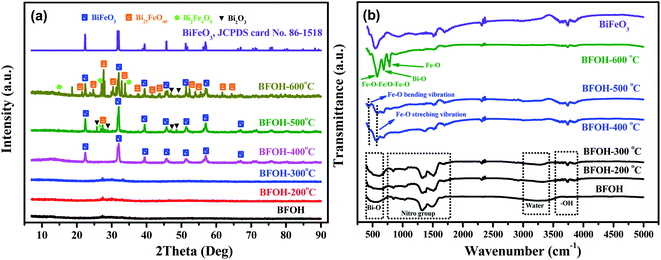 |
| | Fig. 5 XRD patterns (a) and FTIR spectra (b) of the as-prepared samples BFOH, BFOH-200 °C, BFOH-300 °C, BFOH-400 °C, BFOH-500 °C, and BFOH-600 °C. | |
When the calcined temperature was further increased to 500 °C, the diffraction intensities of the hexagonal BiFeO3 phase increased further, and several other weak peaks emerged at the same time. The diffraction-intensity enhancement of the hexagonal phase means that the BFOH-500 °C sample has better crystallinity and larger particle size for the BiFeO3 phase than the BFOH-400 °C sample. These newly formed weak peaks can be ascribed to the diffraction of Bi2O3, Bi25FeO40, and Bi2Fe4O9. This result demonstrates that a few impurity phases appear in the sample with grain growth of BiFeO3 hexagonal phase. When the calcined temperature rose further to 600 °C, the diffraction intensity of the BiFeO3 hexagonal phase was almost unchanged, but those of the impurity phases Bi2O3, Bi25FeO40, and Bi2Fe4O9 clearly increased. In fact, the components of Bi6O6(NO3)4(OH)2·2H2O and Bi6O5(NO3)5(OH)3·3H2O in the precursor BFOH have been decomposed at calcined temperature of 500–600 °C as follows:
| | |
Bi6O6(NO3)4(OH)2·2H2O + O2 → 3Bi2O3 + 3H2O + 2N2O5.
| (7) |
| | |
2Bi6O5(NO3)5(OH)3·3H2O → 6Bi2O3 + 9H2O + 5N2O5.
| (8) |
| | |
26Bi2O3 + 6Fe(OH)3 → 2Bi25FeO40 + Bi2Fe4O9 + 9H2O.
| (9) |
It is the reactions in eqn (7)–(9) that lead the appearance of the impurity phases Bi2O3, Bi25FeO40, and Bi2Fe4O9.
The FTIR spectra of the calcined samples are shown in Fig. 5(b). Similarly, the first three calcined samples (BFOH, BFOH-200 °C, and BFOH-300 °C) have almost the same spectral features, which can be ascribed to vibrations of the Bi–O bond39,40 (not Fe–O55), nitro group,41–43 water molecule,44 and hydroxyl group.45 The main differences between the three samples focus on that fact the vibration of the water molecules fades away, while the vibration of the hydroxyl group gradually increases with increase in calcination temperature. This result means that water in the sample was gradually evaporated and the amorphous component was gradually crystallized. As the calcined temperature increased to 400 and 500 °C, FTIR spectral features of the two samples were already very similar to those55 of BiFeO3. The appearance of Fe–O stretching vibration modes and O–Fe–O and Fe–O–Fe bending vibration modes corresponds to the formation55 of the BiFeO3 phase, in which the bending vibration modes come from the tetrahedral sites.56,57 Because of the increase in content of the impurity phases Bi2O3, Bi25FeO40, and Bi2Fe4O9 at the calcined temperature of 600 °C, the FTIR spectrum of BFOH-600 °C differs slightly from those of BFOH-400 °C and BFOH-500 °C.
To further confirm the structures and morphologies of the calcination samples BFOH-400 °C and BFOH-500 °C, SEM, TEM, and high-resolution TEM (HRTEM) images were recorded and are shown in Fig. 6. The SEM images indicate that both samples have a morphology of particle agglomeration. However, the particle shape for BFOH-400 °C is irregular and the particle size is small (Fig. 6(a)), while the particle shape for BFOH-500 °C is approximately orthogonal hexahedron and the particle size is large (Fig. 6(d)). TEM images further identified these particle shapes, as well as the particle sizes. It was the increase in calcination temperature from 400 to 500 °C that improved the growth rate58,59,61 and activated growth60 of BiFeO3 particles, resulting in the particle size increasing from 50 nm (Fig. 6(b)) to 100 nm (Fig. 6(e)). The HRTEM images of BFOH-400 °C and BFOH-500 °C are shown in Fig. 6(c) and (f). The clear lattice fringes illustrate the crystallization characteristics of the two samples. In particular, the orthogonal fringes in Fig. 6(f) show clearly the (100)c crystal plane characteristics of the BiFeO3 pseudo-cubic phase, or the projection characteristics along the [42![[1 with combining macron]](https://www.rsc.org/images/entities/char_0031_0304.gif) ]h direction of the BiFeO3 hexagonal phase, as confirmed by the inset in Fig. 6(f). The fringe spacings of 0.279 or 0.397 nm correspond to the d-spacing of the (110) or (012) planes in crystalline BiFeO3, which again confirms that the dominant crystalline phase is the BiFeO3 nanocrystals in the BFOH-400 °C and BFOH-500 °C samples.
]h direction of the BiFeO3 hexagonal phase, as confirmed by the inset in Fig. 6(f). The fringe spacings of 0.279 or 0.397 nm correspond to the d-spacing of the (110) or (012) planes in crystalline BiFeO3, which again confirms that the dominant crystalline phase is the BiFeO3 nanocrystals in the BFOH-400 °C and BFOH-500 °C samples.
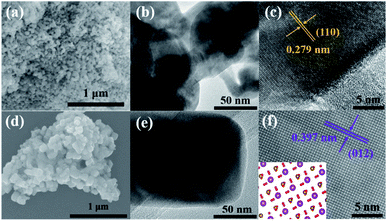 |
| | Fig. 6 SEM (a and d), TEM (b and e), and HRTEM (c and f) images of the calcination samples BFOH-400 °C (a–c) and BFOH-500 °C (d–f). | |
The element types and distributions in the samples BFOH-400 °C and BFOH-500 °C were also recorded, as shown in the mapping pictures (Fig. S9, ESI†). The results demonstrate that the three elements (Bi, Fe, O) distributed homogeneously in the two samples BFOH-400 °C and BFOH-500 °C. In addition, the thermostability of the BFOH-400 °C sample (crystalline BiFeO3 phase) was also examined by thermal analysis. Fig. 7(a) shows the DSC curve of the BFOH-400 °C sample, where only two endothermic features are distinguishable. The endothermic peak8 around 828 °C was claimed to correspond to the phase transformation from ferroelectric to paraelectric, with the endothermic peak31,62 at 957 °C corresponding to the melting point of BiFeO3. These results excluded the possibility of thermal decomposition of BiFeO3 in the temperature range of 500–600 °C. Thermal analysis was also performed for the as-prepared BFOH precursor and the corresponding TGA/DSC curves are shown in Fig. 7(b). It can be seen that the BFOH precursor experiences a significant loss of mass from room temperature to 400 °C. Afterwards, the mass loss of the sample is negligible. In this work, the calcination temperature of 400 °C is a key point to form the BiFeO3 phase. On the whole, there are no mutational and remarkable endothermic or exothermic reactions occurring below 900 °C. Several weak endothermic peaks can be found around 459 °C, 665 °C, and 708 °C. The weak endothermic peak at 459 °C could correspond to the decomposition of the two mesophases Bi6O6(NO3)4(OH)2·2H2O and Bi6O5(NO3)5(OH)3·3H2O in the precursor BFOH. The origin of the other two endothermic peaks, at 665 °C and 708 °C, are still unclear. Generally, the calcination process has hardly any influence on the precursor BFOH when the calcined temperature is lower than 300 °C. At 400 °C, only the BiFeO3 crystalline phase can be formed. Impurity phases Bi2O3, Bi25FeO40, and Bi2Fe4O9 appear at higher calcination temperatures (500–600 °C).
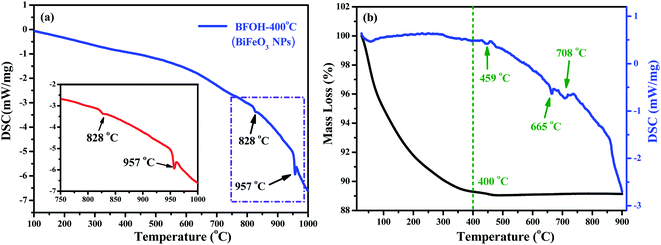 |
| | Fig. 7 (a) DSC curve of the BFOH-400 °C powder. Inset shows the enlarged view of the selected area. (b) TGA/DSC curves of the as-prepared BFOH precursor. | |
3.3 Hydrothermal synthesis optimization
To optimize the hydrothermal synthesis process of BiFeO3, a series of reaction conditions, such as reaction time, type, and amount of surfactant, and concentration of KOH (as mineralizer) have been investigated. All the hydrothermal synthesis details are listed in Table 2. The hydrothermal reaction temperature was chosen as 180 °C, as in a typical hydrothermal synthesis14,24 of BiFeO3. Surfactants can be used to modify the morphology63 of nanoparticles and act as structure-directing reagents64 in forming BiFeO3 nanoparticles. In this study, the surfactants PVP, EDTA, and CTAB were compared for the optimum synthesis of BiFeO3. After a series of experimental explorations of the hydrothermal processes (Fig. S10–S12, ESI†), the optimal hydrothermal conditions to synthesize pure BiFeO3 phase can be summarized as follows: the suitable reaction time is 48 h; the preferred surfactant is CTAB; and the necessary concentration of KOH is at least 3 M. The influence of the amount of CTAB on the morphology of the final products was also investigated. Fig. 8(a) shows the XRD patterns of three samples (BFOC-0.1 g, BFOC-0.3 g, and BFOC-0.5 g) with different amounts of CTAB. The three XRD patterns can all be indexed as a pure BiFeO3 phase. The main difference is that the intensities of the (012) and (104) reflections increase with increasing amount of CTAB, as shown in Fig. 8(b). This result indicates that the [012] and [104] directions are the preferential growth directions of BiFeO3 grains in the presence of CTAB in the hydrothermal solution. Fig. 9 shows the SEM images of samples BFOC-0.1 g, BFOC-0.3 g, and BFOC-0.5 g ((a)–(c)), the TEM images of sheet-like and flat-cylindrical particles ((d)–(f)), and the HRTEM images of BFOC-0.1 g, BFOC-0.3 g, and BFOC-0.5 g ((g)–(i)), respectively. Obviously, the particles with low CTAB content (BFOC-0.1 g) are sheet-like. With the amount of CTAB increasing to 0.3 g, the particles (BFOC-0.3 g) are approximately flat-cylindrical. When the amount of CTAB increases to 0.5 g, these cylindrical particles (BFOC-0.5 g) grow further, especially in height. The sheet-like or flat-cylindrical shapes of the particles can be further confirmed by the TEM images.
Table 2 Synthesis details of the corresponding hydrothermal products
| Starting materials |
Synthesis conditions |
Labels |
| 4 mmol BNO, 4 mmol FNO, deionized water, KOH (3 M) |
Hydrothermal treatment at 180 °C for 24 h |
BFO-24 h |
| Hydrothermal treatment at 180 °C for 48 h |
BFO-48 h |
| Hydrothermal treatment at 180 °C for 72 h |
BFO-72 h |
| 4 mmol BNO, 4 mmol FNO, deionized water, KOH (3 M), 0.5 g PVP |
Hydrothermal treatment at 180 °C for 48 h |
BFO–PVP |
| 4 mmol BNO, 4 mmol FNO, deionized water, KOH (3 M), 0.5 g EDTA |
Hydrothermal treatment at 180 °C for 48 h |
BFO–EDTA |
| 4 mmol BNO, 4 mmol FNO, deionized water, KOH (3 M), 0.5 g CTAB |
Hydrothermal treatment at 180 °C for 48 h |
BFO–CTAB |
| 4 mmol BNO, 4 mmol FNO, deionized water, KOH (1 M) |
Hydrothermal treatment at 180 °C for 48 h |
BFO-1 M |
| 4 mmol BNO, 4 mmol FNO, deionized water, KOH (2 M) |
Hydrothermal treatment at 180 °C for 48 h |
BFO-2 M |
| 4 mmol BNO, 4 mmol FNO, deionized water, KOH (3 M) |
Hydrothermal treatment at 180 °C for 48 h |
BFO-3 M |
| 4 mmol BNO, 4 mmol FNO, deionized water, KOH (4 M) |
Hydrothermal treatment at 180 °C for 48 h |
BFO-4 M |
| 4 mmol BNO, 4 mmol FNO, deionized water, KOH (5 M) |
Hydrothermal treatment at 180 °C for 48 h |
BFO-5 M |
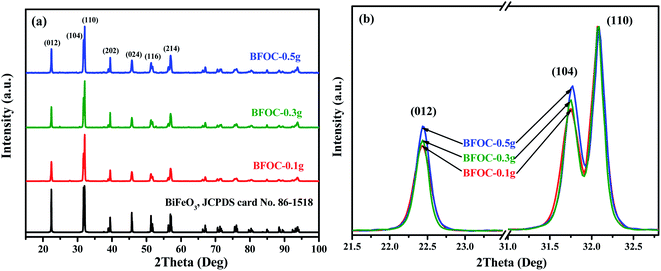 |
| | Fig. 8 (a) XRD patterns of the as-prepared BFOC-0.1 g, BFOC-0.3 g, and BFOC-0.5 g. (b) Diffraction peak comparison of (012) and (104) reflections. | |
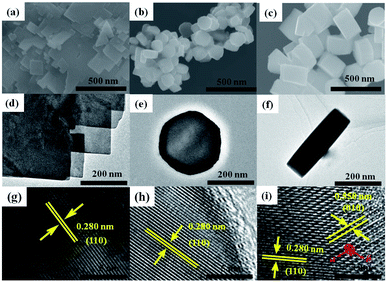 |
| | Fig. 9 SEM images of the as-prepared samples (a) BFOC-0.1 g, (b) BFOC-0.3 g, and (c) BFOC-0.5 g. TEM images of (d) sheet-like particles as well as (e) bottom view and (f) side view of flat-cylindrical particles. HRTEM images of samples (g) BFOC-0.1 g, (h) BFOC-0.3 g, and (i) BFOC-0.5 g. | |
To acquire more structural details, HRTEM images of the three samples are also shown in Fig. 9(g)–(i). In all three HRTEM images, the lattice fringes with spacing of about 0.28 nm are always visible, which corresponds to the spacing of the (110) planes in the BiFeO3 crystal. This result implies that the surface of the sheet-like particles, or the top and bottom surfaces of the flat-cylindrical particles, are the (001) plane. Indeed, an increase in the thickness of the flat-cylindrical particles relative to the sheet-like particles implies an increase in the number of (001) planes. It is the increment in particle thickness along the [001] direction that results in the increase in the number of (012) and (104) planes and enhancement of the (012) and (104) reflections. While the relative change in diameter of the flat-cylindrical particles is small. This means that the efficient volume for the (110) reflection is almost unchanged. Therefore, the intensity of the (110) reflection does not show an obvious change, as in Fig. 8(b). A set of fringes with spacing of about 0.55 nm can also be observed, as shown in Fig. 9(i). The 0.55 nm spacing corresponds to interplanar spacing of the (100) or (010) planes in the BiFeO3 crystal. By carefully observing the HRTEM image in Fig. 9(i), a hexagonal atomic arrangement is distinguishable. This result again confirms that the fringes with spacings of 0.28 nm and 0.55 nm are from the (110) and (010) planes, respectively, of the BiFeO3 crystal. All of these findings identify that the exposed plane of the sheet-like particles, or the top and bottom surfaces of the flat-cylindrical particles, are the (001) plane of the BiFeO3 crystal, whereas previous work64 suggested that the exposed surface of BiFeO3 flat plates, which resembled hexagons, was the (104) facet.
Based on the above XRD, SEM and TEM results, it can be concluded that CTAB plays a regulating role in the aggregation and growth of BiFeO3 NPs. When the amount of CTAB added into the hydrothermal solution was low, the influence of CTAB on the growth of BiFeO3 particles was less. In this case, the BiFeO3 particles had a sheet-like shape. As the amount of CTAB added to the hydrothermal solution increased, more CTAB molecules were absorbed onto the side faces of the hexagonal BiFeO3 crystallite than onto the upper and lower surfaces, or the (001) plane. In this case, the higher coverage of CTAB molecules on the side faces of the BiFeO3 crystallites further prevented or postponed crystal growth along the normal directions of the side faces. In other words, the [001] direction was a relatively easier growth direction, which meant that the BiFeO3 flat-cylindrical particles grew faster in the direction of height than in the radial direction. The increase of the crystallite thickness along the [001] direction also increased the number of other (hkl) crystal planes with l ≠ 0. As a result, the (012) and (104) planes exhibit more intense XRD peaks with increase in the amount of CTAB.
3.4 Method comparison of synthesized BiFeO3
In this work, calcination (CC) and hydrothermal (HT) methods have been used to synthesize bismuth ferrite. Both methods were optimized to synthesize pure hexagonal BiFeO3 phase. The sample prepared by the calcination method is indicated as BFO-400 °C, while the sample prepared by the hydrothermal method is indicated as BFO. XRD, FTIR, and XAFS data for the two samples were collected for comparison. The XRD patterns shown in Fig. 10(a) verify that BFO and BFO-400 °C can be attributed to pure hexagonal BiFeO3 phases. The GSAS program65 was used to perform Rietveld refinement of the lattice parameters. For BFO-400 °C, aCC = bCC = 5.577 Å, cCC = 13.831 Å and for BFO, aHT = bHT = 5.581 Å, cHT = 13.867 Å. The unit cell is slightly smaller in BFO-400 °C than in BFO. FTIR spectra of the two samples are shown in Fig. 10(b). The bond vibrations of for Fe–O, Bi–O, nitro groups, and hydroxyl are almost the same for both BFO-400 °C and BFO. In addition, the Bi L3-edge and Fe K-edge XAFS spectra of the two BiFeO3 products are compared in Fig. 10(c) (also in Fig. S13, ESI†). The results demonstrate that the X-ray absorption curves of BFO-400 °C and BFO are almost overlapped, not only for the Bi L3-edge, but also for the Fe K-edge, which implies that the two samples have very similar atomic neighbor structures. Further XAFS fittings, as shown in Fig. 10(d), verify that the near-neighbor structural parameters (Table S1, ESI†) are almost the same in both BFO-400 °C and BFO. These results demonstrate that the final BiFeO3 products prepared by the calcination method or by hydrothermal synthesis have no obvious differences from the microstructural point of view.
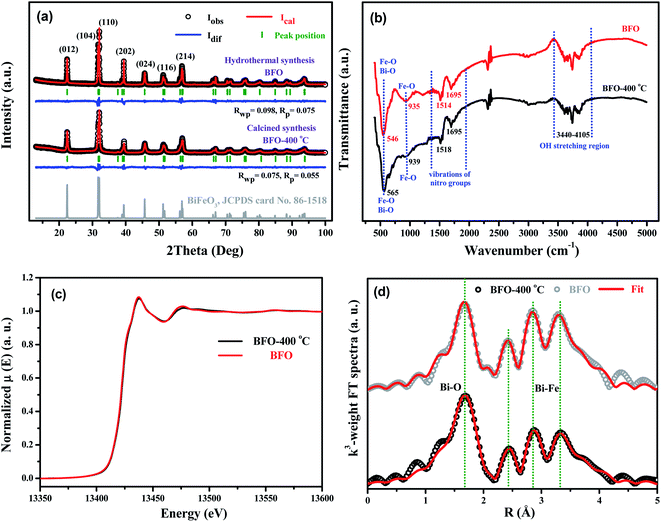 |
| | Fig. 10 (a) XRD patterns, (b) FTIR spectra, (c) Bi L3-edgeXAFS spectra and (d) FT spectra of EXAFS oscillations k3χ (k) for BFO-400 °C and BFO. | |
4. Conclusion
In summary, the bismuth–iron-based precursor BFOH and other related precursors have been prepared. The precursor BFOH has been determined to be a mixture composed of Bi6O6(NO3)4(OH)2·2H2O, Bi6O5(NO3)5(OH)3·3H2O, α-Bi2O3, and Fe(OH)3. As a precursor to synthesize BiFeO3, the transformation of BFOH to BiFeO3 was further studied under calcination treatment and hydrothermal synthesis. The mechanism of synthesizing the BiFeO3 phase has been proposed and discussed, and the synthetic conditions optimized. The optimal calcination temperature to synthesize BiFeO3 from the precursor BFOH is 400 °C. The optimal hydrothermal conditions include: a reaction time of 48 h, a preferred surfactant of CTAB, a hydrothermal temperature of 180 °C, and a concentration of KOH of at least 3 M. The two, as-prepared BiFeO3 NPs prepared by calcination or hydrothermal synthesis have no notable differences from the point of view of microstructures.
Conflicts of interest
The authors declare no competing financial interest.
Acknowledgements
This work was supported by the National Key R&D Program of China (Grant No. 2017YFA0403000, and 2017YFA0403100) and the National Natural Science Foundation (No. U1232203) of China.
References
- R. Safi and H. Shokrollahi, Prog. Solid State Chem., 2012, 40, 6–15 CrossRef CAS.
- H. Schmid, Ferroelectrics, 1994, 162, 317–338 CrossRef.
- G. Catalan and J. F. Scott, Adv. Mater., 2009, 21, 2463–2485 CrossRef CAS.
- M. S. Bernardo, Bol. Soc. Esp. Ceram., 2014, 45, 1–14 Search PubMed.
- T. Zhao, A. Scholl, F. Zavaliche, K. Lee, M. Barry, A. Doran, M. P. Cruz, Y. H. Chu, C. Ederer and N. A. Spaldin, Nat. Mater., 2006, 5, 823–829 CrossRef CAS PubMed.
- W. Prellier, M. P. Singh and P. Murugavel, ChemInform, 2006, 37, R803 CrossRef.
- D. Lebeugle, D. Colson, A. Forget, M. Viret, P. Bonville, J. F. Marucco and S. Fusil, Phys. Rev. B: Condens. Matter Mater. Phys., 2007, 76, 024116 CrossRef.
- D. Yan, C. Sun, J. Jian, Y. Sun, R. Wu and J. Li, J. Mater. Sci.: Mater. Electron., 2014, 25, 928–935 CrossRef CAS.
- X. Wang, W. Mao, Q. Zhang, Q. Wang, Y. Zhu, J. Zhang, T. Yang, J. Yang, X. a. Li and W. Huang, J. Alloys Compd., 2016, 677, 288–293 CrossRef CAS.
- L. Zhang, X. F. Cao, Y. L. Ma, X. T. Chen and Z. L. Xue, J. Solid State Chem., 2010, 183, 1761–1766 CrossRef CAS.
- J. P. Zhou, R. J. Xiao, Y. X. Zhang, Z. Shi and G. Q. Zhu, J. Mater. Chem. C, 2015, 3, 6924–6931 RSC.
- S. Li, R. Nechache, C. Harnagea, L. Nikolova and F. Rosei, Appl. Phys. Lett., 2012, 101, 192903 CrossRef.
- S. Li, J. Zhang, M. G. Kibria, Z. Mi, M. Chaker, D. Ma, R. Nechache and F. Rosei, Chem. Commun., 2013, 49, 5856 RSC.
- B. Liu, B. Hu and Z. Du, Chem. Commun., 2011, 47, 8166–8168 RSC.
- J. Varghese, R. W. Whatmore and J. D. Holmes, J. Mater. Chem. C, 2013, 1, 2618 RSC.
- X. Gang, Y. Yang, H. Bai, J. Wang, T. He, R. Zhao, W. Xiao, Y. Xin and G. Han, CrystEngComm, 2016, 18, 2268–2274 RSC.
- L. Xiaomeng, X. Jimin, S. Yuanzhi and L. Jiamin, J. Mater. Sci., 2007, 42, 6824–6827 CrossRef.
- A. Chaudhuri, S. Mitra, M. Mandal and K. Mandal, J. Alloys Compd., 2010, 491, 703–706 CrossRef CAS.
- Z. Chen, W. Jin, Z. Lu and C. Hu, J. Mater. Sci.: Mater. Electron., 2014, 26, 1077–1086 CrossRef.
- T. Gao, Z. Chen, F. Niu, D. Zhou, Q. Huang, Y. Zhu, L. Qin, X. Sun and Y. Huang, J. Alloys Compd., 2015, 648, 564–570 CrossRef CAS.
- S. H. Han, K. S. Kim, H. G. Kim, H. G. Lee, H. W. Kang, J. S. Kim and C. I. Cheon, Ceram. Int., 2010, 36, 1365–1372 CrossRef CAS.
- L. Hou, K. H. Zuo, Q. B. Sun, Z. M. Ren, Y. P. Zeng and X. Li, Appl. Phys. Lett., 2013, 102, 082901 CrossRef.
- Z. C. Qiu, J. P. Zhou, G. Zhu, X. M. Chen, R. L. Yang and Y. H. Song, J. Nanosci. Nanotechnol., 2012, 12, 6552–6557 CrossRef CAS PubMed.
- C. Y. Song, J. Xu, A. Yimamu and L. Wang, Integr. Ferroelectr., 2014, 153, 33–41 CrossRef CAS.
- D. R. Modeshia and R. I. Walton, Chem. Soc. Rev., 2010, 39, 4303 RSC.
- Y. Wang, G. Xu, L. Yang, Z. Ren, X. Wei, W. Weng, P. Du, G. Shen and G. Han, J. Am. Ceram. Soc., 2007, 90, 3673–3675 CrossRef CAS.
- X. Yang, G. Xu, Z. Ren, X. Wei, C. Chao, S. Gong, G. Shen and G. Han, CrystEngComm, 2014, 16, 4176–4182 RSC.
- R. V. Annapu, N. P. Pathak and R. Nath, J. Alloys Compd., 2012, 543, 206–212 CrossRef.
- N. Das, R. Majumdar, A. Sen and H. S. Maiti, Mater. Lett., 2007, 61, 2100–2104 CrossRef CAS.
- H. Ke, W. Wang, Y. Wang, J. Xu, D. Jia, Z. Lu and Y. Zhou, J. Alloys Compd., 2011, 509, 2192–2197 CrossRef CAS.
- M. Y. Shami, M. S. Awan and R. M. Anis, J. Alloys Compd., 2011, 509, 10139–10144 CrossRef CAS.
- H. Shokrollahi, Powder Technol., 2013, 235, 953–958 CrossRef CAS.
- S. Ghosh, S. Dasgupta, A. Sen and H. S. Maiti, Mater. Res. Bull., 2005, 40, 2073–2079 CrossRef CAS.
- N. A. Lomanova and V. V. Gusarov, Nanosyst.: Phys., Chem., Math., 2013, 4, 696–705 CAS.
- C. Paraschiv, B. Jurca, A. Ianculescu and O. Carp, J. Therm. Anal. Calorim., 2008, 94, 411–416 CrossRef CAS.
- J. Pang, Q. Han, W. Liu, Z. Shen, X. Wang and J. Zhu, Appl. Surf. Sci., 2017, 422, 283–294 CrossRef CAS.
- G. Backes, M. Sahlin, B. M. Sjöberg, T. M. Loehr and J. S. Loehr, Biochemistry, 1989, 28, 1923 CrossRef CAS PubMed.
- V. Vivier, A. Régis, G. Sagon, J. Y. Nedelec, L. T. Yu and C. C. Vivier, Electrochim. Acta, 2002, 46, 907–914 CrossRef.
- Z. Ai, Y. Huang, S. Lee and L. Zhang, J. Alloys Compd., 2011, 509, 2044–2049 CrossRef CAS.
- L. Liu, J. Jiang, S. Jin, Z. Xia and M. Tang, CrystEngComm, 2011, 13, 2529 RSC.
- J. Laane and J. R. Ohlsen, Prog. Inorg. Chem., 1986, 28, 465–509 Search PubMed.
- I. L. Schneider, E. C. Teixeira, D. M. A. Castaneda, E. S. G. Silva, N. Balzaretti, M. F. Braga and L. F. S. Oliveira, Sci. Total Environ., 2016, 541, 1151–1160 CrossRef CAS PubMed.
- S. Ghosh, S. Dasgupta, A. Sen and H. Sekhar Maiti, J. Am. Ceram. Soc., 2005, 88, 1349–1352 CrossRef CAS.
- C. Wang, Q. Liu and Z. Li, Cryst. Res. Technol., 2011, 46, 655–658 CrossRef CAS.
- R. Kefirov, E. Ivanova, K. Hadjiivanov, S. Dzwigaj and M. Che, Catal. Lett., 2008, 125, 209–214 CrossRef CAS.
- B. Ravel and M. Newville, J. Synchrotron Radiat., 2005, 12, 537–541 CrossRef CAS PubMed.
- H. A. Harwig, Z. Anorg. Allg. Chem., 1978, 444, 151–166 CrossRef CAS.
- S. K. Blower and C. Greaves, Acta Crystallogr., 2014, 44, 587–589 Search PubMed.
- J. Wei, C. Zhang and Z. Xu, Mater. Res. Bull., 2012, 47, 3513–3517 CrossRef CAS.
- Y. Wu, Q. Han, L. Wang, X. Wang and J. Zhu, Mater. Chem. Phys., 2017, 187, 72–81 CrossRef CAS.
- Z. Chen and W. Jin, J. Mater. Sci.: Mater. Electron., 2014, 25, 4039–4045 CrossRef CAS.
- Y. Liu, L. Qian, X. Zhao, J. Wang, L. Yao, X. Xing, G. Mo, Q. Cai, Z. Chen and Z. Wu, CrystEngComm, 2019, 21, 2799–2808 RSC.
- Q. Wang, T. Hisatomi, Q. Jia, H. Tokudome, M. Zhong, C. Wang, Z. Pan, T. Takata, M. Nakabayashi, N. Shibata, Y. Li, I. D. Sharp, A. Kudo, T. Yamada and K. Domen, Nat. Mater., 2016, 15, 611–615 CrossRef CAS PubMed.
- Y. He, Y. Zhang, H. Huang, N. Tian and Y. Luo, Inorg. Chem. Commun., 2014, 40, 55–58 CrossRef CAS.
- V. Annapu Reddy, N. P. Pathak and R. Nath, J. Alloys Compd., 2012, 543, 206–212 CrossRef CAS.
- W. Ji, M. Li, G. Zhang and P. Wang, Dalton Trans., 2017, 46, 10586–10593 RSC.
- Y. Liu, R. Zuo and S. Qi, Powder Technol., 2014, 254, 30–35 CrossRef CAS.
- M. S. Bernardo, T. Jardiel, M. Peiteado, A. C. Caballero and M. Villegas, J. Eur. Ceram. Soc., 2011, 31, 3047–3053 CrossRef CAS.
- L. Wang, J. B. Xu, B. Gao, A. M. Chang, J. Chen, L. Bian and C. Y. Song, Mater. Res. Bull., 2013, 48, 383–388 CrossRef CAS.
- H. Yang, X. Zhang, W. Ao and G. Qiu, Mater. Res. Bull., 2004, 39, 833–837 CrossRef CAS.
- M. G. Scott, Amorphous Metallic Alloys, Butterworths, London, 1983 Search PubMed.
- S. M. Selbach, M. A. Einarsrud, T. Tybell and T. Grande, J. Am. Ceram. Soc., 2007, 90, 3430–3434 CrossRef CAS.
- J. Huang, G. Tan, W. Yang, L. Zhang, H. Ren and A. Xia, Mater. Sci. Semicond. Process., 2014, 25, 84–88 CrossRef CAS.
- X. Wang, W. Mao, Q. Zhang, Q. Wang, Y. Zhu, J. Zhang, T. Yang, J. Yang, X. Li and W. Huang, J. Alloys Compd., 2016, 677, 288–293 CrossRef CAS.
- B. H. Toby, J. Appl. Crystallogr., 2001, 34, 210–213 CrossRef CAS.
Footnote |
| † Electronic supplementary information (ESI) available. See DOI: 10.1039/d0ra00177e |
|
| This journal is © The Royal Society of Chemistry 2020 |
Click here to see how this site uses Cookies. View our privacy policy here.  Open Access Article
 ab,
Hao Wangab,
Lixiong Qianab,
Xiaoyi Zhaoab,
Lei Yaoa,
Jiayi Wanga,
Xueqing Xing
 a,
Guang Moa,
Zhongjun Chena and
Zhonghua Wu
 *ab
*ab

![[thin space (1/6-em)]](https://www.rsc.org/images/entities/char_2009.gif) 399 to 13
399 to 13![[thin space (1/6-em)]](https://www.rsc.org/images/entities/char_2009.gif) 519 eV (Bi L3-edge) or from 7092 to 7212 eV (Fe K-edge), respectively. In the fitting of the Bi L3-edge XANES spectrum, BNO–KOH, BNO–H2O, and BNO were used as the reference species. And, FNO–KOH and FNO were used as the reference species in the fitting of Fe K-edge XANES spectrum. The XANES components and the fitting results are shown in Fig. 2. From the Bi L3-edge spectrum, as shown in Fig. 2(a), the fitting components of BFOH are BNO–KOH (48.5%) and BNO–H2O (50.1%), as well as extremely small amounts of BNO (about 1.4%). From the Fe K-edge spectrum, as shown in Fig. 2(b), the fitting result indicates that BFOH contains only the species of FNO–KOH. These XANES results demonstrate that the main components in the precursor BFOH could be the species BNO–KOH, BNO–H2O and FNO–KOH, which is consistent with the results of Raman and FTIR.
519 eV (Bi L3-edge) or from 7092 to 7212 eV (Fe K-edge), respectively. In the fitting of the Bi L3-edge XANES spectrum, BNO–KOH, BNO–H2O, and BNO were used as the reference species. And, FNO–KOH and FNO were used as the reference species in the fitting of Fe K-edge XANES spectrum. The XANES components and the fitting results are shown in Fig. 2. From the Bi L3-edge spectrum, as shown in Fig. 2(a), the fitting components of BFOH are BNO–KOH (48.5%) and BNO–H2O (50.1%), as well as extremely small amounts of BNO (about 1.4%). From the Fe K-edge spectrum, as shown in Fig. 2(b), the fitting result indicates that BFOH contains only the species of FNO–KOH. These XANES results demonstrate that the main components in the precursor BFOH could be the species BNO–KOH, BNO–H2O and FNO–KOH, which is consistent with the results of Raman and FTIR.![[4 with combining macron]](https://www.rsc.org/images/entities/char_0034_0304.gif) 21/c as indicated by the PDF code 27-0050, where a = 7.742, b = 7.742, and c = 5.631 Å, α = β = γ = 90°. Although both the precursor BNO–KOH and the purchased standard bismuth oxide sample have the same chemical formula (Bi2O3) and very similar molecule vibration modes (Fig. S3, ESI†), their crystal structures (Fig. S2, ESI†) and colors (Fig. S4, ESI†) are different. Actually, the precursor BNO–KOH and the purchased bismuth oxide are the so-called α-Bi2O3 (ref. 47) and β-Bi2O3,48 respectively. Therefore, the following reaction occurred as KOH was added dropwise into the BNO aqueous solution:
21/c as indicated by the PDF code 27-0050, where a = 7.742, b = 7.742, and c = 5.631 Å, α = β = γ = 90°. Although both the precursor BNO–KOH and the purchased standard bismuth oxide sample have the same chemical formula (Bi2O3) and very similar molecule vibration modes (Fig. S3, ESI†), their crystal structures (Fig. S2, ESI†) and colors (Fig. S4, ESI†) are different. Actually, the precursor BNO–KOH and the purchased bismuth oxide are the so-called α-Bi2O3 (ref. 47) and β-Bi2O3,48 respectively. Therefore, the following reaction occurred as KOH was added dropwise into the BNO aqueous solution:

![[1 with combining macron]](https://www.rsc.org/images/entities/char_0031_0304.gif) ]h direction of the BiFeO3 hexagonal phase, as confirmed by the inset in Fig. 6(f). The fringe spacings of 0.279 or 0.397 nm correspond to the d-spacing of the (110) or (012) planes in crystalline BiFeO3, which again confirms that the dominant crystalline phase is the BiFeO3 nanocrystals in the BFOH-400 °C and BFOH-500 °C samples.
]h direction of the BiFeO3 hexagonal phase, as confirmed by the inset in Fig. 6(f). The fringe spacings of 0.279 or 0.397 nm correspond to the d-spacing of the (110) or (012) planes in crystalline BiFeO3, which again confirms that the dominant crystalline phase is the BiFeO3 nanocrystals in the BFOH-400 °C and BFOH-500 °C samples.


