 Open Access Article
Synthesis and microwave absorption properties of Fe@carbon fibers
Xuecong Zhanga,
Song Qi*ab,
Yi Zhaoc,
Lirui Wanga,
Jie Fua and
Miao Yu *a
*a
aKey Lab for Optoelectronic Technology and Systems, Ministry of Education, College of Optoelectronic Engineering, Chongqing University, Chongqing 400044, China. E-mail: qisong@cqu.edu.cn; yumiao@cqu.edu.cn
bPostdoctoral Station of Optical Engineering, College of Optoelectronic Engineering, Chongqing University, Chongqing 400044, China
cChongqing Academy of Metrology and Quality Inspection, Chongqing, 400020, China
First published on 2nd September 2020
Abstract
Composites of carbon and magnetic metal can overcome the eddy current effects and high density of traditional magnetic metals based on their synergistic loss mechanism and tunable electromagnetic properties. Herein, Fe@carbon fiber particles were synthesized by growing iron nanoflakes on the surface of carbon fibers via in situ reduction. The surface morphology, lattice structure and element composition of the synthesized Fe@carbon fibers were analyzed by scanning electron microscopy (SEM), X-ray diffraction (XRD) and energy disperse spectroscopy (EDS) respectively. Based on these qualitative analyses, a possible growth mechanism was proposed for guide production. In order to investigate their electromagnetic absorbing properties, electromagnetic parameters of Fe@carbon fibers-paraffin composites have been evaluated by coaxial reflection/transmission technique. The Fe@carbon fibers-paraffin composites containing different particle contents were prepared to clarify the optimum material ratio. The results showed that the composite loaded with 30 wt% carbon fibers@Fe particles exhibited the most prominent microwave absorption, with strong absorption (maximum reflection loss of −39.8 dB), effective absorption bandwidth (2.9 GHz) and small thickness (1.5 mm).
1. Introduction
With the progress of science and technology, a large number of electronic devices have been introduced to our daily life. The problem of electromagnetic radiation pollution has become more and more serious and has gradually become a new public hazard in our society. In particular, radiated electromagnetic waves can interfere with electromagnetically sensitive equipment, leading to misuse, signal delays, equipment failures, etc., which will undoubtedly pose a great threat to our economy and life safety.Microwave absorbing material (MAM) refers to a kind of material that can absorb and attenuate the electromagnetic waves by converting the energy of electromagnetic waves into heat or eliminating electromagnetic waves due to interference, thus it is an effective way to solve electromagnetic radiation pollution. Due to the expansion of the operating frequency of electronic systems and communication technologies in the gigahertz range, higher requirements are put forward for thin-thickness, light weight, wide absorption band and strong absorption capacity.1 Ferromagnetic particles and their alloys, as commonly used electromagnetic absorbing materials, presents distinct advantages of high frequency of Snoek's limit,2,3 high saturation magnetization,2,4 high relative permeability at radar wave frequency,2,5–8 and high Curie temperature (about 1131 °C).9,10 However, magnetic metal materials have the disadvantages of eddy current effect and high density, resulting in severely high-frequency magnetic permeability and not meeting light weight requirements. Meanwhile, the absorbing agent composed of a single material has a narrow absorbing band and weak absorption.
The multi-component cladding of the core–shell structure, especially the combination of nano-magnetic materials and carbon-based dielectric materials, is a good strategy to solve these problems. Among them, carbon fiber has the advantages of low density and excellent mechanical properties and attracts the attention of many researchers from the field of composite absorbing materials. Osouli-Bostanabad et al. plated Fe3O4 on the surface of carbon fibers by a multi-step cathode method. Fe3O4/CFs has the strongest RL of −10 dB at 12.27 GHz.11 Salimkhani et al. investigated magnetite (nano-Fe3O4) coated carbon fibers (MCCFs) composites by using the electrophoretic deposition (EPD) technique. And the strongest reflection loss (RL) of MCCFs was recognized to be −7.8 dB at 9.3 GHz for a layer containing 50 wt% MCCFs with 2 mm in thickness.12 Liu Y. et al. prepared Ni–Fe alloy coatings on carbon fiber surfaces by means of electroplating at 25 °C for 560 s. The reflectivity of Fe–Ni/CF composites is less than −5 dB over the range of 1.1–5.4 GHz. The reflectivity of Fe–Ni/CF composites is less than −10 dB over the range of 1.6–2.1 GHz. The lowest reflectivity of the Fe–Ni/CF composites is −14.7 dB at 2 GHz and the corresponding thickness is 3.3 mm.13 Zhang et al. prepared novel Fe-coated carbon fiber (Fe@CF) composites using metal organic chemical vapor deposition (MOCVD) for use as microwave absorbing materials. Compared with common CF, the Fe@CF composites have higher resistivity and magnetic loss, which gradually increase with increasing iron content. And at a Fe@CF weight fraction of 8%, the minimum reflection loss (RL) is −38 dB at 13.4 GHz and a corresponding thickness of 2.5 mm.14 Recent researches illustrate that the mixing of carbon fibers and magnetic particles and their alloys have excellent electromagnetic absorption properties with lightness. However, in order to be able to achieve engineering applications, the absorbing performance still needs to be further improved.
In this paper, a layer of iron nanoflakes is uniformly grown on carbon fibers by a simple chemical reaction. Compared with spherical/bulk structures, the nanoflake structure has a larger specific surface area and facilitates the scattering of electromagnetic waves, thereby increasing electromagnetic losses. The test results indicated that the Fe@CF particles not only can overcome the defect of large density of spherical magnetic particles, but also form a discontinuous network structure. It is beneficial to electromagnetic wave penetration composite materials, broad the absorption band and improve the reflection loss.
2. Experiment
2.1. Materials
The carbon fiber powder used in the experiment is polyacrylonitrile (PAN)-based carbon fiber powder with an approximate circular cross-sectional shape (average diameter: 7 μm; aspect ratio: 2![[thin space (1/6-em)]](https://www.rsc.org/images/entities/char_2009.gif) :
:![[thin space (1/6-em)]](https://www.rsc.org/images/entities/char_2009.gif) 1 to 7
1 to 7![[thin space (1/6-em)]](https://www.rsc.org/images/entities/char_2009.gif) :
:![[thin space (1/6-em)]](https://www.rsc.org/images/entities/char_2009.gif) 1; density: 1.75 g cm−3).
1; density: 1.75 g cm−3).
Fe2SO4·7H2O and NaBH4 are used as oxidant and reducing agent, which were purchased from Dongfanghuabo Chemical Co. Ltd., Chongqing, China. PVP is employed as the polymer activator to make Fe2+ coating more even on the carbon fiber surface, which is also supplied by Dongfanghuabo Company, Chongqing, China.
2.2. Preparation of CF@Fe composite
In situ reduction is a method of surface modification in which metal ions in solution are reduced to metal by simple redox reaction.Anodic reaction:
| R → Rn+ + ne |
Cathodic reaction:
| Mn+ + ne → M |
Specifically, the Fe@CF is synthesized by reducing Fe2+ into Fe on the surface of CF with excessive sodium borohydride in aqueous solution. First of all, 0.242 g CF is put into hydrochloric acid solution with a concentration of 0.01 mol L−1 to remove impurities. Meanwhile, 4.5396 g NaBH4 powder is dispersed in 200 ml deionized water to prepare an aqueous solution of sodium borohydride. Then, 2.78 g FeSO4·7H2O and 3.25 g polyvinylpyrrolidone (PVP) are dissolved in 200 ml deionized water, following stirred intensively for 1 hour. After the CF is washed repeatedly with deionized water, put the CF in the above mixture. Next, the NaBH4 solution is dropped slowly into the mixture containing CF. The reaction system keeps being gently stirred, and the temperature is maintained at 30 °C for 45 min. At last, the prepared product is washed by deionized water and absolute ethanol many a time. Finally, the dispersed Fe@CF particles are obtained after vacuum drying and grinding.
2.3. Characterization
The scanning electron microscopy (SEM) images were obtained by a TESCAN MIRA3FEG microscope. The X-ray diffraction (XRD) patterns of all the samples were collected on a X'pert Pro X-ray diffractometer from panaco, Netherlands with a 2θ scope of 5–90° at 40 kV and 40 mA using a Cu Ka source (λ = 0.154056 nm). The electromagnetic parameters of complex permittivity and permeability were measured using an Agilent N5234A vector network analyzer by the coaxial-line method in the frequency range of 2–18 GHz. The RL values were calculated by the measured complex permittivity and permeability, as follows.
 | (1) |
RL = 20![[thin space (1/6-em)]](https://www.rsc.org/images/entities/char_2009.gif) log|(Zin − Z0)/(Zin + Z0)| log|(Zin − Z0)/(Zin + Z0)|
| (2) |
3. Results and discussion
3.1. The microstructures of the CF and Fe@CF composite
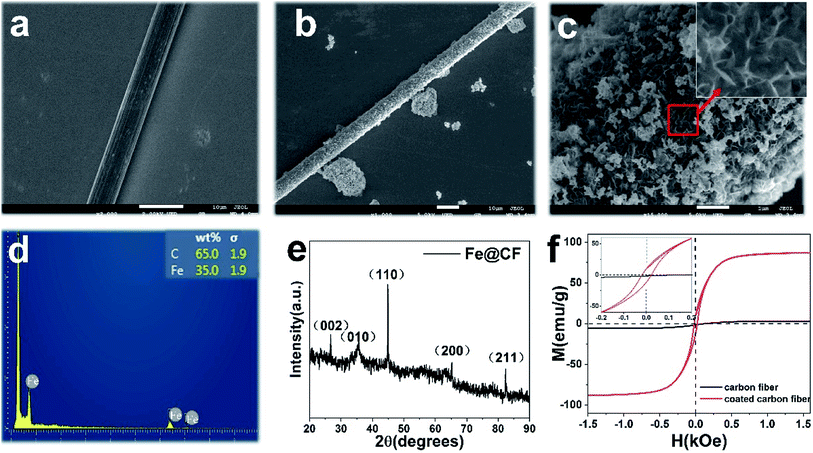
The morphologies of the CF and Fe@CF composites are investigated by SEM as shown in Fig. 1. As shown in Fig. 1a, the CF is a typical columnar structure with relatively smooth surface. Fig. 1b shows the low-magnification SEM image of CF coated with a layer of iron nanoflakes. It can be seen that the CF is completely coated with iron nanoflakes, which indicates that good uniformity is achieved with this method. The morphology of the Fe@CF is shown in Fig. 1c. Iron nanoflakes greatly change its surface. The element composition of the sample is tested by EDS, which confirms that the main crystalline phases are C and Fe (Fig. 1d). In order to confirm the phase structure of the product, the synthesized Fe@CF composite was characterized by XRD. The XRD analysis spectrum is shown in Fig. 1e. Two diffraction peaks appear near 2θ = 26.67°and 35.57°, which reflects the presence of graphite crystallites in Fe@CF, corresponding to the microcrystals (002) and (010) diffraction. And the others peaks of Fe@CF are located at 2θ = 44.79°, 65.21°, and 82.42°, corresponding to the (110), (200), and (211) planes, which have a good match for the body-centered cubic (bcc) Fe crystal (JCPDS card no. 06-0696).2 Fig. 1f shows the magnetic hysteresis curves of the carbon fiber and coated composite sample measured at room temperature. It can be seen that the MH curve obtained at room temperature shows a significant ferromagnetic hysteresis loop. The Fe@CF exhibited ferromagnetic behaviour with saturation magnetization (Ms) of 88.6 emu g−1 and coercivity (Hc) of 10.8 Oe, larger than that of the pure CF.3.2. Formation mechanism of Fe@CF
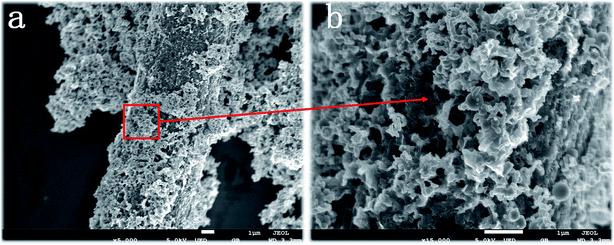
The structure of the surface coating has a very important relationship with the content of PVP. In order to analyze the growth mechanism of the iron sheet, this experiment analyzed the effect of the content of PVP on the microstructure of the product.Fig. 2 shows the surface morphology of Fe@CF prepared without adding PVP during the electroless plating process. As can be seen from Fig. 2, there are a large number of nanoflakes stacked on the CF surface without obvious gaps and voids, and the distribution is uneven, showing the state of particle surface coating, rather than radial vertical growth and distribution. As a polymer surfactant, PVP can play a role in adjusting the particle size of nanoparticles and preventing agglomeration in the dispersion system. When there is no PVP in the reaction process, the Fe core will extend in one direction for the lack of steric hindrance of the surfactant, and the flakes will reunite and overlap in the radial direction. Therefore, it is difficult to form discrete and uniform Fe nanoflakes distributed along the radial direction of the CF. Eventually, a layer of disordered, plate-like pieces will be formed on the surface fluffy covering. It is impossible to achieve the purpose of increasing the anisotropy of CF, thereby improving its wave absorbing performance.
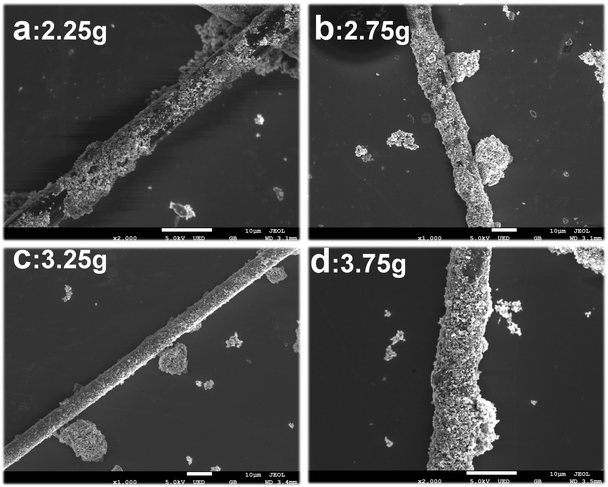
Fig. 3 is the SEM picture obtained by changing the concentration of PVP while keeping other components, concentration and preparation method the same. As shown in Fig. 3a and b, when the PVP content is small, the steric hindrance effect is weak, and the Fe core is not uniformly coated on the CF surface. Experiments show that when the PVP content is increased to 3.25 g (Fig. 3c), the coating is uniform and the morphology is good. After the Fe cores with PVP long-chain molecules adsorbed on the CF surface, the PVP long-chain molecules on the growing nanoflakes at different positions will interfere with each other, thereby avoiding the growth of agglomerated nuclei between the nanoflakes and making the nanoflakes radial increased to form a better sheet structure. It can be seen that the morphology of the growth of the coating is closely related to the presence or absence of PVP, and the uniformity of the coating is affected by the content of PVP. The following is a brief discussion of the growth mechanism of Fe@CF.
The growth mode of Fe@CF prepared by in situ reduction is shown in Fig. 4. When NaBH4 is added dropwise to the FeSO4·7H2O solution containing CF, Fe nuclei and a large number of H2 bubbles are immediately produced by reducing Fe2+ from BH4−. When in contact with H2 bubble, Fe nuclei with high surface energy will combine with it to reduce surface energy. It can be deduced from the equation that the molar ratio of H2 generated in the reaction to Fe nuclei formed in the reaction is 7![[thin space (1/6-em)]](https://www.rsc.org/images/entities/char_2009.gif) :
:![[thin space (1/6-em)]](https://www.rsc.org/images/entities/char_2009.gif) 1, that is, sufficient H2 bubbles are combined with Fe nuclei to avoid mutual binding of Fe nuclei. H2 bubbles carrying Fe nuclei will continue to move in the solution, when it meets the spherical CF, Fe nuclei will accumulate on the surface to further reduce the surface energy and reach a stable state. The surfactant PVP is dispersed in the reaction solution with a macromolecular long chain structure. The molecular structure of PVP is amphiphilic, with hydrophilic and hydrophobic groups at both ends of the molecular structure. In the reaction process, the hydrophobic groups of the long chain structure of PVP will be closely adsorbed on the surface of the Fe nuclei, while the hydrophilic groups are oriented towards the solution. Since all Fe nuclei adsorbed PVP long chain molecules, Fe nuclei were deposited on the CF surface. As shown in Fig. 4c, the long chain PVP molecules on the growing nanoflakes at different locations will repel each other, thereby avoiding agglomeration and growth between the nanoflakes, causing the nanoflakes to increase in the radial direction to form a better sheet structure. After layered deposition, a large number of Fe nanoflakes can be grown on the spherical CF surface to form Fe@CF as shown in Fig. 4d.
1, that is, sufficient H2 bubbles are combined with Fe nuclei to avoid mutual binding of Fe nuclei. H2 bubbles carrying Fe nuclei will continue to move in the solution, when it meets the spherical CF, Fe nuclei will accumulate on the surface to further reduce the surface energy and reach a stable state. The surfactant PVP is dispersed in the reaction solution with a macromolecular long chain structure. The molecular structure of PVP is amphiphilic, with hydrophilic and hydrophobic groups at both ends of the molecular structure. In the reaction process, the hydrophobic groups of the long chain structure of PVP will be closely adsorbed on the surface of the Fe nuclei, while the hydrophilic groups are oriented towards the solution. Since all Fe nuclei adsorbed PVP long chain molecules, Fe nuclei were deposited on the CF surface. As shown in Fig. 4c, the long chain PVP molecules on the growing nanoflakes at different locations will repel each other, thereby avoiding agglomeration and growth between the nanoflakes, causing the nanoflakes to increase in the radial direction to form a better sheet structure. After layered deposition, a large number of Fe nanoflakes can be grown on the spherical CF surface to form Fe@CF as shown in Fig. 4d.
3.3. The EM properties of Fe@CF composite
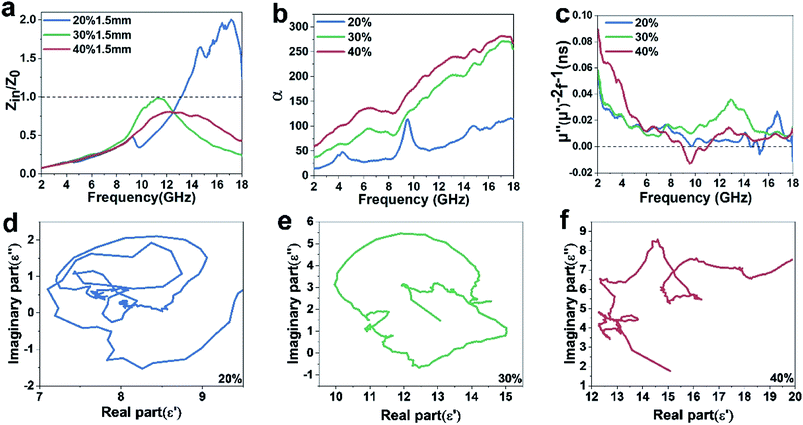
In order to measure the permittivity and permeability, three ring-shaped samples bound by paraffin wax are compacted, containing 20, 30, 40 wt% of obtained carbon fiber, with an outer diameter of 7.00 mm, inner diameter of 3.04 mm, and thickness of 3 mm. Fig. 5a and b show that complex permittivity of the Fe@CF changes with frequency. It can be found that the real part (ε′) and imaginary part (ε′′) of 20% samples almost keep constant over 2–14 GHz, but there are some fluctuations over 14–18 GHz. The 30% and 40% samples fluctuate throughout the entire 2–18 GHz. It is known that the polarization phenomena can lead to the space charge and the dipole polarization in the metal-insulator composites.15 Due to the existence of iron nanoflakes in surface, the dipole polarization dominates in the metal-insulator system with the increase in frequency,16 which results in the fluctuation of complex permittivity. The real part of the dielectric constant represents the ability to store electromagnetic energy, and the imaginary part represents the ability to lose electromagnetic energy.17 As shown in the Fig. 5a and b, the complex permittivity increase with the content of Fe particles, which implies that the morphology variation gives rise to the distinct dielectric loss properties.18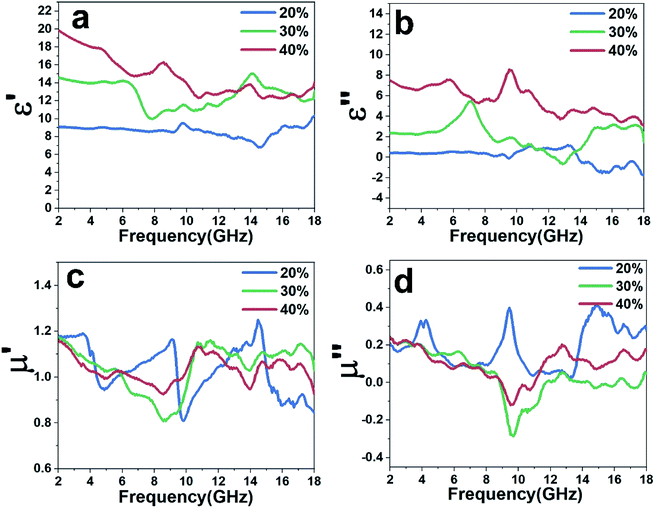 | ||
| Fig. 5 Frequency dependence of (a) the real part and (b) the imaginary part of the complex permittivity, (c) the real part and (d) the imaginary part of the complex permeability. | ||
Fig. 5c and d plot the complex permeability as a function of frequency. Due to the presence of iron nanoflakes, it can be seen that the complex permeability has obvious fluctuation in the range of 2–18 GHz. In addition, we can observe that the μ′ and μ′′ values fluctuate at 1 and 0, respectively, indicating that the Fe@CF composites possess magnetic loss capability to electromagnetic wave.19 For magnetic materials, the magnetic loss based on the imaginary part of complex permeability is mainly derived from domain-wall displacement, magnetic hysteresis, eddy current loss and natural resonance.20,21 In the study of Fe@CF, domain wall displacement loss and hysteresis loss can be excluded. Because domain wall displacement occurs in multi-domain magnetic materials in the range of 1–100 MHz (ref. 22) and hysteresis comes from irreversible magnetization and can be negligible in a weak applied field.23 The eddy current loss is related to the diameter d of the metal particles and the electrical conductivity r, which can be expressed approximately by μ′′ ≈ 2πμ0(μ′)2σd2f/3,23 and μ0 is the permeability of the vacuum. If the magnetic loss is only the result of eddy current loss, then the value Co = μ′′(μ′)−2f−1 should remain constant as the frequency changes.15 As can be seen from Fig. 6c, the value of μ′′(μ′)−2f−1 decreases significantly with increasing frequency. Therefore, the influence of eddy current does not contribute to the permeability. Above all, it can be reasonably explained that the magnetic loss of Fe@CF mainly comes from natural resonance.
3.4. The microwave absorption of Fe@CF composite
It is generally believed that good absorbing properties mainly depend on the electromagnetic impedance matching characteristics and the loss ability.24,25 The electromagnetic impedance matching feature can be expressed as a characteristic impedance equation as26
 | (3) |
 | (4) |
Obviously, both strong dielectric loss and magnetic loss lead to large loss factors. The α–f curve of the above three samples is shown in Fig. 6b. The α–f curve of the three samples has almost the same trend, and the sample with the higher carbon fiber content has stronger attenuation ability. This shows that the larger α value depends mainly on the dielectric loss of Fe@CF.
Cole–cole semicircle means one Debye relaxation process related to dielectric polarization effect. As can be seen from Fig. 6d–f, with the increase of sample quality fraction, the complex exhibits more and clearer cole–cole semicircles from low frequency to high frequency. Commonly, the polarization at a high-frequency region is ascribed to the interface polarization.29 Fe@CF composite has C–Fe, C–Fe3O4 and Fe–Fe3O4 interfaces. We believe that dielectric loss is mainly caused by these interfaces.
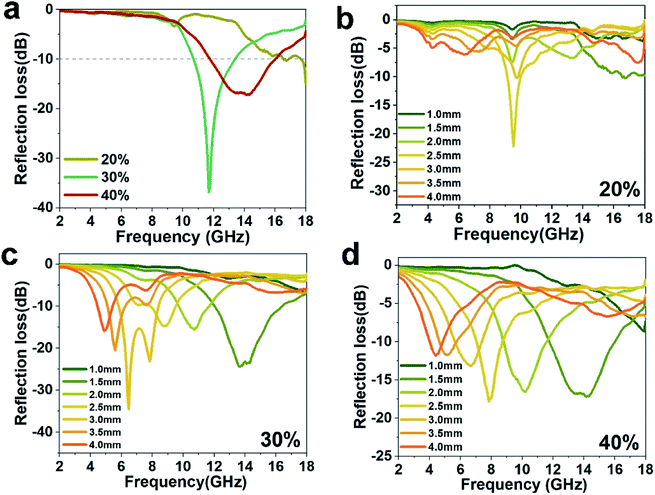
The reflection loss (RL) abilities of Fe@CF are shown in Fig. 7. It can be seen that surface treatment has a great influence on RL of CF. Fig. 7a shows the reflection loss of composites with 20 wt%, 30 wt%, 40 wt% Fe@CF. And the frequencies corresponding to the Minimum RL values of absorption peaks are 11.67 GHz (30 wt%) and 14.17 GHz (40 wt%). Simultaneously, their minimum RL values are −36.89 dB (30 wt%) and −17.24 dB (40 wt%), respectively. According to the theory of electromagnetism, the absorption of carbon fiber to electromagnetic wave is mainly caused by resonance effect, eddy current loss and phase cancellation. When the content of carbon fiber is too high, the resonance induced current generated by resonance effect becomes larger, and the reflection of electromagnetic wave is correspondingly enhanced.
In order to evaluate the microwave absorption properties, Fig. 7b–d show the RL curves of the Fe@CF composites at different absorber thicknesses. Fig. 7b–d show the calculated results of Fe@CF composites. It indicated that the RL peaks of Fe@CF composites move to a lower frequency as the absorber thickness increased. When the natural frequency of the carbon fiber is consistent with the frequency of the incident electromagnetic wave, the carbon fiber resonance generates an induced current. The energy of the electromagnetic wave is converted into heat energy by the resistance of the carbon fiber to achieve the effect of absorbing the wave. Therefore, in theory, the frequency at which the maximum absorption peak of carbon fiber is located is its natural frequency, and does not change when the sample thickness is the same. The results in Fig. 7b–d also confirm this. The frequency of the maximum RL peaks remains basically unchanged at the same thickness when the sample has different mass fraction. But the absorption peaks are different, the reflection loss of electromagnetic waves changes with the increase of carbon fiber. It's obviously that the 30 wt% has wider bandwidths and lower absorption peaks.
4. Conclusion
In summary, Fe@CF composite is successfully prepared by in situ reduction and characterized by SEM, EDS and XRD. The CF@Fe (30 wt%) paraffin composite shows an optimal RL of −36.98 dB at 11.67 GHz with a matching thickness of 1.8 mm. The size of the iron nanoflake is smaller than the skin depth, which effectively reduces the eddy current effect. In addition, the large specific surface area of the iron nanoflakes is favorable for charge polarization and interfacial polarization, which will increase the absorption of electromagnetic waves. The proposed method can provide guidance for the preparation of carbon–metal composite materials and develop a new approach for efficient electromagnetic absorption.Conflicts of interest
There are no conflicts to declare.Acknowledgements
The research is supported by NSFC (Grant No. 51775064, 51875056, 11902055). The authors are grateful for the supports.References
- D. Min, W. Zhou, Y. Qing, F. Luo and D. Zhu, Highly oriented flake carbonyl iron/carbon fiber composite as thin-thickness and wide-bandwidth microwave absorber, J. Alloys Compd., 2018, 744, 629–636 CrossRef CAS.
- M. Yu, P. Yang, J. Fu and S. Liu, Flower-like carbonyl iron powder modified by nanoflakes: preparation and microwave absorption properties, Appl, Phys. Lett., 2015, 106, 161904 Search PubMed.
- J. Snoek, Dispersion and absorption in magnetic ferrites at frequencies above one Mc/s, Physica, 1948, 14, 207–217 CrossRef CAS.
- Y. Cheng, J. Dai, D. Wu and Y. Sun, Electromagnetic and microwave absorption properties of carbonyl iron/La0.6Sr0.4MnO3 composites, J. Magn. Magn. Mater., 2010, 322, 97–101 CrossRef CAS.
- X. G. Cao, H. Ren and H. Y. Zhang, Preparation and microwave shielding property of silver-coated carbonyl iron powder, J. Alloys Compd., 2015, 631, 133–137 CrossRef CAS.
- T. Liu, P. Zhou, J. Xie and L. Deng, The hierarchical architecture effect on the microwave absorption properties of cobalt composites, J. Appl. Phys., 2011, 110, 033918 CrossRef.
- R.-B. Yang and W.-F. Liang, Microwave properties of high-aspect-ratio carbonyl iron/epoxy absorbers, J. Appl. Phys., 2011, 109, 07A311 CrossRef.
- J. Bucher, D. Douglass and L. Bloomfield, Magnetic properties of free cobalt clusters, Phys. Rev. Lett., 1991, 66, 3052 CrossRef CAS.
- S. Wen, Y. Liu, X. Zhao and Z. Fan, Synthesis, permeability resonance and microwave absorption of flake-assembled cobalt superstructure, J. Magn. Magn. Mater., 2015, 385, 182–187 CrossRef CAS.
- J.-r. Liu, M. Itoh, M. Terada, T. Horikawa and K.-i. Machida, Enhanced electromagnetic wave absorption properties of Fe nanowires in gigaherz range, Appl. Phys. Lett., 2007, 91, 093101 CrossRef.
- K. Osouli-Bostanabad, E. Hosseinzade, A. Kianvash and A. Entezami, Modified nano-magnetite coated carbon fibers magnetic and microwave properties, Appl. Surf. Sci., 2015, 356, 1086–1095 CrossRef CAS.
- H. Salimkhani, F. Movassagh-Alanagh, H. Aghajani and K. Osouli-Bostanabad, Study on the magnetic and microwave properties of electrophoretically deposited nano-Fe3O4 on carbon fiber, Procedia Mater. Sci., 2015, 11, 231–237 CrossRef CAS.
- Y. Liu and C. Qiang, Magnetic properties and microwave absorption properties of short carbon fibres coated by Ni–Fe alloy coatings, Bull. Mater. Sci., 2015, 38, 1673–1678 CrossRef CAS.
- Z. Zhang, X. Liu, H. Zhang and E. Li, Electromagnetic and microwave absorption properties of carbon fibers coated with carbonyl iron, J. Mater. Sci.: Mater. Electron., 2015, 26, 6518–6525 CrossRef CAS.
- B. Lu, X. Dong, H. Huang, X. Zhang, X. Zhu, J. Lei and J. Sun, Microwave absorption properties of the core/shell-type iron and nickel nanoparticles, J. Magn. Magn. Mater., 2008, 320, 1106–1111 CrossRef CAS.
- F. Ma, Y. Qin and Y.-Z. Li, Enhanced microwave performance of cobalt nanoflakes with strong shape anisotropy, Appl. Phys. Lett., 2010, 96, 202507 CrossRef.
- J. Tauc, Generation of an emf in semiconductors with nonequilibrium current carrier concentrations, Rev. Mod. Phys., 1957, 29, 308 CrossRef CAS.
- R. Zhuo, H. Feng, J. Chen, D. Yan, J. Feng, H. Li, B. Geng, S. Cheng, X. Xu and P. Yan, Multistep synthesis, growth mechanism, optical, and microwave absorption properties of ZnO dendritic nanostructures, J. Phys. Chem. C, 2008, 112, 11767–11775 CrossRef CAS.
- C. Liu, Y. Xu, L. Wu, Z. Jiang, B. Shen and Z. Wang, Fabrication of core–multishell MWCNT/Fe3O4/PANI/Au hybrid nanotubes with high-performance electromagnetic absorption, J. Mater. Chem. A, 2015, 3, 10566–10572 RSC.
- L.-S. Fu, J.-T. Jiang, C.-Y. Xu and L. Zhen, Synthesis of hexagonal Fe microflakes with excellent microwave absorption performance, Crystengcomm, 2012, 14, 6827–6832 RSC.
- F. Wen, H. Yi, L. Qiao, H. Zheng, D. Zhou and F. Li, Analyses on double resonance behavior in microwave magnetic permeability of multiwalled carbon nanotube composites containing Ni catalyst, Appl. Phys. Lett., 2008, 92, 042507 CrossRef.
- J. Frenkel, Doefman, Spontaneous and induced magnetisation in ferromagnetic bodies, Nature, 1930, 126, 274 CrossRef.
- M. Wu, Y. Zhang, S. Hui, T. Xiao, S. Ge, W. Hines, J. Budnick and G. Taylor, Microwave magnetic properties of Co50/(SiO2)50 nanoparticles, Appl. Phys. Lett., 2002, 80, 4404–4406 CrossRef CAS.
- Y. Qing, W. Zhou, F. Luo and D. Zhu, Epoxy-silicone filled with multi-walled carbon nanotubes and carbonyl iron particles as a microwave absorber, Carbon, 2010, 48, 4074–4080 CrossRef CAS.
- Q. Liu, Q. Cao, H. Bi, C. Liang, K. Yuan, W. She, Y. Yang and R. Che, CoNi@SiO2@TiO2 and CoNi@Air@TiO2 microspheres with strong wideband microwave absorption, Adv. Mater., 2016, 28, 486–490 CrossRef CAS.
- J. He, L. Deng, S. Liu, S. Yan, H. Luo, Y. Li, L. He and S. Huang, Enhanced microwave absorption properties of Fe3O4-modified flaky FeSiAl, J. Magn. Magn. Mater., 2017, 444, 49–53 CrossRef CAS.
- J. Feng, F. Pu, Z. Li, X. Li, X. Hu and J. Bai, Interfacial interactions and synergistic effect of CoNi nanocrystals and nitrogen-doped graphene in a composite microwave absorber, Carbon, 2016, 104, 214–225 CrossRef CAS.
- B. Liang, S. Wang, D. Kuang, L. Hou, B. Yu, L. Lin, L. Deng, H. Huang and J. He, Facile synthesis and excellent microwave absorption properties of FeCo-C core–shell nanoparticles, Nanotechnology, 2018, 29, 085604 CrossRef.
- H. Lv, Y. Guo, G. Wu, G. Ji, Y. Zhao and Z. J. Xu, Interface polarization strategy to solve electromagnetic wave interference issue, ACS Appl. Mater. Interfaces, 2017, 9, 5660–5668 CrossRef CAS.
| This journal is © The Royal Society of Chemistry 2020 |

