 Open Access Article
Creative Commons Attribution 3.0 Unported Licence
The mechanism for CO2 reduction over Fe-modified Cu(100) surfaces with thermodynamics and kinetics: a DFT study†
Mei Qiu *ab,
Yi Li
 c and
Yongfan Zhang
 c
c
aDepartment of Chemistry, College of Science, Jiangxi Agricultural University, Nanchang, Jiangxi 330045, China. E-mail: qium@jxau.edu.cn
bState Key Laboratory of Structural Chemistry, Fujian Institute of Research on the Structure of Matter, Chinese Academy of Sciences, 350002 Fuzhou, Fujian 350002, China
cCollege of Chemistry, Fuzhou University, Fuzhou, Fujian 350116, China
First published on 1st September 2020
Abstract
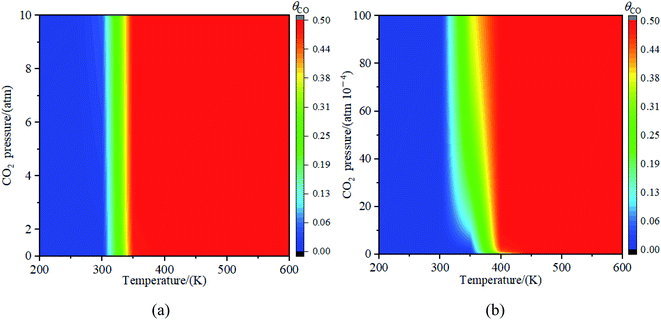
The adsorption, activation and reduction of CO2 over Fex/Cu(100) (x = 1–9) surfaces were examined by density functional theory. The most stable structure of CO2 adsorption on the Fex/Cu(100) surface was realized. The electronic structure analysis showed that the doped Fe improved the adsorption, activation and reduction of CO2 on the pure Cu(100) surface. From the perspective of thermodynamics and kinetics, the Fe4/Cu(100) surface acted as a potential catalyst to decompose CO2 into CO with a barrier of 32.8 kJ mol−1. Meanwhile, the first principle molecular dynamics (FPMD) analysis indicated that the decomposition of the C–O1 bond of CO2 on the Fe4/Cu(100) surface was only observed from 350 K to 450 K under a CO2 partial pressure from 0 atm to 10 atm. Furthermore, the results of FPMD analysis revealed that CO2 would rather decompose than hydrogenate when CO2 and H co-adsorbed on the Fe4/Cu(100) surface.
1. Introduction
Reducing the concentration of CO2 in the atmosphere has attracted significant attention, because as the major component of greenhouse gas, excessive emissions of CO2 have contributed significantly to environment degradation in the past decades, such as global warming, and melting of glaciers. The conversion of CO2 as a C resource to synthesize more valuable chemical raw materials not only solves the major crisis of global greenhouse gases and energy shortage, but also provides great opportunities and challenges for exploring novel catalysts and developing a modern catalytic industry.1Because CO2 is a thermodynamically stable molecule, it is difficult to utilize CO2 as the C resource.2 Currently, five ways to reduce CO2 have been reported: (i) electrocatalytic reduction,3–8 (ii) photocatalytic reduction,2,9–11 (iii) thermal catalytic reduction,12–15 (iv) enzymatic reduction16,17 and (v) photoelectrocatalytic reduction.18 In these cases, the catalyst plays a major role in CO2 activity and reduction.
Numerous experiments and theories have been used to investigate the adsorption, activation and reduction of CO2 on transition metal–based catalysts.19–27 For instance, Fierro systematically investigated the adsorption of CO2 on the Co(100), Co(110) and Co(111) surfaces.19 The results indicated that the adsorption configuration of CO2 on the substrate was sensitive, especially the Co(110) surface. The experimental results of Rasmussen showed that the Cu(100) surface was able to decompose CO2 into CO and O2.22 Roberts demonstrated that CO2 could be decomposed into CO on the Ni(100) surface rather than on the Ni(111) surface.23 Ding asserted that a weak interaction was formed between CO2 and the Ni(110) surface.24 Glezakou investigated the mechanism of adsorption and activation of CO2 on the Fe fcc(100) surface.25 Their results indicated that CO2 on the Fe(100) surface was activated spontaneously. Wilson investigated the reduction of CO2 into CO on Co(100), Ni(100) and Cu(100) surfaces.26 The calculated results revealed an interesting trend between reaction energy and the total reaction barrier from Fe to Cu and that reactions tended to be less exergonic. Additionally, Co and Ni were more favorable to decompose CO2 into CO.
Except for the single metal catalysts for CO2, Great effort has been devoted to improve the catalytic performance of bimetallic catalysts for CO2 activation and catalysis.27,28 Nerlov pointed out that the performance of Cu–Ni bimetallic catalyst was more than 60 times greater than the pure Cu.29–31 Liu found that the introduction of Pd, Rh, Pt, and Ni metals on the Cu(111) surface promoted the methanol production.32 Our previous reports revealed that the introduction of a second metal could improve the interaction between CO2 and the Cu(100) surface.33,34 Additionally, the results also showed that the interaction between CO2 and the Con/Cu(100) surface was structure sensitive for the reduction of CO2 molecules and the Co4/Cu(100) surface was the potential catalyst for the reduction of CO2. The results of Song demonstrated that the properties of CO2 conversion on Fe–Ni and Fe–Co catalysts were similar, and CO* and HCOO* were the preferred intermediates.35,36
On the basis of these reports, in this work the density functional theory calculations was employed to understand the activation and reduction of CO2 on the Cu(100) surface with embedded small Fe atoms. The result of a recent STM experiment showed that small Co clusters can be formed in the first layer of the Cu(100) surface through the vacancy-mediated diffusion of Co atoms.37 The similarity of the Co/Cu(100) and Fe/Cu(100) epitaxial systems suggests that the diffusion of embedded Fe atoms also leads to the formation of small nanostructures.38 Firstly, the most stable structure of Fex/Cu(100) (x = 1–9) was generated using the first principle molecular dynamics (FPMD) method. Then the adsorption energetics and geometry, vibrational frequencies analysis, charge transfers and d-band center of CO2 over a series of Fex/Cu bimetallic surfaces were analyzed. The activation energy barrier for the CO2 reduction and the Brønsted–Evans–Polanyi (BEP) relationships between the kinetic parameters for CO2 reduction over the Fex/Cu(100) systems were investigated. And then the optimal temperature and partial pressure for CO2 reduction on the Fe4/Cu(100) surface was explored in detail. Lastly, the hydrogenation of CO2 and residual CO or O was considered in the paper.
2. Computation details
2.1. Method
All of the density functional theory (DFT) calculations using the Vienna ab initio simulation package (VASP)39–41 were according to projector-augmented wave DFT (PAW-DFT).42–44 The Perdew–Burke–Ernzerhof (PBE) functional based on the generalized gradient approximation was employed.45 The kinetic energy cutoff of 400 eV for the plane-wave expansion was set. In all systems, the effects of dipole correction, spin polarization in the surface normal direction and the van der Waals correction were considered by using DFT-D2 method.46,47 Geometrical structure was optimized until the energy change and the maximum force were less than 10−6 eV and 0.02 eV Å−1, respectively. The 5 × 5 × 1 k-points with Monkhorst–Pack method were used.482.2. Surface model
Previous studies reveal that the Cu(100) surface is the most potential value to be reduction of CO2 molecule among Cu(100), Cu(110) and Cu(111) surfaces.34 Thus, the Cu(100) surface with a p(3 × 3) supercell and five atomic layers was employed. For the Fex/Cu(100) (x = 1–9) surfaces, Cu atoms on top-layer of the pure Cu(100) surface were substituted by several Fe atoms. In the geometry optimizations, the top three layers were completely relaxed in all directions and the bottom two layers were fixed in their bulk position. The vacuum of 15 Å between the adjacent slabs was set along the c-axis direction to avoid periodic interactions.The adsorption energy (Eads) for the CO2 molecule on the Fex/Cu(100) surface was defined eqn (1), as follows:
| Eads = ECO2 + ESlab − ECO2/Slab | (1) |
The reduction of CO2 on the Fex/Cu(100) surface was involved in the formations of CO and HCOO, namely,  and
and  (where X* represents X species adsorbed on substrate). The corresponding activation energy barrier was calculated from the relative energy of the transition state (TS) with respect to the sum of the energies of the initial structure (IS) (CO2 adsorbed on the Fex/Cu(100) surface), namely,
| Ea = ETS − EIS | (2) |
All the transition states were determined using the climbing image nudged elastic band (CI-NEB)49,50 and DIMER51,52 methods and performed a vibrational frequency analysis to confirm that the predicted transition state to the first-order saddle point in the reaction path. Additionally, the Bader charge analysis using the code developed by Henkelman and co-workers was employed to quantify the charge transfer between the substrates and CO2 molecule.53–55
2.3. Microkinetic model
The rate constants for CO2 dissociation using the harmonic transition state theory56–58 was analyzed as shown in eqn (3):
 | (3) |
 | (4) |
The actual activation barrier (Eact), including the entropy (ΔTS), the zero point energy (ZPE) and enthalpy  corrections, was calculated as follows:
 | (5) |
 | (6) |
 | (7) |
 | (8) |
To calculate the relative concentrate (θCO) of CO on the Fe–Cu bimetallic system, the steady state approximation was adopted in this work.59 The total amount of metal catalytic sites in the reaction was considered as a constant and the sum of the occupied (θx) and the free metal (θ*) sites were defined as following eqn (9):60
| θCO2 + 2θCO + θ* = 1 | (9) |
 .61 The partial pressure (PCO2) of CO2 from 0 to 10 atm was set.
For the elementary reaction step  (rate constants,
  ), according to the steady-state approximation, the equation was as follows:
 | (10) |
Thus,
 | (11) |
3. Results and discussion
The most stable structure of the different coverage (n) for Fe dopant on the top-layer of the Cu(100) surface was discussed briefly.If n > 1/9 ML, more than one possible structure of Fe could be doped in the Cu(100) surface. Optimal doping structure for the different coverage of Fe dopant was predicted after extensive study of the various arrangements of Fe atoms embedded in the top-layer of the Cu(100) surface. Taking Fe4/Cu(100) as an example, four possible configurations for the Fe4/Cu(100) surface, namely: M1 ∼ M4, (see Fig. 1), were considered. In the M1 model, four Fe atoms tended to gather together and form a square nanocluster. For the M2 and M3 structure, the four Fe atoms exhibited the T- and Z-type structure, respectively. In the M4 structure, it was seen as the Fe3 trimer and an isolated Fe atom. The calculated relative energies (Fig. 1) indicated that the energetically most favorable configuration among the M1 ∼ M4 models was the M1. The most stable structure for the Fex/Cu(100) surfaces was determined by the similar approach and shown in Fig. S1.† Interestingly, from the perspective of thermodynamic, Fe dopant tended to arrange together when the n values increased from 1/9 to 1 ML. Therefore, we focused on the adsorption, activation and reduction of CO2 molecule on the most stable configuration for the Fex/Cu(100) surfaces.
 | ||
| Fig. 1 Top views and the relative energies for four different arrangements of four Fe atoms embedded in the toplayer of Cu(100) surface, Cu Orange Fe green. | ||
3.1. Adsorption configurations of CO2 on Fex/Cu(100) surfaces
The most stable structure of CO2 on the Fex/Cu(100) (x = 1–9) surface was presented in Fig. 2, including CO2 on the pure Cu(100) and Fe fcc(100) surfaces. It was clearly observed in Fig. 2 that the adsorption behavior of CO2 on the Fex/Cu(100) surface was sensitive to the coverage of Fe atoms when the coverage of Fe atoms was less than 4/9 ML (Fig. 2(a)–(c)). While the coverage was more than 4/9 ML (Fig. 2(d)), the adsorption configuration of CO2 on the Fex/Cu(100) surface (Fig. 2(e)–(i)) was similar to the structure of CO2 on the Fe4/Cu(100) surface. Herein, it was worth noting that the O atoms in the CO2 molecule tended to bind with the Fe atoms on the substrate via forming Fe–O adsorption bonds because the strength of the Fe–O bond was stronger than the Cu–O bond (e.g., in a diatomic molecule, the dissociation energies of the Fe–O bond and Cu–O bond were about 390.4 and 269.0 kJ mol−1, respectively), indicating that the introduced Fe atoms were the major center of CO2 adsorption and activation.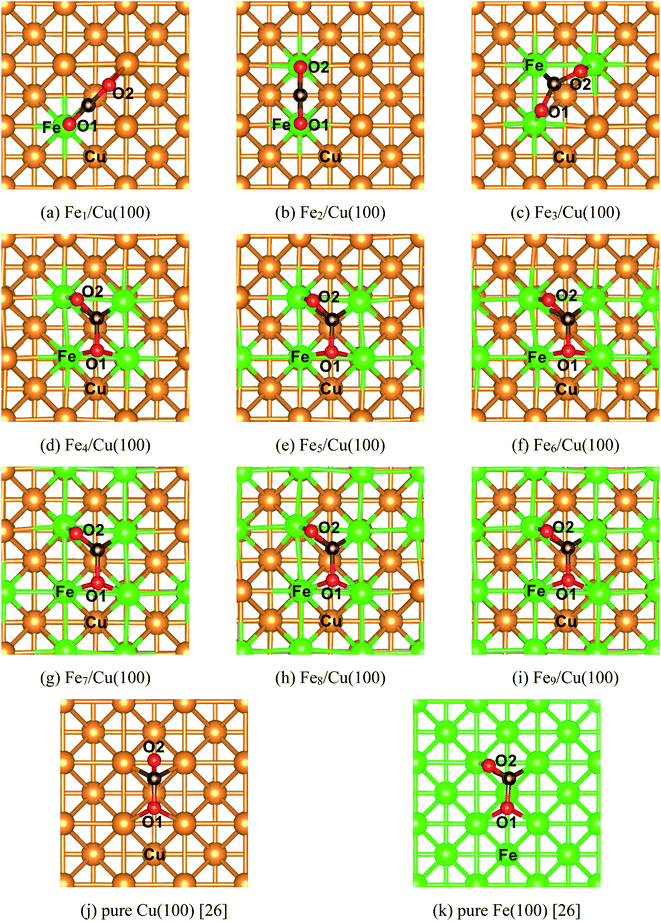 | ||
| Fig. 2 Top views of the most stable configurations of CO2 adsorbed on the different FexCu(100) surfaces, as well as on the pure Cu(100) and Fe(100) surfaces with fcc structure. | ||
After CO2 adsorption, some electrons were transferred from the substrate to CO2 moiety, leading to the bent structure with the O–C–O bond angle from 118° to 135° (Table 1). Furthermore, the C–O1 bond and the C–O2 bond was stretched to about 1.253 to 1.364 Å and 1.253 to 1.300 Å, respectively. Especially the C–O1 bond, its distance was gradually elongated by 0.2 Å compared with the distance of 1.176 Å in gas-phase CO2 molecule when the coverage of the Fe atoms was more than 3/9 ML, which meant that the C–O1 bond was activated after CO2 adsorption. Meanwhile, it was also noticed that when the coverage of the Fe atoms was more than 3/9 ML, the extra interaction between the O2 atom in the CO2 moiety and the Fe atom was established and the corresponding Fe–O2 bond length was 2.014 Å (Fe4/Cu(100)), 2.000 Å (Fe5/Cu(100)), 1.987 Å (Fe6/Cu(100)), 1.974 Å (Fe7/Cu(100)), 1.961 Å (Fe8/Cu(100)) and 1.965 Å (Fe9/Cu(100)). Among these Fe–O2 bonds, the distance of the Fe–O2 bond for CO2 on the Fe4/Cu(100) was the longest, requiring the less energy barrier to decompose CO2. The calculated adsorption energy (see Table 1) increased monotonously as an increase of the coverage for Fe atoms, suggesting that introducing Fe atoms in the pure Cu(100) surface could improve the bonding strength of CO2 to the substrate. Compared with the adsorption energy of CO2 on the pure Cu(100) (Eads = −72.4 kJ mol−1) and Fe fcc(100) (Eads = 139.8 kJ mol−1) surfaces,26 the binding strength of CO2 on the substrate was enhanced while the coverage of Fe atoms was more than 3/9 ML.
| System | dC–O1a | dC–O2 | ∠O–C–O | dFe–C | dFe–O1 | dCu–O2 | dFe–O2 | Eads |
|---|---|---|---|---|---|---|---|---|
| a The symbols O1 and O2 represent the two oxygen atoms of the CO2 moiety (see Fig. 2). For the free CO2 molecule, the optimized length of the C–O bond is 1.176 Å.b The number of bonds is shown in parentheses.c The data origin from the ref. 20. | ||||||||
| Fe1/Cu(100) | 1.258 | 1.271 | 134.5 | 1.929 | 2.015 | 2.163 | — | 84.5 |
| Fe2/Cu(100) | 1.253 | 1.253 | 138.9 | 2.041 (×2)b | 2.091 | — | 2.092 | 115.9 |
| Fe3/Cu(100) | 1.296 | 1.295 | 124.4 | 1.939 | 1.969 | — | 1.971 | 135.3 |
| Fe4/Cu(100) | 1.356 | 1.293 | 121.3 | 2.113/1.936 | 2.039/2.040 | — | 2.014 | 145.3 |
| Fe5/Cu(100) | 1.354 | 1.296 | 121.2 | 2.116/1.936 | 2.046/2.048 | — | 2.000 | 148.6 |
| Fe6/Cu(100) | 1.351 | 1.299 | 121.2 | 2.160/2.050 | 2.048/2.050 | — | 1.987 | 153.0 |
| Fe7/Cu(100) | 1.362 | 1.296 | 118.5 | 2.115/1.938 | 2.047/2.013 | — | 1.974 | 147.4 |
| Fe8/Cu(100) | 1.361 | 1.300 | 118.3 | 2.167/1.924 | 2.028/2.009 | — | 1.961 | 154.8 |
| Fe9/Cu(100) | 1.364 | 1.299 | 118.3 | 2.138/1.924 | 2.038/2.009 | — | 1.965 | 150.8 |
 c c |
1.322 | 1.220 | 128.4 | 2.157 | 2.098 | — | — | −72.4 |
 c c |
1.340 | 1.290 | 120.5 | 2.190/1.950 | 2.040/2.080 | — | 1.990 | 139.8 |
3.2. Electronic structures of CO2 on Fex/Cu(100) surfaces
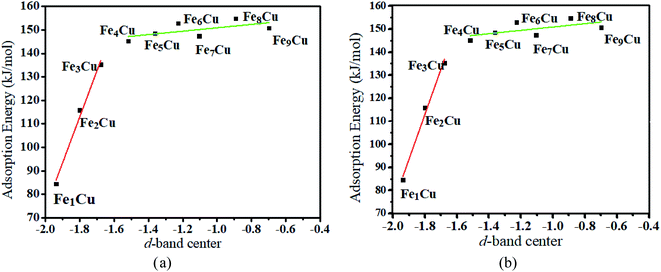 | ||
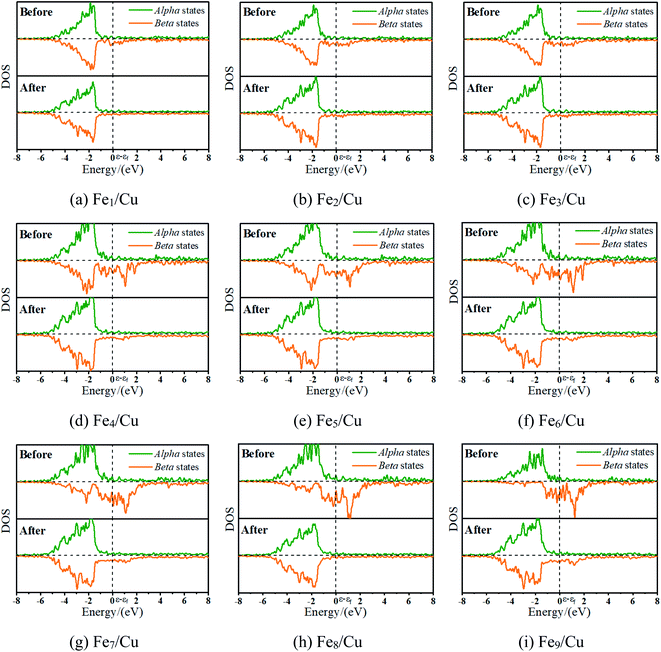
| Fig. 3 Relationship between (a) the total d-band center (b) the d-band center for beta-orbitals of different Fex/Cu(100) surface and the adsorption energies of CO2 molecule. | ||
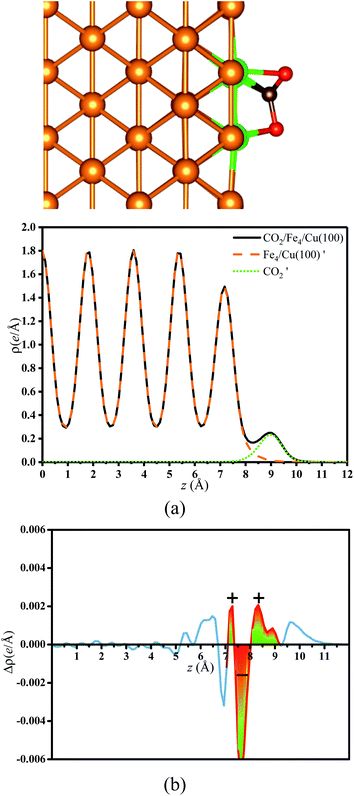
To quantify these charges transferred, the Bader charge analysis for all systems was calculated, as shown in Table 2. As expected, CO2 obtained some electrons from the Fex/Cu(100) surfaces. In general, as the coverage increased for Fe atoms, the electrons obtained by CO2 from the surface also increased. In particular, for the Fe9/Cu(100) surface, the transferred electrons reached the maximum (1.17e). The atomic charges for C and O atoms of CO2 moiety were also included in Table 2. It was obviously evident in Table 2 that the transferred electrons were significantly concentrated on C atom.
| C | O1 | O2 | CO2 moiety | |
|---|---|---|---|---|
| a The data origin from ref. 20. | ||||
| CO2 | 1.94 | −0.97 | −0.97 | 0 |
| Fe1/Cu(100) | 1.29 | −1.07 | −0.99 | −0.77 |
| Fe2/Cu(100) | 1.24 | −1.01 | −1.01 | −0.78 |
| Fe3/Cu(100) | 1.14 | −1.03 | −1.04 | −0.93 |
| Fe4/Cu(100) | 0.98 | −1.06 | −1.04 | −1.12 |
| Fe5/Cu(100) | 0.90 | −1.02 | −1.00 | −1.13 |
| Fe6/Cu(100) | 0.96 | −1.08 | −1.02 | −1.14 |
| Fe7/Cu(100) | 0.92 | −1.03 | −1.04 | −1.15 |
| Fe8/Cu(100) | 0.94 | −1.08 | −1.02 | −1.16 |
| Fe9/Cu(100) | 0.94 | −1.08 | −1.03 | −1.17 |
| Pure Cu(100)a | 1.47 | −1.10 | −1.00 | −0.63 |
| Pure Fe fcc(100)a | 1.02 | −1.12 | −1.05 | −1.16 |
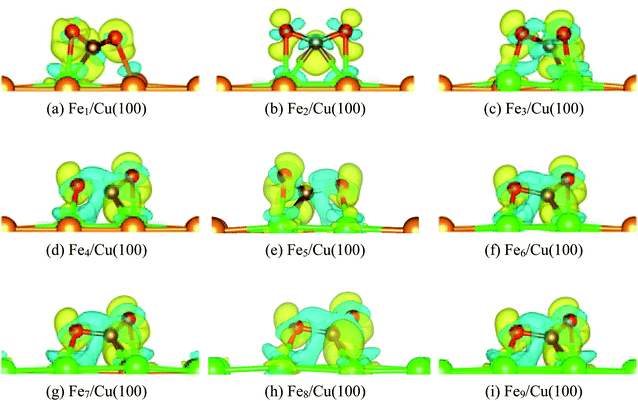
Fig. 6 displays the charge density difference for CO2 moiety on Fex/Cu(100) surface. If the coverage was less than 4/9 ML, the π-bond between C and O1 atoms was weakened slightly, especially the Fe1/Cu(100). Although the coverage was more than 3/9 ML, Fig. 6(d)–(i) clearly showed that the degree of activation for the π-bond was quite similar and was more larger than CO2 on the Fe1∼3/Cu(100) surface.
| System | vC–O1/cm−1 | vC–O2/cm−1 |
|---|---|---|
| a The data origin from NIST database: https://webbook.nist.gov/chemistry. | ||
| Free CO2a | 1333 | 1333 |
| Fe1/Cu(100) | 1122 | 1610 |
| Fe2/Cu(100) | 1152 | 1152 |
| Fe3/Cu(100) | 1117 | 1117 |
| Fe4/Cu(100) | 1017 | 1305 |
| Fe5/Cu(100) | 1019 | 1296 |
| Fe6/Cu(100) | 1025 | 1283 |
| Fe7/Cu(100) | 989 | 1279 |
| Fe8/Cu(100) | 993 | 1258 |
| Fe9/Cu(100) | 979 | 1261 |
3.3. Decomposition of CO2 on Fex/Cu(100) surfaces
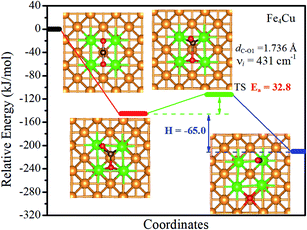 | ||
| Fig. 7 Calculated reaction paths of CO2 dissociation on the Fe4/Cu(100) surface. The zero of energy is set to the total energy of the isolated surface and CO2 molecule in the gas phase. | ||
The activation energy barrier (Ea) of CO2 decomposition on the Fex/Cu(100) surface was determined and shown in Fig. 7 and S11.† In addition, the vibration frequencies of all transition states were calculated to ensure that the predicted TS corresponds to the first-order saddle point in the reaction path and the imaginary frequency (νi) was also shown in Fig. 7 and S11.† For the Fe1/Cu(100) surface, only one TS for the C–O1 bond decomposition was discovered. The activation energy barrier (relative to the energy of the CO2 adsorption) of CO2 decomposed on the Fe1/Cu(100) surface was 45.6 kJ mol−1. For the Fe2/Cu(100) and Fe3/Cu(100) surfaces, the activation energy barrier increased to 59.9 kJ mol−1 and 63.7 kJ mol−1 compared with the Fe1/Cu(100) surface, respectively. When the coverage reached 4/9 ML, the activation energy barrier reached the minimum value (32.8 kJ mol−1). The transition state of CO2 decomposition on the Fex/Cu(100) surface was extremely similar to the CO2 on the Fe4/Cu(100) surface when the coverage was greater than 4/9 ML. The corresponding activation energy barrier from the Fe5/Cu(100) to Fe9/Cu(100) systems was 35.4 kJ mol−1, 39.7 kJ mol−1, 34.7 kJ mol−1, 40.2 kJ mol−1 and 35.0 kJ mol−1, respectively. The results showed that the activation energy barrier of all systems exhibited an inverted “S” shape, which was consistent with the variation in the distance between Fe and O2 atoms, that is, the shorter the distance of the Fe–O2 adsorption bond, the larger the activation energy barrier. For instance, the length (2.014 Å) of the Fe–O2 adsorption bond formed on the Fe4/Cu(100) surface was the largest among the Fex/Cu(100) system, which indicated that the O2 atom may need to consume less additional energy to “escape” out of the substrate. Therefore the activation energy barrier of CO2 decomposition on the Fe4/Cu(100) surface was minimal. In addition, Fe dopant introduced on the Cu(100) surface significantly reduced the activation energy barrier of CO2 decomposition compared with the barrier of CO2 on the pure Cu(100) surface with the barrier of 92.9 kJ mol−1 and the Fe(100) surface with the barrier of 113.4 kJ mol−1, especially the Fe4/Cu(100) system.26 Compared to CO2 on the Co4/Cu(100) surface with the barrier of 18.7 kJ mol−1,33 the activation energy barrier for CO2 on the Fex/Cu(100) is more than 14.1 kJ mol−1. The main reason is that bond strength of Fe–O (in diatomic molecules: 390.4 kJ mol−1) is stronger than that of Co–O (in diatomic molecules: 384.5 kJ mol−1), which led to be the extra barrier formed by Fe–O bond to overcome.
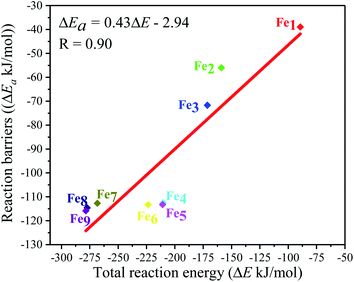
Moreover, the reaction energy barrier (ΔEa = ETS − ESlab − ECO2) and the total reaction energy (ΔE = Eads + H) followed a linear relationship for the C–O bond scission and the BEP relationship was established: ΔEa = 0.4ΔE − 2.5 (kJ mol−1) (see Fig. 8). This BEP relationship played an important role in estimating the reaction barrier of the C–O bond scission on other metal surfaces. Furthermore, the results in Fig. 3 showed an increasing trend as the number of Fe-dopants increased. It was worth noting that although the Fe4/Cu(100) surface did not have the lowest reaction energy barrier and total reaction energy, the Fe4/Cu(100) surface had the lowest activation energy barrier for CO2 decomposition, which facilitated the decomposition of CO2.
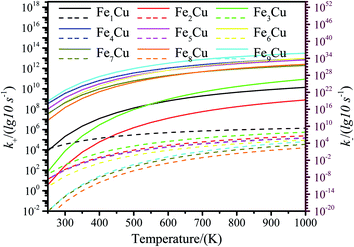
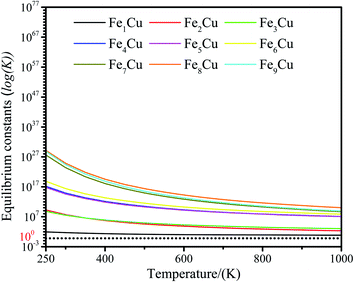
The zero point energy, entropy and enthalpy corrections for the activation energy barrier (Ea) were considered to accurately describe the reaction at high temperatures (from 250 to 1000 K) in this section. The obtained results were presented in Tables S2–S19.† The forward and reverse rate constants of the elementary reaction steps for CO2 decomposition on the Fex/Cu(100) surfaces at temperature ranging from 250 to 1000 K were displayed in Fig. 9. The Fig. 9 showed that the forward rate constants and inverse rate constants for the CO2 decomposition on the Fex/Cu(100) surfaces increased as the temperature increased. At the same temperature, the rate constants for CO2 dissociation increased with an increase in the coverage of dopant Fe atom, indicating that the doped Fe significantly improved the rate constants. Moreover, it was further noting that the both forward rate constants and inverse rate constants for CO2 decomposition was not only increased as the increase of temperature, but the forward rate constants in all Fex/Cu(100) surface were much larger than the inverse rate constants. In addition, the equilibrium constants (K = k+/k−) of CO2 decomposition on the Fex/Cu(100) surfaces were also considered as a critical parameter. As shown in Fig. 10 and in Tables S11–S19,† the K decreased as the temperature increased, which meant that the increase in the inverse rate constants was greater than the positive rate constants as the temperature increased. The nine curves for K (equilibrium constants) were divided into four groups, i.e. G1 (Fe1/Cu system), G2 (Fe2/Cu and Fe3/Cu systems), G3 (Fe4/Cu, Fe5/Cu and Fe6/Cu systems), G4 (Fe7/Cu, Fe8/Cu and Fe9/Cu systems). In each group the equilibrium constants were close to each other, which was agreement with the variation in the BEP relationship. According to the K, the order of the four group was G4 > G3 > G2 > G1 at the same temperature. Thus, the doped Fe atom was favorable to be activation and decomposition of CO2 molecule and the K of CO2 decomposition increased as the coverage of the Fe atom increased. Moreover, although increasing temperature was favorable to the increases of the forward rate constants and invers rate constants, it was unfavorable to the increase of the equilibrium constants. From the perspective of dynamics, this results indicated that the lower the temperature for CO2 decomposition, the more favorable the decomposition of CO2 on the Fex/Cu(100) surface.
3.4. Hydrogenation of CO2 on Fe4/Cu(100) surface
The mechanism of CO2 hydrogenation on the Fe4/Cu(100) surface was also examined in this section. There were three reaction pathways for CO2 hydrogenation: the C atom was attacked by H atom and the O1 and O2 atom was attacked, respectively. However, our previous works reveal that the hydrogenation of the C atom in CO2 moiety is more favorable than that of the O atom.16,33,34 Thus, the C atom hydrogenation was considered as an important reaction pathway while CO2 moiety was dissociated. The initial structure (IS), translation structure (TS) and finally structure (FS) was presented in Fig. 12. In Fig. 12, the distance between C and H atoms was changed from 2.464 Å in the IS to 1.570 Å in the TS, and then to 1.111 Å in the FS. The translation structure had been confirmed by the single imaginary frequency with 686 cm−1. It was worth noted that the calculated activation energy barrier of CO2 hydrogenation to HCOO* was 31.8 kJ mol−1, which was less 1.0 kJ mol−1 than that of decomposition for CO2 on the Fe4/Cu(100) surface. Such the small difference suggests that CO2 hydrogenation could also be performed during the CO2 decomposition. To understand the relationship between hydrogenation and dissociation of CO2, the FPMD was carried to the system with CO2 and H co-adsorption on Fe4/Cu(100) surface at temperature from 250 to 450 K. The radial distribution function of C–O suggests that the broad peak was observed from 2.5 to 3.5 Å in Fig. S15(a)† and it was not found for the peak of C–H in Fig. S15(b)† and O–H in Fig. S15(c)† from 1.0 to 1.5 Å at 400 K. This means that CO2 would rather decompose than hydrogenate at 400 K.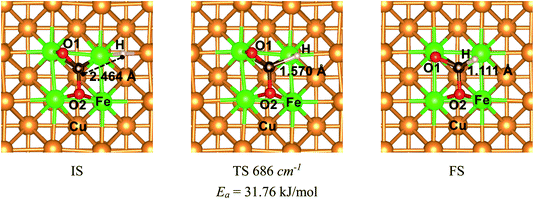 | ||
| Fig. 12 The structures of initial structure (IS), translation structure (TS) and final structure (FS) for CO2 hydrogenation to HCOO* on the Fe4/Cu(100) surface. | ||
4. Conclusions
The adsorption, activation and reduction of CO2 molecule on the Fex/Cu(100) (x = 1–9) had been investigated by the density functional theory based on the first principle. The results indicated that the introduction of dopant Fe atom could enhance the adsorption and activation of CO2 molecule on the Cu(100) surface. The most stable structure for CO2 on the Fex/Cu(100) surface was sensitive to the coverage of the Fe dopant. The electronic structural analysis, including d-band center, Bader charge, vibrational frequencies, showed that CO2 molecule interacted with the β-state orbitals of the Fex/Cu(100) surface. After CO2 adsorption, some electrons were transferred from substrate to CO2 moiety and the electrons transferred to CO2 moiety increased with the coverage of Fe atoms increased, leading to formation of CO2− anion. Additionally, the mechanism of CO2 moiety decomposition on Fex/Cu(100) surfaces had been studied in detail. The results indicated that the activation energy barrier (Ea = 32.8 kJ mol−1) of CO2 decomposition on Fe4/Cu(100) was the smallest among the Fex/Cu(100) surfaces. The major reason was that, if coverage was more than 4/9 ML, the extra formed Fe–O2 bond played an handle role for CO2 decomposition. From the viewer of kinetic, the rate constants of CO2 on Fe4/Cu(100) surface were close to that of the Fe9/Cu(100) surface and the equilibrium constants analysis revealed that the servers of the equilibrium constants were divided into the four group, and the order of the four groups was G1 (Fe1/Cu) > G2 (Fe2/Cu and Fe3/Cu) > G3 (Fe4/Cu, Fe5/Cu and Fe6/Cu) > G4 (Fe7/Cu, Fe8/Cu and Fe9/Cu). Furthermore, our results confirmed that the lower the temperature, the more favorable it was to decompose the CO2 molecule into CO. When the simulated temperature was in range from 350 K and 450 K, the decomposition of C–O1 bond in CO2 moiety was only observed. The results of partial pressure for CO2 revealed that when the temperature was in range from 350 K to 450 K, the concentrate of CO on the Fe4/Cu(100) surface reached 49% under the partial pressure of 3 × 10⁻⁴ atm. Lastly, the mechanism of CO2 hydrogenation on the Fe4/Cu(100) surface was also investigated. The activation energy barrier of 31.8 kJ mol−1 was slightly less than that of CO2 decomposition. However, the results of the FPMD analysis revealed that CO2 was decomposed to form CO*, instead of hydrogenated. Our results provide insight into the mechanism for CO2 decomposition and hydrogenation on bimetallic surfaces from the perspective of thermodynamics and kinetics, which was important for the design and optimization of novel Cu-based bimetallic catalysts.Conflicts of interest
The authors declare that they have no known competing financial interests or personal relationships that could have appeared to influence the work reported in this paper.Acknowledgements
The author is grateful to Prof. Yongfan Zhang who contributes the VASP Package and provides lots of help for this research. Financial support for this research was provided by National Natural Science Foundation of China (grant no. 21773030) and Natural Science Foundation of Jiangxi Provincial Department of Education (grant no. GJJ170304).References
- S. Kar, R. Sen, A. Goeppert and G. S. Prakash, J. Am. Chem. Soc., 2018, 140, 1580–1583 CrossRef CAS.
- G. Gao, Y. Jiao, E. R. Waclawik and A. Du, J. Am. Chem. Soc., 2016, 138, 6292–6297 CrossRef CAS.
- D. A. Torelli, S. A. Francis, J. C. Crompton, A. Javier, J. R. Thompson, B. S. Brunschwig, M. P. Soriaga and N. S. Lewis, ACS Catal., 2016, 6, 2100–2104 CrossRef CAS.
- E. R. Cave, C. Shi, K. P. Kuhl, T. Hatsukade, D. N. Abram, C. Hahn, K. Chan and T. F. Jaramillo, ACS Catal., 2018, 8, 3035–3040 CrossRef CAS.
- I. Ledezma-Yanez, E. P. Gallent, M. T. Koper and F. Calle-Vallejo, Catal. Today, 2016, 262, 90–94 CrossRef CAS.
- H. Kumagai, T. Nishikawa, H. Koizumi, T. Yatsu, G. Sahara, Y. Yamazaki, Y. Tamaki and O. Ishitani, Chem. Sci., 2019, 10, 1597–1606 RSC.
- F. Pan, B. Li, W. Deng, Z. Du, Y. Gang, G. Wang and Y. Li, Appl. Catal., B, 2019, 252, 240–249 CrossRef CAS.
- Y. Pi, J. Guo, Q. Shao and X. Huang, Nano Energy, 2019, 62, 861–868 CrossRef CAS.
- X. Li, W. Bi, L. Zhang, S. Tao, W. Chu, Q. Zhang, Y. Luo, C. Wu and Y. Xie, Adv. Mater., 2016, 28, 2427–2431 CrossRef CAS.
- E.-X. Chen, M. Qiu, Y.-F. Zhang, Y.-S. Zhu, L.-Y. Liu, Y.-Y. Sun, X. Bu, J. Zhang and Q. Lin, Adv. Mater., 2018, 30, 1704388 CrossRef.
- S. Remiro-Buenamañana and H. García, ChemCatChem, 2018, 11, 342–356 CrossRef.
- Y. Hartadi, D. Widmann and R. J. Behm, J. Catal., 2016, 333, 238–250 CrossRef CAS.
- M. Qiu, H. Tao, R. Li, Y. Li, X. Huang, W. Chen, W. Su and Y. Zhang, J. Chem. Phys., 2016, 145, 134701 CrossRef.
- S. Kuld, M. Thorhauge, H. Falsig, C. F. Elkjær, S. Helveg, I. Chorkendorff and J. Sehested, Science, 2016, 352, 969–974 CrossRef CAS.
- P. Gao, S. Li, X. Bu, S. Dang, Z. Liu, H. Wang, L. Zhong, M. Qiu, C. Yang, J. Cai, W. Wei and Y. Sun, Nat. Chem., 2017, 9, 1019–1024 CrossRef CAS.
- T. Wagner, U. Ermler and S. Shima, Science, 2016, 354, 114–117 CrossRef CAS.
- Y. Zheng, W. Q. Zhang, Y. F. Li, J. Chen, B. Yu, J. C. Wang, L. Zhang and J. J. Zhang, Nano Energy, 2017, 40, 512–539 CrossRef CAS.
- G. X. Zhao, X. B. Huang, X. X. Wang and X. K. Wang, J. Mater. Chem. A, 2017, 5, 21625–21649 RSC.
- A. Víctor, S. González, F. Illas and J. L. Fierro, Chem. Phys. Lett., 2008, 454, 262–268 CrossRef.
- S.-G. Wang, D.-B. Cao, Y.-W. Li, J. Wang and H. Jiao, J. Phys. Chem. B, 2005, 109, 18956–18963 CrossRef CAS.
- A. Farjamnia and B. Jackson, J. Chem. Phys., 2017, 146, 074704 CrossRef.
- P. Rasmussen, P. Taylor and I. Chorkendorff, Surf. Sci., 1992, 269, 352–359 CrossRef.
- H.-J. Freund and M. W. Roberts, Surf. Sci. Rep., 1996, 25, 225–273 CrossRef.
- X. Ding, V. Pagan, M. Peressi and F. Ancilotto, Mater. Sci. Eng., C, 2007, 27, 1355–1359 CrossRef CAS.
- V.-A. Glezakou, L. X. Dang and B. P. McGrail, J. Phys. Chem. C, 2009, 113, 3691–3696 CrossRef CAS.
- C. Liu, T. R. Cundari and A. K. Wilson, J. Phys. Chem. C, 2012, 116, 5681–5688 CrossRef CAS.
- R. Ferrando, J. Jellinek and R. L. Johnston, Chem. Rev., 2008, 108, 845–910 CrossRef CAS.
- B. Steinhauer, M. R. Kasireddy, J. Radnik and A. Martin, Appl. Catal., A, 2009, 366, 333–341 CrossRef CAS.
- J. Nerlov and I. Chorkendorff, J. Catal., 1999, 181, 271–279 CrossRef CAS.
- J. Nerlov, S. Sckerl, J. Wambach and I. Chorkendorff, Appl. Catal., A, 2000, 191, 97–109 CrossRef CAS.
- J. Nerlov and I. Chorkendorff, Catal. Lett., 1998, 54, 171–176 CrossRef CAS.
- Y. Yang, M. G. White and P. Liu, J. Phys. Chem. C, 2011, 116, 248–256 CrossRef.
- M. Qiu, H. Tao, Y. Li, Y. Li, K. Ding, X. Huang, W. Chen and Y. Zhang, Appl. Surf. Sci., 2018, 427, 837–847 CrossRef CAS.
- M. Qiu, Z. Fang, Y. Li, J. Zhu, X. Huang, K. Ding, W. Chen and Y. Zhang, Appl. Surf. Sci., 2015, 353, 902–912 CrossRef CAS.
- X. Nie, H. Wang, Z. Liang, Z. Yu, J. Zhang, M. J. Janik, X. Guo and C. Song, J. CO2 Util., 2019, 29, 179–195 CrossRef CAS.
- X. Nie, H. Wang, M. J. Janik, X. Guo and C. Song, J. Phys. Chem. C, 2016, 120, 9364–9373 CrossRef CAS.
- O. Kurnosikov, J. T. Kohlhepp and W. J. M. de Jonge, Europhys. Lett., 2003, 64, 77–83 CrossRef CAS.
- S. V. Kolesnikov, A. L. Klavsyuk and A. M. Saletsky, J. Exp. Theor. Phys., 2015, 121, 616–622 CrossRef CAS.
- G. Kresse and J. Hafner, Phys. Rev. B: Condens. Matter Mater. Phys., 1993, 48, 13115–13118 CrossRef CAS.
- G. Kresse and J. Hafner, Phys. Rev. B: Condens. Matter Mater. Phys., 1993, 47, 558–561 CrossRef CAS.
- G. Kresse and J. Hafner, Phys. Rev. B: Condens. Matter Mater. Phys., 1994, 49, 14251–14269 CrossRef CAS.
- G. Kresse and D. Joubert, Phys. Rev. B: Condens. Matter Mater. Phys., 1999, 59, 1758–1775 CrossRef CAS.
- P. E. Blöchl, Phys. Rev. B: Condens. Matter Mater. Phys., 1994, 50, 17953–17979 CrossRef.
- J. Hafner, J. Comput. Chem., 2008, 29, 2044–2078 CrossRef CAS.
- J. P. Perdew, K. Burke and M. Ernzerhof, Phys. Rev. Lett., 1996, 77, 3865–3868 CrossRef CAS.
- S. Grimme, J. Comput. Chem., 2006, 27, 1787–1799 CrossRef CAS.
- J. P. Ramalho, J. R. Gomes and F. Illas, RSC Adv., 2013, 3, 13085–13100 RSC.
- H. J. Monkhorst and J. D. Pack, Phys. Rev. B: Solid State, 1976, 13, 5188–5192 CrossRef.
- D. Sheppard, P. Xiao, W. Chemelewski, D. D. Johnson and G. Henkelman, J. Chem. Phys., 2012, 136, 074103 CrossRef.
- D. Sheppard, R. Terrell and G. Henkelman, J. Chem. Phys., 2008, 128, 134106 CrossRef.
- G. Henkelman and H. Jónsson, J. Chem. Phys., 1999, 111, 7010–7022 CrossRef CAS.
- R. Olsen, G. Kroes, G. Henkelman, A. Arnaldsson and H. Jónsson, J. Chem. Phys., 2004, 121, 9776–9792 CrossRef CAS.
- G. Henkelman, A. Arnaldsson and H. Jónsson, Comput. Mater. Sci., 2006, 36, 354–360 CrossRef.
- E. Sanville, S. D. Kenny, R. Smith and G. Henkelman, J. Comput. Chem., 2007, 28, 899–908 CrossRef CAS.
- W. Tang, E. Sanville and G. Henkelman, J. Phys.: Condens. Matter, 2009, 21, 084204 CrossRef CAS.
- H. Eyring, J. Chem. Phys., 1935, 3, 107–115 CrossRef CAS.
- J. K. Nørskov, F. Studt, F. Abild-Pedersen and T. Bligaard, Fundamental Concepts in Heterogeneous Catalysis, Wiley, Hoboken, 2014, vol. 4, pp. 47–67 Search PubMed.
- K. J. Laidler, Chemical Kinetics, HarperCollins, New York, 3rd edn, 1987, vol. 4, pp. 81–129 Search PubMed.
- A. Bukoski, H. Abbott and I. Harrison, J. Chem. Phys., 2005, 123, 094707 CrossRef CAS.
- K. Li, C. Yin, Y. Zheng, F. He, Y. Wang, M. Jiao, H. Tang and Z. Wu, J. Phys. Chem. C, 2016, 120, 23030–23043 CrossRef CAS.
- P. Liu and J. A. Rodriguez, J. Chem. Phys., 2007, 126, 164705 CrossRef.
- G. Novell-Leruth, J. M. Ricart and J. Pérez-Ramírez, J. Phys. Chem. C, 2008, 112, 13554–13562 CrossRef CAS.
- C.-Z. He, H. Wang, L.-Y. Huai and J.-Y. Liu, J. Phys. Chem. C, 2012, 116, 24035–24045 CrossRef CAS.
Footnote |
| † Electronic supplementary information (ESI) available. See DOI: 10.1039/d0ra06319c |
| This journal is © The Royal Society of Chemistry 2020 |

