
 Open Access Article
 This Open Access Article is licensed under a Creative Commons Attribution-Non Commercial 3.0 Unported Licence
Fabrication of a reversible thermochromism based temperature sensor using an organic–inorganic composite system
Sunita Mehta†‡
 *,
Ashok Kushwaha†,
Ravinder Reddy Kisannagar and
Dipti Gupta
*,
Ashok Kushwaha†,
Ravinder Reddy Kisannagar and
Dipti Gupta
Plastic Electronics and Energy Laboratory, Department of Metallurgical Engineering and Materials Science, Indian Institute of Technology Bombay, Mumbai-400076, India. E-mail: sunita.materials@gmail.com
First published on 3rd June 2020
Abstract
Temperature is considered a crucial physical parameter for several applications ranging from our day to day life to industrial applications. Studies have been reported to monitor the temperature by using various methods. Here, the present study demonstrates the fabrication of a simple and inexpensive temperature sensor based on the phenomenon of thermochromism, that is, the temperature can be monitored by the visual change in the sensor's color without using any additional circuitry. The mechanism of color change is associated with the difference in the coordination number of the complex compound due to the loss of crystal water in the organic–inorganic composite system. The screen printing process has been used to fabricate thin films of varying compositions in order to optimize the thermochromism in the temperature range of interest. Moreover, the reversibility of the color with a decrease in temperature allows the reusability and longevity of the sensor thus developed.
1 Introduction
Generally, all kinds of materials around us change size, shape or form as temperatures rise and fall. The simplest gadget based on this idea is a thermometer, where we can monitor temperature using a metal that expands on heating and contracts when cooled. Some materials even respond dramatically to the change in temperature by changing their color, the phenomenon termed “Thermochromism”.1,2 These thermochromic materials can find applications either as molecular switches or sensors.3–5 There are a variety of materials available that can show this property. Liquid crystals and leuco dyes are widely known materials for displaying these properties.6–9 In the case of liquid crystals, molecules are arranged in layers pointing towards a specified direction and reflecting the light of specific wavelength. With the change in temperature, the spacing between the layers is changed which changes the wavelength of the reflected light and hence the color. On the other hand, in case of leuco dyes, the color change is associated with the structural changes taking place in the materials with change in temperature.There is also a significant interest in developing the thermochromism phenomenon in transition metal-based complexes.10 These complexes can exist in variable valance states and each valance state corresponds to a different color. The examples of these complexes include copper-based, manganese based and vanadium based salts or their combinations.10 The origin of thermochromism ranges from phase transitions in a compound (e.g., in an organic chromophore) to changes in ligand geometry or the number of solvent molecules in the coordination sphere (e.g., in a pure transition metal complex that derives its color from crystal field effects).
Recently, some studies have been reported to demonstrate thermochromic materials and these materials include – type II metallopolymer consisting of a fluorene derivative polymer complexed with europium ions,11 cobalt(II) chloride complexes in ammonium nitrate + N-methylformamide mixture,12salicylaldehyde Schiff bases through the substitution of methoxy and nitro groups13 as well as polymer films doped with pyridyl-β-diketonate boron(III) complexes.14
There are also available some commercial products to monitor temperature based on thermochromism including forehead thermometer strips,15 Thermometer-Band FeverScan16 as well as self adhesive high temperature sensor thermochromic stickers (Shenzhen AKS Technology Co. Ltd).17
In the present study, we report the fabrication of reversible thermochromic films based on an organic polymer and a transition metal salt. Polyethylene dioxythiophene–polystyrene sulphonate (PEDOT:PSS) has been used as a base material as its electrical and optical properties can be tuned by using different factors such as temperature, doping, solvents, and others.18 To observe a direct visual change in the temperature, here we have engineered PEDOT:PSS in such a way that it shows thermochromism over a range of temperatures from 40 °C to 90 °C. As a substrate, we have employed commonly used and easily available polymer polyethylene terephthalate (PET, thickness 100 μm). The screen printing process has been used to fabricate films of varying salt composition to optimize thermochromism. The flexible films thus formed can be directly attached to any surface and facilitate the information about the surface temperature by its specific color. A hydrated salt of copper chloride (CuCl2·2H2O) has been used as an additive in PEDOT:PSS as it changes color when dehydrated. Thin films of varying concentrations of copper salt in the polymer have been prepared by using the screen printing process. The change in the color of these films is examined by varying the substrate temperature.
2 Experimental procedure
2.1. Materials
PEDOT:PSS, purchased from Sigma Aldrich, (concentration-5 wt%, resistance-50–150 Ω sq−1, viscosity-30![[thin space (1/6-em)]](https://www.rsc.org/images/entities/char_2009.gif) 000–90000 mPa s), copper chloride dihydrate CuCl2·2H2O (Merck, 98.5%), a screen of mesh count 160.
000–90000 mPa s), copper chloride dihydrate CuCl2·2H2O (Merck, 98.5%), a screen of mesh count 160.
2.2. Methods
In the preliminary experiments, 0.1 M aqueous solution of copper chloride dihydrate is prepared in DI water, termed as CS. Thin films of PEDOT:PSS are prepared by using the screen printing process on a PET substrate with a screen of mesh count 160. The schematic for the process is shown in Fig. 1a. The films thus prepared are annealed at 120 °C for 20 minutes and immersed in the prepared CS solution (0.6 g ml−1) for 2 to 3 hours. Followed by that, the films are rinsed with water and dried with nitrogen flow. The films are then examined for the visual color variation with a change in temperature.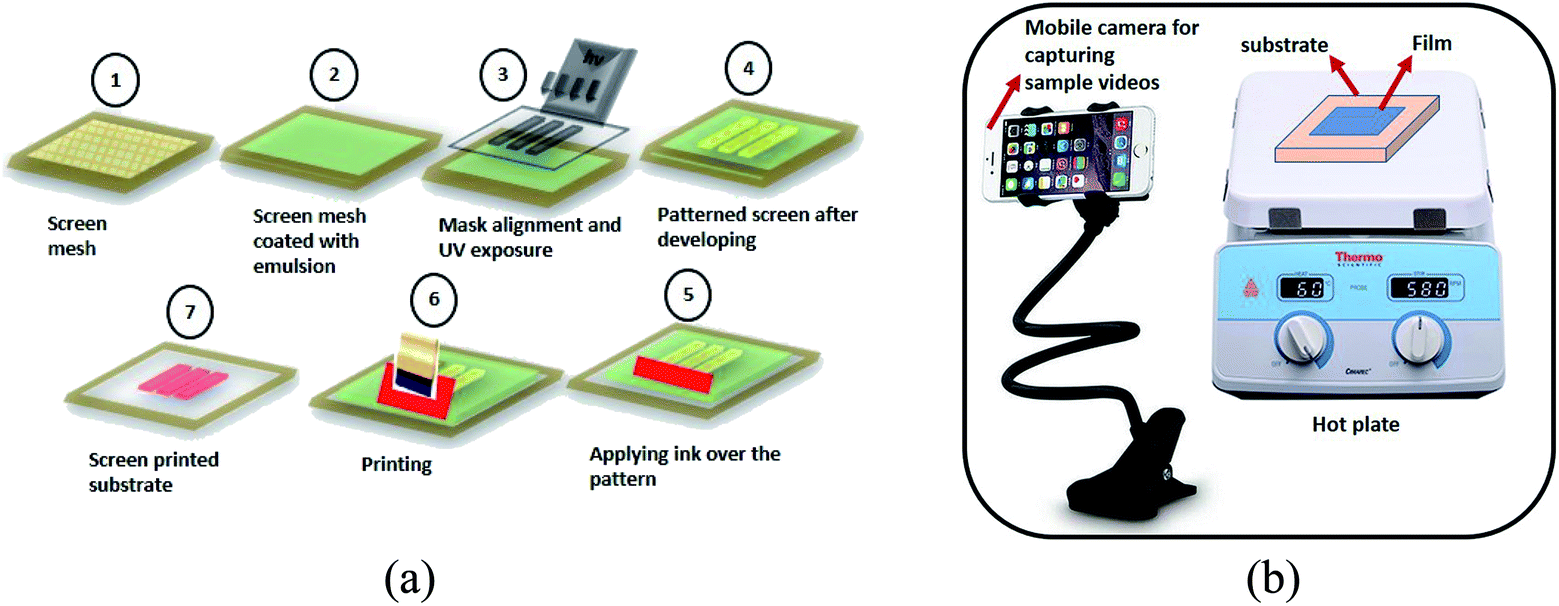 | ||
| Fig. 1 (a) Schematic for screen printing process (1) screen mesh stretched onto a frame (2) mesh coated with emulsion (3) selective exposure to UV using mask alignment (4) patterned screen after developing and washing away the unexposed emulsion (5) applying ink over the pattern (6) screen printing with the help of squeeze (7) screen printed substrate; (b) experimental set up used for observing the film color with variation in temperature – an android phone fixed to the phone stand is used to capture the sample video while increasing the hot plate temperature. | ||
In another set of experiments, varying volumes (0.1 ml and 0.2 ml) of CS solution of varying concentrations (0, 0.6 and 1.0 g in DI water) are mixed in PEDOT:PSS (0.5 g) and screen printed on PET sheets. The distance between the screen and substrate is set to 3 mm, to get uniform printed films. The films thus prepared are annealed at 120 °C for 20 minutes. The double-layer printing is also performed for the samples with higher concentrations. The experimental design is briefly described in Table 1.
| Sample name | Stock solution | Volume of stock solution | No. of printing layers |
|---|---|---|---|
| A1_0.6_0.1 | 0.6 g ml−1 | 0.1 ml | Single |
| A1_0.6_0.2 | 0.6 g ml−1 | 0.2 ml | Single |
| B1_1_0.1 | 1 g ml−1 | 0.1 ml | Single |
| B2_1_0.1 | 1 g ml−1 | 0.1 ml | Double |
| C1_1_0.2 | 1 g ml−1 | 0.2 ml | Single |
| C2_1_0.2 | 1 g ml−1 | 0.2 ml | Double |
For observing the thermochromism phenomenon, the films are kept on the hot plate and temperature is varied from 40 °C to 90 °C in steps of 5 °C with a hold time of 2 minutes for every temperature. All the experiments are performed in the same humid environment to maintain consistency.
2.3. Characterization
The optical images of the thin film samples are observed for studying the morphological changes produced in the films with varying concentrations of CS. The transmission spectra of the films are studied by using UV visible absorption spectroscopy (Jasco International Pvt. Ltd).In order to discern the molecular changes associated with the thermochromism phenomenon in the samples, in situ vibration spectra and XRD spectra are examined using Fourier Transform Infra-red spectroscopy (FTIR), (Bruker, Germany) and X-ray Diffraction (XRD), (Rigaku Japan) techniques respectively.
Further, as an alternative way of characterizing and analyzing thermochromism, the corresponding videos of the samples with in situ heating are captured. A regular (Android) mobile phone with 13 MP camera is used for this purpose. The snapshot images from the videos are collected at particular time intervals corresponding to particular temperatures. The images are then analyzed for their RGB values by image processing through MATLAB software (R2018b). All the videos are captured with the same optical zoom and same phone angle with respect to the films.
3 Results and discussion
In the preliminary experiments performed, the screen printed PEDOT:PSS films are immersed in CS solution for 2–3 hours, and after rinsing and drying with N2, examined for color variation with change in temperature. It is found that the color of the sample changes from blue to green with a transition temperature of 60 °C (results not shown here). Further to simplify this two-step process, a defined volume of CS with specified concentration is introduced into the PEDOT:PSS directly.The chemistry behind the observed thermochromism phenomenon is the conversion of the hexahydrate complex of copper salt present in the film to quarter hydrate complex molecule, because of the loss of water of crystallization molecules with heating.19
At room temperature, copper in the film is present in the form of hexaaquacopper(II) complex,
| Cu2+ + 6H2O → [Cu(H2O)6]2+ | (1) |
And on heating, it gets converted into tetrachlorocuprate(II) complex.
| [Cu(H2O)6]2+ + 4Cl− ⇄ [CuCl4]2− + 6H2O | (2) |
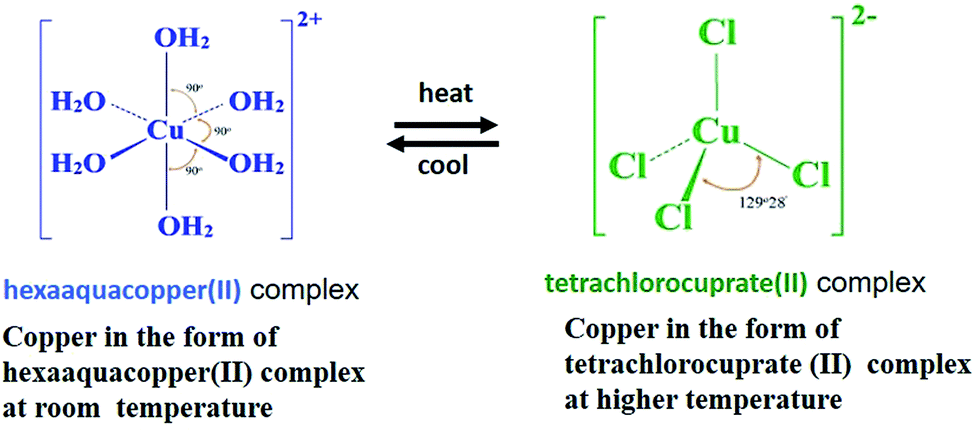
Further, the reversible nature of this reaction, allows this complex to return to its hexaaquacopper(II) complex with decrease in temperature and hence brings back the original color of the film.
In the literature, pristine films of PEDOT:PSS prepared by layer by layer self-assembly method have been reported to show thermo-chromic behavior.20 The electron delocalization of π-conjugated PEDOT backbones as well as their capability to undergo conformation changes are the mechanisms associated with this thermochromism behavior.
Therefore, in our experiments, screen printed film of the base material, PEDOT:PSS, is monitored for a change in color with temperature variation. But, it is observed that the color of the film remains invariant with the change in temperature (Fig. 2).
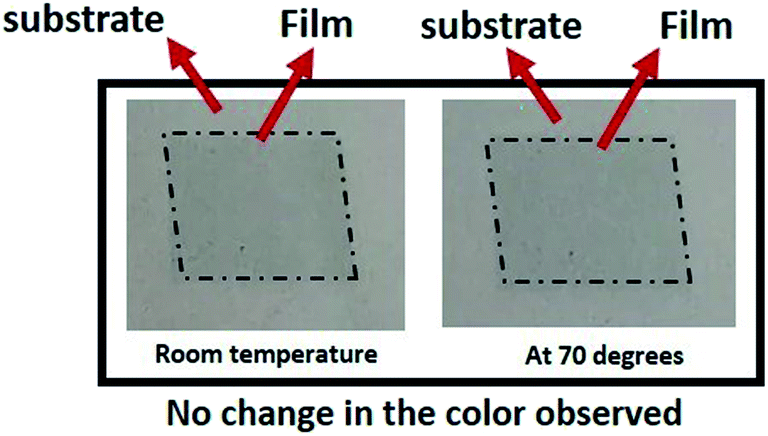 | ||
| Fig. 2 The screen printed film of pristine PEDOT:PSS at room temperature and at temperature = 70 °C. | ||
With the introduction of CS into PEDOT:PSS, Cu2+ cations bind to the negatively charged PSS chains and anions have coulombic interactions with positively charged PEDOT chains.21 Thus, the presence of this salt results into the screening of the charges of PEDOT and PSS entities facilitating the phase separation between the conducting PEDOT and non-conducting PSS chains. This allows freedom for the electron delocalization of π-conjugated backbones and hence resulting in thermochromic behavior.
Further, this phase separation of PEDOT and PSS chains with the addition of salts have also been shown to enhance the electrical conductivity of the films.21 But in our experiments, no change in the films'electrical properties is observed with and without the introduction of CS (results not shown here). The possible reason for the same might be that the concentration of the CS used here is too low to significantly impact the electrical properties of the films.
3.1. Morphological observation
The optical images of the films are observed for examining the morphological changes associated with the compositional variations and number of printed layers. The optical images are shown in Fig. 3. The pristine PEDOT:PSS film is smooth enough in morphology (Fig. 3a). The introduction of copper salt, as in sample, B1_1_0.1 results into the formation of small crystallites in the film (Fig. 3b) and as the number of printed layer is doubled (sample B2_1_0.1), crystallites are grown to a larger size (Fig. 3c) with the agglomeration of the particles. Further, when the volume of the CS added is increased, as in sample C1_1_0.2, the concentration of copper crystal is increased resulting into the dendritic structure of the copper crystals in the film (Fig. 3d). With the double layer printing, the particles are agglomerated resulting in thicker dendrites as shown in Fig. 3e.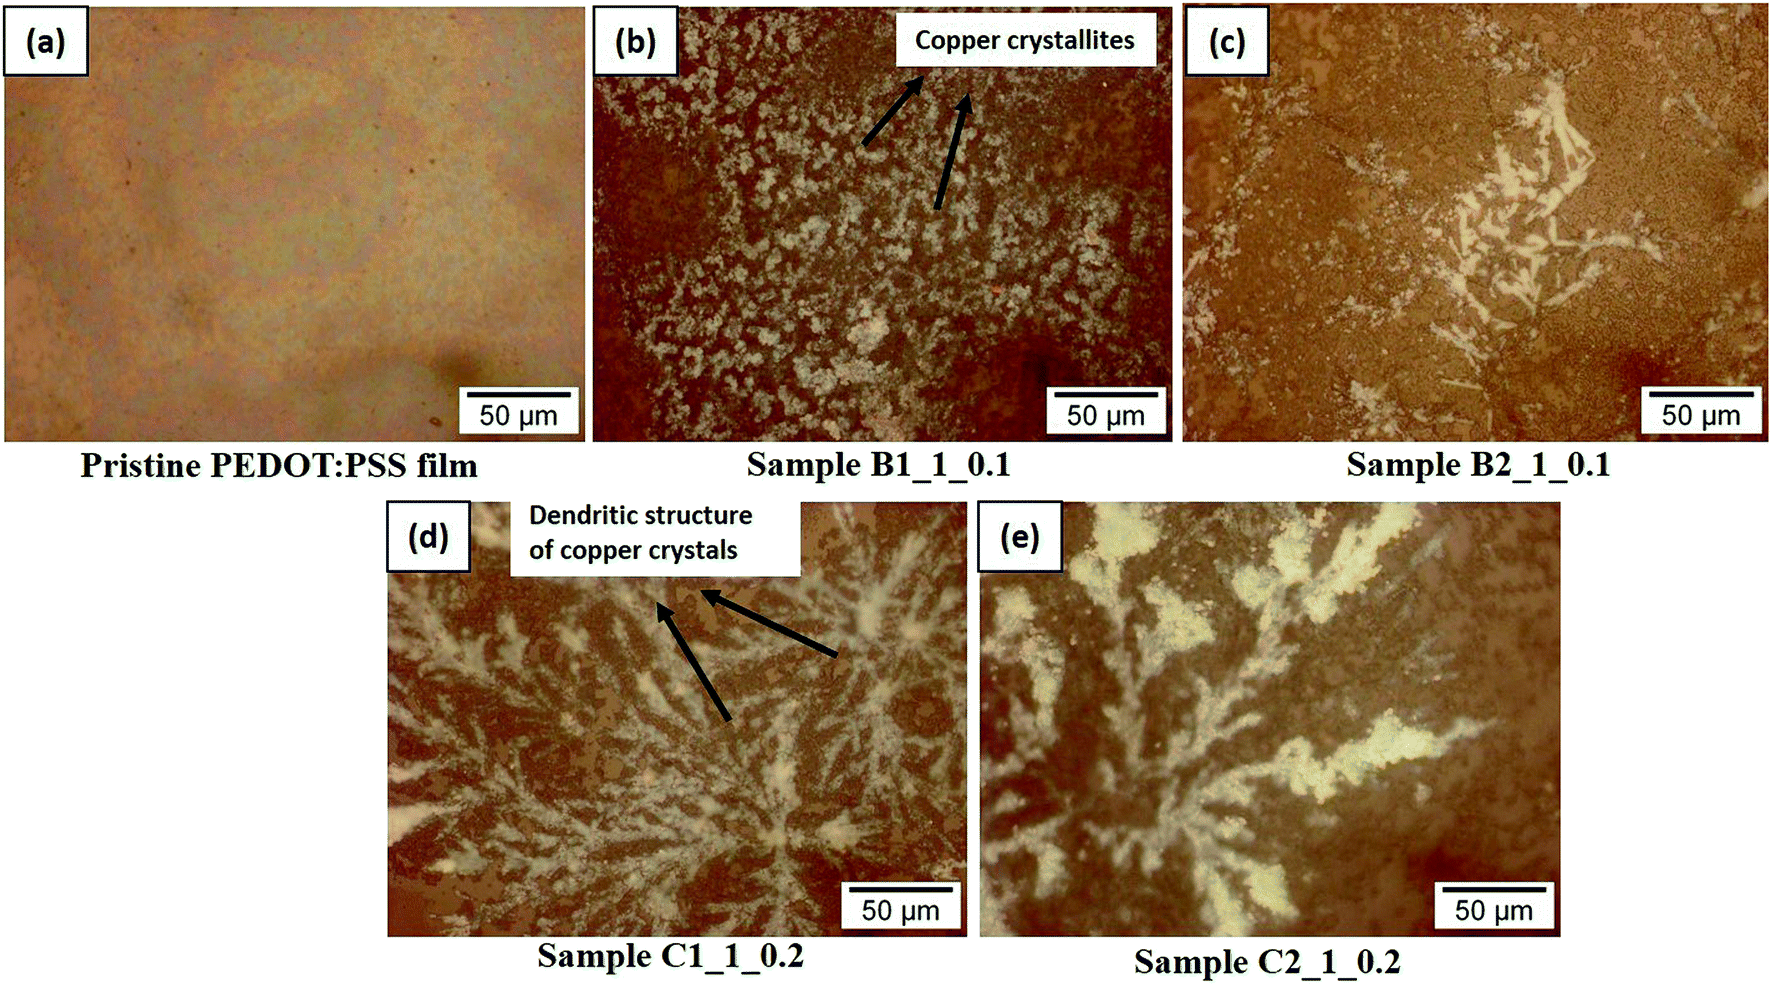 | ||
| Fig. 3 The optical images of the screen printed films (a) pristine PEDOT:PSS films termed as P0 (b) sample B1_1_0.1 (c) sample B2_1_0.1 (d) sample C1_1_0.2 (e) sample C2_1_0.2. | ||
3.2. UV visible spectroscopy
The optical properties of the conducting polymers are attributed to the conjugation, that is, the delocalization of the lowest binding energy π states of aromatic units.22,23 The external stimuli lead to the conformal changes which correspond to the different phases of the same system. When copper salt (CS) solution is introduced into the polymer, corresponding ions induce a change in the geometry of aromatic backbones and hence affect the optical properties of polymer.21Fig. 4 shows the transmission spectra for thin film samples at varying temperatures – room temperature (denoted as RT), 60 °C (denoted as T60) and 80 °C (denoted as T80). In the case of films of pristine PEDOT:PSS, (denoted as P0), there is no variation in the spectra with respect to temperature as shown in Fig. 4a. With the introduction of CS solution (1 g ml−1), a broad spectrum is observed in the wavelength region 450–750 nm (Fig. 4b). There is a slight shift in the spectrum at a temperature of 80 °C. Further, the transmittance value decreases by 26% with an increase in temperature.
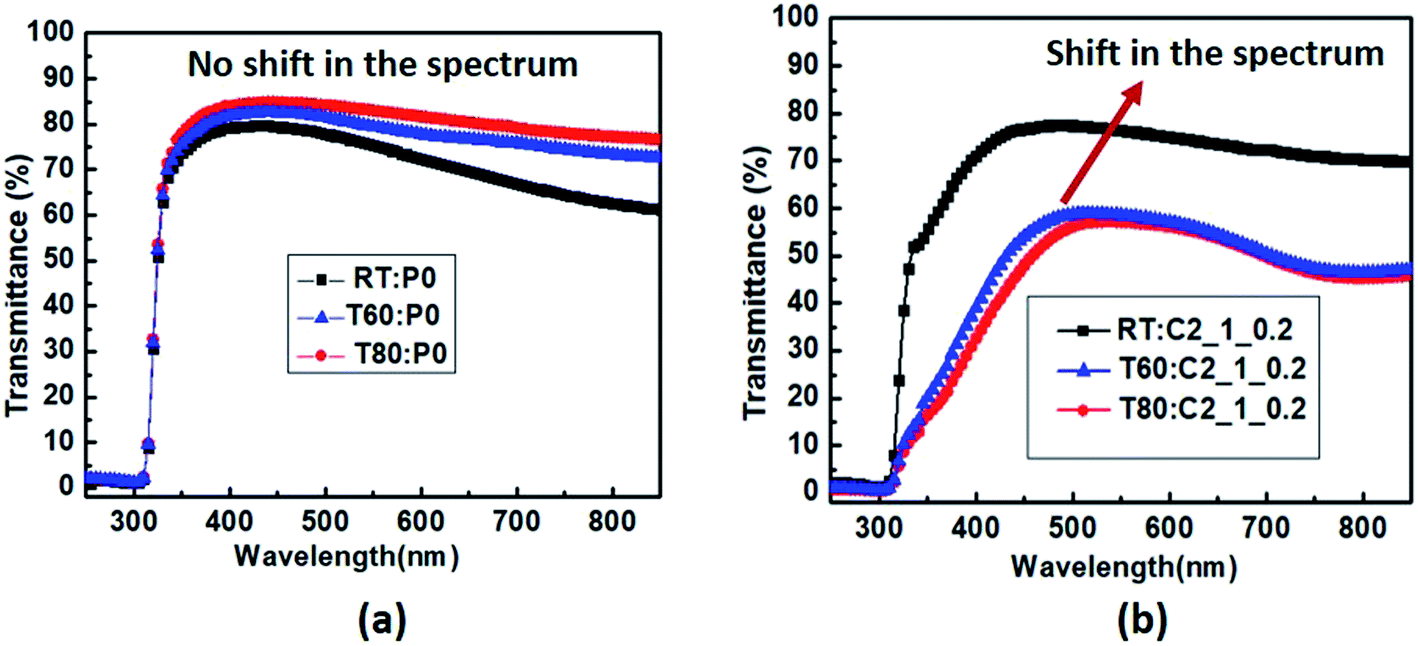 | ||
| Fig. 4 Transmission spectra for thin film samples at varying temperatures – room temperature (denoted as RT), 60 °C (denoted as T60) and 80 °C (denoted as T80) for (a) pristine PEDOT:PSS film (b) sample C2_1_0.2. | ||
3.3. XRD spectra
In order to observe the structural changes associated with the thermochromism phenomenon, temperature dependent XRD spectra of the samples are taken at the temperature ranges from 30 °C to 80 °C. XRD spectra for the sample C2_1_0.2 at varying temperatures is shown in Fig. 5. At room temperature, a highly intense peak observed at 2θ = 15.5° corresponds to the hydrated copper chloride (slightly shifted from the corresponding value of 16.24°, from ICSD data).24–27 As the temperature increases to 70 °C, there is a decrease in intensity of the peak at 2θ = 15.5°, whereas the peak at 2θ = 32.5°, becomes comparatively more intense, thus, confirming the dehydration of copper salt and hence the color change as described in eqn (2) above.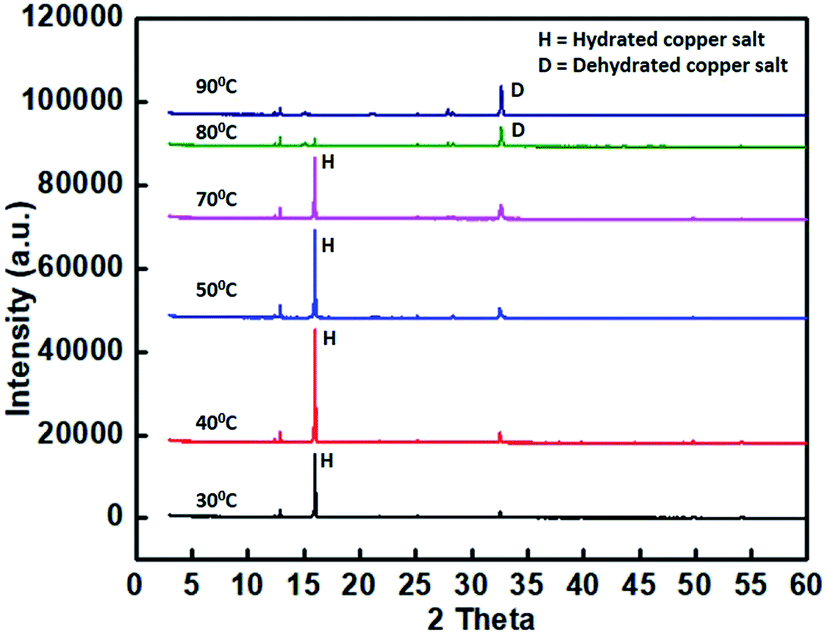 | ||
| Fig. 5 XRD spectra of sample C2_1_0.2 at varying temperatures. | ||
3.4. FTIR spectroscopy
Further to get insight into the thermochromism behavior observed, in situ vibration spectra of the samples are observed using FTIR. Fig. 6 shows the FTIR spectrum for the sample C2_1_0.2 with variation in temperature.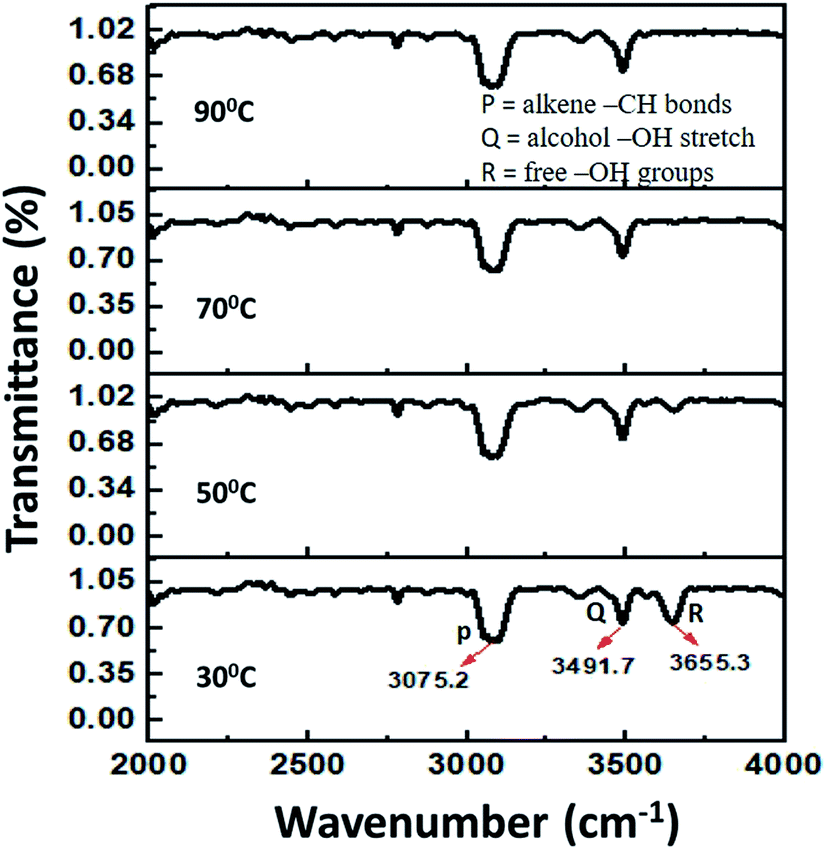 | ||
| Fig. 6 –FTIR spectra of sample C2_1_0.2 observed at varying temperatures. | ||
The peaks at 3075 cm−1, 3491 cm−1 and 3655 cm−1 are attributed to the alkene –CH bonds, alcohol –OH stretch and free –OH groups respectively.28,29 As we increase the temperature, the peak at 3655 cm−1 diminishes, thus confirming the dehydration of the sample and the associated color change with that.
3.5. In situ characterization method-image analysis for thermochromism
As an alternative way of characterizing and analyzing thermochromism, we have captured the videos of the samples while increasing the temperature on the hot plate (Fig. 1b). The temperature is increased from 40–90 °C in steps of 5 °C with a hold time of 2 min for each temperature. The snapshots of these videos are captured at the times corresponding to defined temperatures and analyzed for the color change with the variation of CS concentration, the volume of the CS and number of printing layers. These snapshot images are shown in Fig. 7.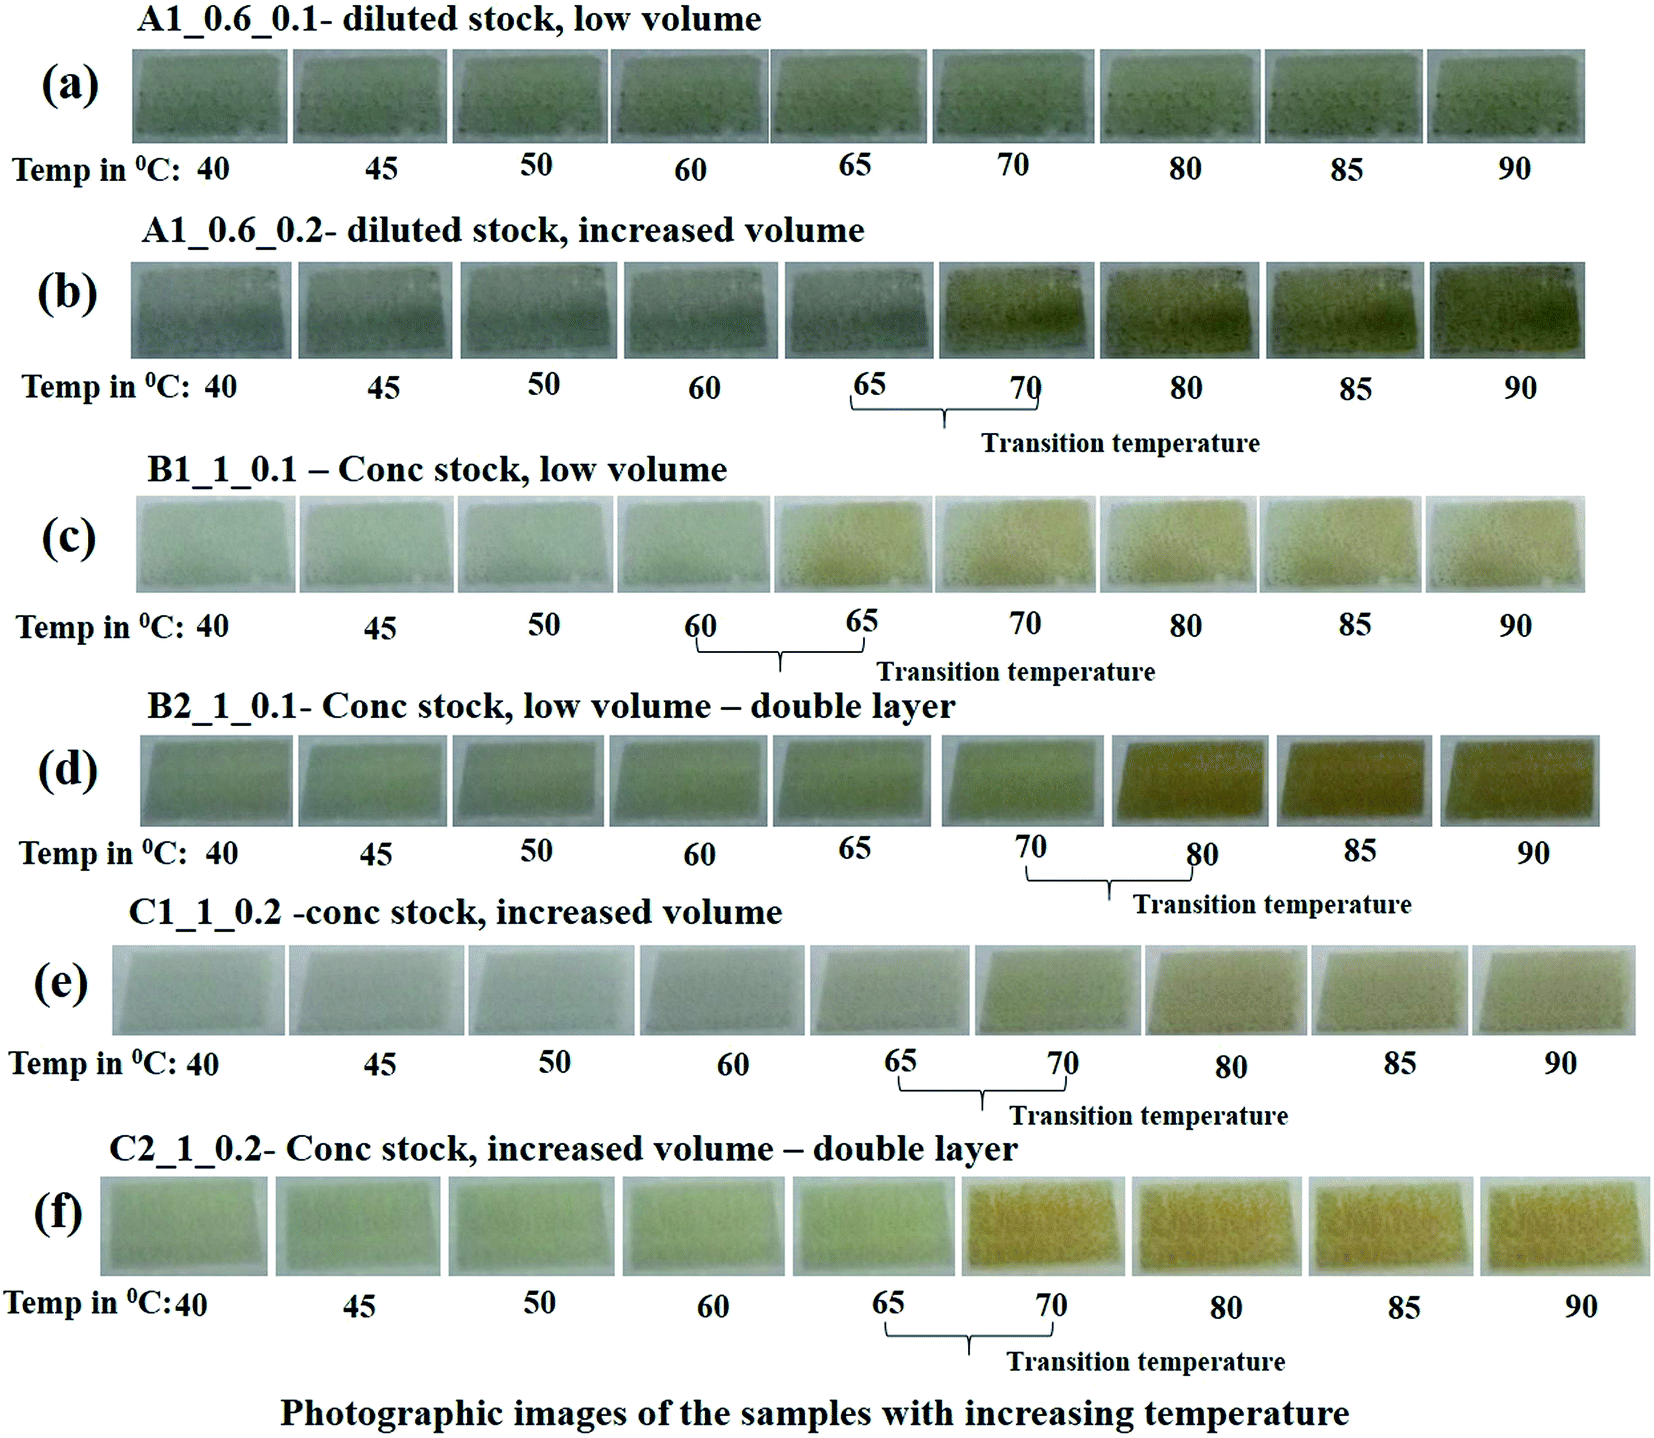 | ||
| Fig. 7 The photographic images of the samples (collected from the captured videos) heated at temperatures from 40–90 °C in steps of 5 °C. | ||
For samples with a lower concentration of CS (A1_0.6_0.1), the color change is not significant with increase in temperature. But as the volume of CS solution is increased (A1_0.6_0.2), the color of the film slightly turns to yellow at a temperature of 65 °C.
Further, by increasing the concentration of CS solution introduced into PEDOT:PSS (sample B1_1_0.1), the resulting films turn lighter in the color and a noticeable change to yellowish color is observed at transition temperature of 60 °C. When the same composition is printed into a double layer, the original color of the film becomes darker and transition temperature is shifted to 70 °C.
With increasing the volume of this concentrated CS solution (sample C1_1_0.2), the resulting films are lighter in color and show transition to yellow color at the temperature of 65 °C. Finally, when the same composition is printed to double layer (C2_1_0.2), the resulting films become comparatively darker and a prominent color change is visualized at the temperature of 65 °C.
3.6. Histograms of RGB coordinates
The images thus obtained are processed for their RGB values using MATLAB R2018b. Typically RGB values are encoded as 8 bit integers, with the pixel values ranging from 0–255.For this processing, the images are cropped to 400 × 500 pixels and analyzed for RGB coordinates by using a MATLAB code. The histograms of the red, green and blue coordinates of images at the varying temperatures are shown in Fig. 8a–c respectively. Labels T40–T90 denote the temperature and R, G, B denote red, green and blue channels respectively.
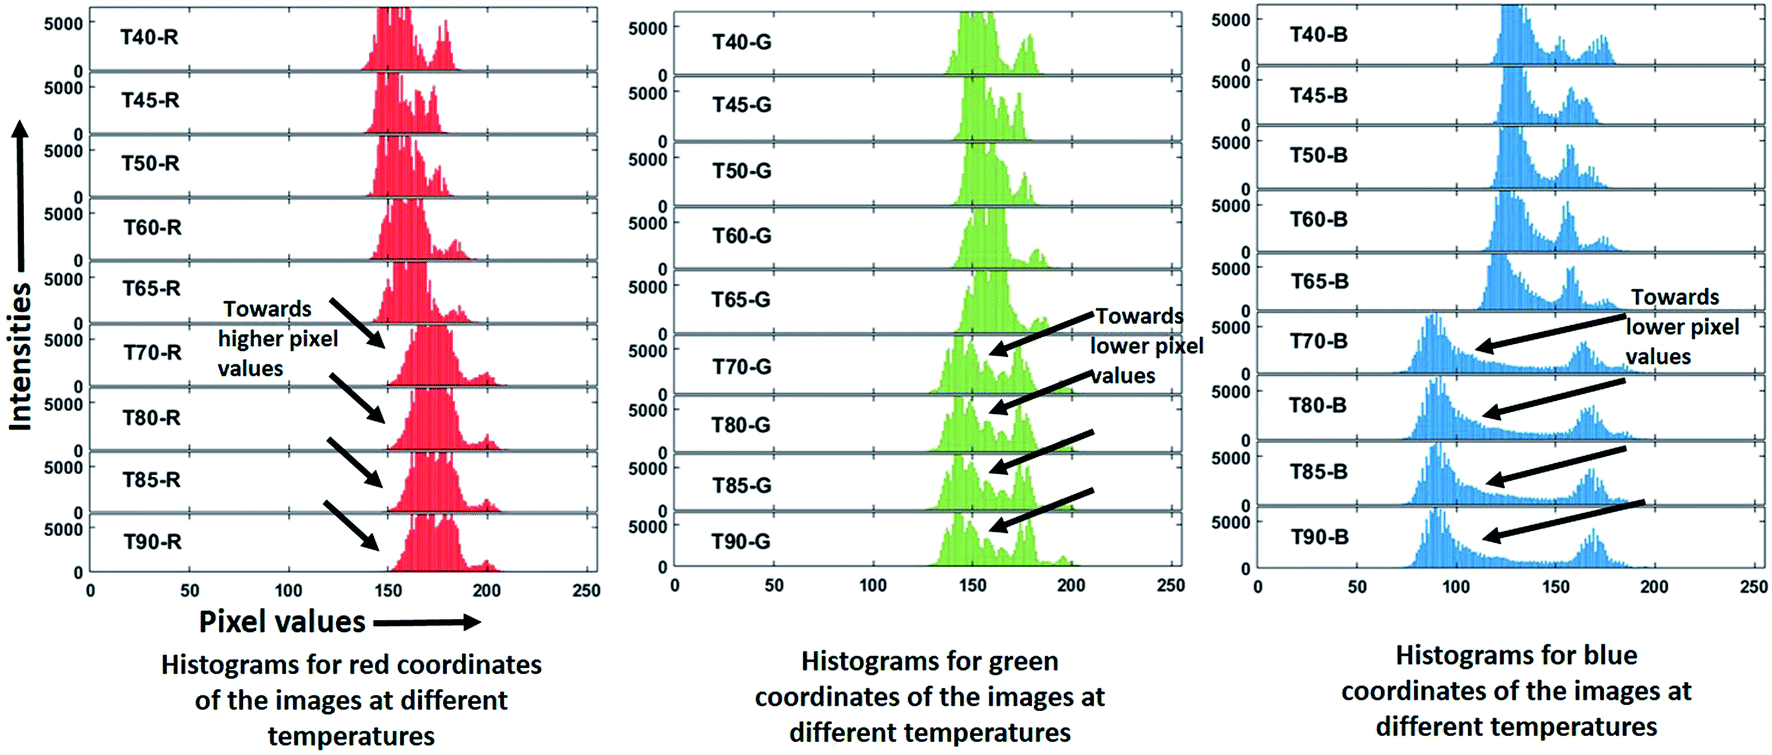 | ||
| Fig. 8 The histograms of (a) red (b) green and (c) blue coordinates of the images captured at varying temperatures for sample C2_1_0.2. X and Y-axes show the pixel values and their intensities respectively. | ||
It can be observed that as the temperature is increased above 65 °C, the histograms for the red color coordinates shift towards higher pixel values whereas for green and blue coordinates shift towards lower pixel values.
As a reference, RGB coordinates for a dark sea green color are 143-143-188, whereas for dark golden color are 184-134-11. Thus, while going from green to yellow, red pixel intensity increases whereas green and blue pixels' intensities decrease to a large extent.30
Thus, the image processing and hence the histogram shifting, here confirm the change in sample color from green to yellowish-brown with an increase in temperature as shown in Fig. 7f.
3.7. Demonstration for the reversibility of thermochromism phenomenon
The reversibility of the copper complexes from hexahydrate to quadrate as described in eqn (2), allows the screen-printed films to recover their original color with a decrease in temperature. Fig. 9 shows the demonstration of the reversibility of the color for the sample C2_1_0.2 as the temperature is decreased from 90 °C to 40 °C.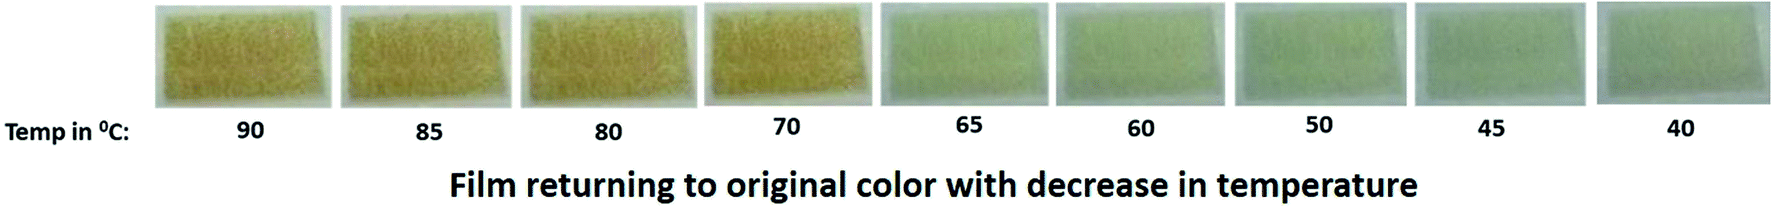 | ||
| Fig. 9 The reversible color change with a decrease in temperature for the sample C2_1_0.2. | ||
4 Conclusions
Herein, we have fabricated a simple and inexpensive temperature sensor, where temperature can be monitored by a visual color change of the films. Optimizations of salt concentration, the volume of the salt in the base material and printing layers are performed to observe the effect of these parameters on the sensor transition temperature.The films obtained with an increased volume of concentrated CS and double-layer printing provide a clear indication of color change with a transition temperature of 65 °C. Future directions in this work involve tuning the transition temperature by incorporating a mixture of transition metal salts thus enabling these sensors to be used in a wide range of applications. Further, the development of a mobile app with the inbuilt optimized software for direct conversion of RGB histogram of captured image into the corresponding temperature would allow this sensor to be available as a commercial product and then a fair comparison could be made with the already available sensors.
Author contributions
DG provided the basic idea and guidance during the work. SM and AK designed and conducted all the experiments. RRK contributed to performing the experiments and analyzing the results. All authors contributed to drafting the manuscript.Conflicts of interest
The authors declare no conflict of interest.Acknowledgements
Authors would like to acknowledge Science and Engineering Research Board, Govt. of India (PDF/2016/002795) for providing financial support. Authors would also like to acknowledge the Sophisticated Analytical Instrument Facility (SAIF) and Department of Metallurgical Engineering and Materials Science (MEMS) at the Indian Institute of Technology Bombay (IIT Bombay), Mumbai, for providing various facilities for fabrication and characterization of the samples.References
- J. H. Day, Chem. Rev., 1963, 63, 65–80 CrossRef CAS.
- M. A. White and M. LeBlanc, J. Chem. Educ., 1999, 76, 1201–1205 CrossRef CAS.
- V. Balzani, A. Credi and M. Venturi, Molecular Devices and Machines: Concepts and Perspectives for the Nanoworld, Wiley, Weinheim, 2nd edn, 2003 Search PubMed.
- J. C. Crano and R. Guglielmetti, Organic Photochromic and Thermochromic Compounds: Volume 2: Physicochemical Studies, Biological Applications, and Thermochromism, Kluwer Academic/Plenum, New York, 1999, pp. 415–466 Search PubMed.
- K. Maeda, J. Synth. Org. Chem., Jpn., 1986, 44, 431–442 CrossRef CAS.
- H. Tang, D. C. MacLaren and M. A. White, Can. J. Chem., 2010, 88, 1063–1070 CrossRef CAS.
- C. F. Zhu and A. B. Wu, Thermochim. Acta, 2005, 425, 7–12 CrossRef CAS.
- M. Jakovljević, B. Lozo and K. G. Marta, 32nd International Conference on Digital Printing Technologies (NIP): Printing for Fabrication, IS&T, Manchester, UK, 2016, pp. 325–328 Search PubMed.
- LCR Hallcrest, Handbook of Thermochromic Liquid Crystal Technology, 2014, pp. 1–36 Search PubMed.
- J. H. Day, Chem. Rev., 1968, 68(6), 649–657 CrossRef CAS.
- D. A. Turchetti, A. J. Santana, L. G. T. A. Duarte, T. D. Z. Atvars, R. A. Domingues and L. Akcelrud, Polymer, 2019, 177, 65–72 CrossRef CAS.
- S. Belić, M. Vraneš, S. Papović, J. Magyari, M. Rodić and S. Gadžurić, J. Mol. Liq., 2019, 282, 264–274 CrossRef.
- M. Shi, C. Xu, Z. Yang, L. Wang, S. Tan and G. Xu, J. Mol. Struct., 2019, 1182, 72–78 CrossRef CAS.
- R. Jiménez, F. Duarte, S. Nuti, J. A. Campo, C. Lodeiro, M. Cano and C. Cuerva, Dyes Pigm., 2020, 177, 108272 CrossRef.
- https://www.amazon.com/Hassle-Free-Thermometer-Travel-Sized-Reusable-Children/dp/B01MQ4CHDR.
- https://www.wadd.com.au/thermometer-band-feverscan.
- https://akstech.en.alibaba.com/product/60712770494-219302200/Self_adhesive_high_temperature_sensor_thermochromic_stickers.html.
- J. Ouyanga, Q. Xua, C.-W. Chua, Y. Yanga, G. Lib and J. Shinarb, Polymer, 2004, 45, 8443–8450 CrossRef.
- R. D. Willett, J. A. Haugen, J. Lebsack and J. Morrey, Inorg. Chem., 1974, 13, 2510–2513 CrossRef CAS.
- O. I. Konopelnyk, O. I. Aksimentyeva, Y. Y. Horbenko, D. O. Poliovyi and I. Y. Opaynych, Mol. Cryst. Liq. Cryst., 2016, 640, 158–164 CrossRef CAS.
- Z. Zhao, Q. Wu, F. Xia, X. Chen, Y. Liu, W. Zhang, J. Zhu, S. Dai and S. Yang, ACS Appl. Mater. Interfaces, 2015, 7, 1439–1448 CrossRef CAS PubMed.
- O. Inganas, G. Gustafsson, W. R. Salaneck, J. E. sterholm and J. Laaks, Synth. Met., 1989, 28, C377–C384 CrossRef.
- W. R. Salaneck, O. Inganäs, B. Thémans, J. O. Nilsson, B. Sjögren, J.-E. Österholm, J. L. Brédas and S. Svensson, J. Chem. Phys., 1988, 89, 4613 CrossRef CAS.
- L. Wang, K. Zhang, Z. Hu, W. Duan, F. Cheng and J. Chen, Nano Res., 2014, 72, 199–208 CrossRef.
- F. E. O. Medeiros, B. S. Araújo and A. P. Ayala, Vib. Spectrosc., 2018, 99, 1–6 CrossRef CAS.
- S. A. Saraireh and M. Altarawneh, J. Nanomater., 2012, 2012, 7 Search PubMed.
- J. Li, J. Liu, C. Gao, J. Zhang and H. Sun, Int. J. Photoenergy, 2009, 2009, 650509 Search PubMed.
- R. H. P. Devamani and M. Alagar, Nano Biomed. Eng., 2013, 5, 116–120 Search PubMed.
- R. LFrost and J. TheoKloprogge, Spectrochim. Acta, Part A, 1999, 55, 2195–2205 CrossRef.
- M. J. Kangas, R. M. Burks, J. Atwater, R. M. Lukowicz, P. Williams and A. E. Holmes, Crit. Rev. Anal. Chem., 2017, 47, 138–153 CrossRef CAS PubMed.
Footnotes |
| † Authors contributed equally. |
| ‡ Present address-Central Scientific and Industrial Organization Chandigarh, 160030, India. |
| This journal is © The Royal Society of Chemistry 2020 |