 Open Access Article
Creative Commons Attribution 3.0 Unported Licence
Synthesis, local structure and optical property studies of α-SnS microrods by synchrotron X-ray pair distribution function and micro-Raman shift
U. P. Gawai *a,
D. K. Gaikwadb,
S. L. Patila,
K. K. Pandeyc,
N. P. Lallad and
B. N. Dole
 e
e
aDepartment of Physics, YCSPM's, DDSP, Arts Commerce and Science College, Erandol, Jalgaon-425109, India. E-mail: upgawai.phys@gmail.com
bDepartment of Physics, ACS College, Dharangaon-425105, India
cHigh Pressure & Synchrotron Radiation Physics Division, Bhabha Atomic Research Centre, Mumbai, M.S., India
dUGC-DAE CSR, University Campus, Khandwa Road, Indore-452017, India
eAdvanced Materials Research Laboratory, Department of Physics, Dr Babasaheb Ambedkar Marathwada University, Auranagabad-431004, M.S., India
First published on 3rd June 2020
Abstract
A hydrothermal synthesis method was employed for the preparation of tin sulfide (α-SnS) microrod samples (SnS-A and SnS-B) using ethylenediamine and deionized water as the surfactant at ratios from 50![[thin space (1/6-em)]](https://www.rsc.org/images/entities/char_2009.gif) :
:![[thin space (1/6-em)]](https://www.rsc.org/images/entities/char_2009.gif) 50 to 100
50 to 100![[thin space (1/6-em)]](https://www.rsc.org/images/entities/char_2009.gif) :
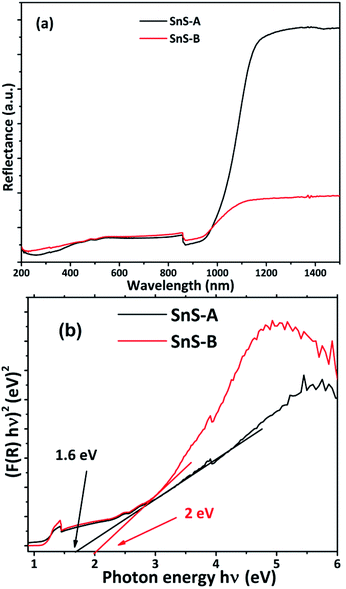
:![[thin space (1/6-em)]](https://www.rsc.org/images/entities/char_2009.gif) 00. The atomic structures of the α-SnS microrods were studied using atomic pair distribution function (PDF) analysis and total synchrotron X-ray scattering data. The synchrotron X-ray diffraction (ScXRD) patterns and PDF data reveal that the structure of the SnS microrods is orthorhombic. From the refinement of the PDF, the first and second peaks correspond to nearest (Sn2+–S2−) and second nearest distances (Sn2+–Sn2+) of 2.546 (0.003) Å and 4.106 (0.004) Å, and 2.527 (0.005) Å and 4.087 (0.006) Å for SnS-A and SnS-B samples, respectively. The TEM results show that samples SnS-A and SnS-B have a microrod structure, with microrod diameters of 800 nm and 500 nm with lengths of tens of micrometers, respectively. The SnS-A and SnS-B samples show a direct band gap of 1.6 eV and 2 eV, respectively, using the Kubelka–Munk transformation of the UV-visible spectra. The micro-Raman spectra of the SnS-A and SnS-B microrods exhibited an Ag mode of SnS at 228.4 and 223 cm−1, respectively. The second peaks at 306.7, and 309 cm−1 are associated with the secondary phases of the SnS2 phase, whereas the third broad peaks at 616.5, and 613 cm−1 revealed that there was a deformation mode of sulfate in the SnS-A and SnS-B samples.
00. The atomic structures of the α-SnS microrods were studied using atomic pair distribution function (PDF) analysis and total synchrotron X-ray scattering data. The synchrotron X-ray diffraction (ScXRD) patterns and PDF data reveal that the structure of the SnS microrods is orthorhombic. From the refinement of the PDF, the first and second peaks correspond to nearest (Sn2+–S2−) and second nearest distances (Sn2+–Sn2+) of 2.546 (0.003) Å and 4.106 (0.004) Å, and 2.527 (0.005) Å and 4.087 (0.006) Å for SnS-A and SnS-B samples, respectively. The TEM results show that samples SnS-A and SnS-B have a microrod structure, with microrod diameters of 800 nm and 500 nm with lengths of tens of micrometers, respectively. The SnS-A and SnS-B samples show a direct band gap of 1.6 eV and 2 eV, respectively, using the Kubelka–Munk transformation of the UV-visible spectra. The micro-Raman spectra of the SnS-A and SnS-B microrods exhibited an Ag mode of SnS at 228.4 and 223 cm−1, respectively. The second peaks at 306.7, and 309 cm−1 are associated with the secondary phases of the SnS2 phase, whereas the third broad peaks at 616.5, and 613 cm−1 revealed that there was a deformation mode of sulfate in the SnS-A and SnS-B samples.
Introduction
Tin sulfide (SnS) has attracted much attention in recent years due to its narrow bandgap that displays optical activity in the near-infrared (NIR) region, with potential applications in photovoltaic devices and NIR detectors.1,2 Tin sulfide is one of the most abundant, cheapest, eco-friendly and, due to its direct band gap, is used for applications in solar cells,3 lithium storage,4 hydrogen storage,5 thermoelectric and photonic devices6 and so on. Tin sulfide has two structures one is π-SnS cubic and the other is an α-SnS orthorhombic structure. Orthorhombic SnS crystallizes in space group Pnma in the GeS (B16) type structure with lattice parameters of a = 11.200(2) Å, b = 3.987(1) Å and c = 4.334(1) Å.6 The Sn and S occupy the Wyckoff position 4c (x, 1/4, z) with fractional coordinates of x = 0.1194(1), z = 0.1198(2) for tin and x = 0.8508(3), z = 0.4793(8) for sulfur.6A large amount of research is carried out on the synthesis and characterization of 1D well-designed SnS materials.4,7 The 1D structure can be fabricated by number of techniques, such as surfactant-assisted techniques,8 hydrothermal methods,9 noncovalent self-assembly,10 chemical vapor deposition,11 thermal decomposition,12 and so on. However, further development of these techniques for practical routes to make large quantities of materials with a porous 1D structure with accurate size, shape control, rapidly and reasonably low costs, are still a great challenge.
The determination of the crystalline structure of a solid is a key part of materials' science, and for this, the powder diffraction method is widely used. It is an excellent method but challenges exist when determining the local structures of complex materials. Nowadays, synchrotron X-ray diffraction (ScXRD) with fast computing methods has been used for the determination of the atomic-scale structure of materials. The ScXRD with a pair distribution function (PDF) is one of the most powerful tools for determining the local structure of atoms with shorter and moderate lengths.13,14 The PDF is one of the most versatile methods which can be applied to any materials.15–17 This method has numerous applications for the analysis of the structures of materials for determining crystal phase and unit-cell parameters and for quantifying various types of disorder or defects.18–20 The PDF gives a histogram of interatomic separations in a crystal/material and represents a weighted bond length distribution. The Bragg peaks arise due to the translational symmetry present in the samples.
The total scattering technique, which outlines the Bragg peaks with their position and intensity, reveals the structure, and diffuse scattering with deviation gives a perfect lattice. The PDF G(r) is a 1D function that oscillates around zero and indicates, via the peak positions, the distances of separation of pairs of atoms. The peak positions of the PDF correspond to the distribution of the distances in the material. A negative valley in the PDF corresponds to the real-space vector not having atoms at either end, and for this reason, the PDF resembles a Patterson function and is therefore widely applicable for X-ray crystallography studies. Fourier analysis of the total scattering is known as atomic PDF analysis, meaning that the PDF is the Fourier transform of the scattering intensity.19,20 Recently, rapid developments in science and technology have posed new challenges for the study of atomic-scale structures using ScXRD. Because of the crystallinity of certain materials, it does not always act as a perfect grating, therefore the ScXRD patterns can show both Bragg peaks and diffuse components.17–21 The PDF uses both the Bragg peaks and diffuse components to reveal the total scattering in the ScXRD data. The PDF is obtained from a total scattering powder diffraction pattern via a Fourier transform analysis, because the total scattering pattern is composed of Bragg peaks as well as diffuse scattering contributions. The PDF peak position contributes to the average distance separation of the pair, and its integrated intensity reveals the number of coordinate atoms, and its width and shape indicate the static or dynamic disorder in the pair.22–24 Also Raman spectroscopy is a vibrational technique routinely used to provide local structural information at the atomic scale. Herein, the hydrothermal synthesis of α-SnS microrods using ethylenediamine the surfactant is reported. Also, different studies were carried out on the α-SnS microrods, such as ScXDR, PDF, transmission electron microscopy (TEM), micro-Raman and UV-Vis spectroscopy.
Experimental details
A hydrothermal synthesis method was employed for the synthesis of the SnS-A and SnS-B microrods. In a typical synthesis process, a 100 ml Teflon-lined stainless steel autoclave was used. All of the chemicals were analytical grade and used without any further purification. The appropriate amount of tin chloride dihydrate (SnCl2·2H2O, 0.1 M), and thiourea (0.2 M) was dissolved separately in a 50![[thin space (1/6-em)]](https://www.rsc.org/images/entities/char_2009.gif) :
:![[thin space (1/6-em)]](https://www.rsc.org/images/entities/char_2009.gif) 50 and 0
50 and 0![[thin space (1/6-em)]](https://www.rsc.org/images/entities/char_2009.gif) :
:![[thin space (1/6-em)]](https://www.rsc.org/images/entities/char_2009.gif) 100 ratio of deionized (DI) water and ethylenediamine solution as surfactant. Then, these two mixtures were stirred for 20 min at room temperature and these white colored solutions were transferred separately to an autoclave. The autoclaves were sealed and kept on a hot plate at a temperature of 185 °C for 12 h and then allowed to cool naturally. During the formation of the SnS phase, the initial white color changes to a dark brown color. The product obtained was purified, washed several times with DI water, and then filtered. The final product was dried in air at 60 °C for 2 h.
100 ratio of deionized (DI) water and ethylenediamine solution as surfactant. Then, these two mixtures were stirred for 20 min at room temperature and these white colored solutions were transferred separately to an autoclave. The autoclaves were sealed and kept on a hot plate at a temperature of 185 °C for 12 h and then allowed to cool naturally. During the formation of the SnS phase, the initial white color changes to a dark brown color. The product obtained was purified, washed several times with DI water, and then filtered. The final product was dried in air at 60 °C for 2 h.
Characterization of samples
The ScXRD patterns were recorded using angle dispersive X-ray diffraction (ADXRD) with a wavelength of 0.4414 Å at an energy of ∼28 keV from the beamline (BL-11) at INDUS-2, Raja Ramanna Center for Advanced Technology (RRCAT), Indore, India. The detailed experimental procedure for obtaining ScXRD data was reported previously.13–15 Samples of SnS-A and SnS-B were sealed in Kapton foil for the ScXRD measurements. The sample was mounted orthogonally in the path of the beam with a distance between the samples and detector of 211 mm. The IP was exposed for each sample at 100 s and then a long 5400 s to obtain the total scattering data signals. These 2D images were calibrated using a standard CeO2 sample. The scattering signal of the samples was measured independently and subtracted from the background (Kapton foils, air) in the data. The TEM measurements and selected-area electron diffraction (SAED) patterns were obtained at an accelerating voltage of 200 kV. The energy dispersive spectra (EDS) were collected using a Jeol JSM-6360 SEM. The UV-Vis reflectance spectra were acquired using a PerkinElmer Lambda 950 UV-Vis spectrophotometer. The Raman spectra were recorded using a Jobin Yvon Horiba LABRAM-HR micro-Raman system in the visible region.Results and discussion
Crystallographic study
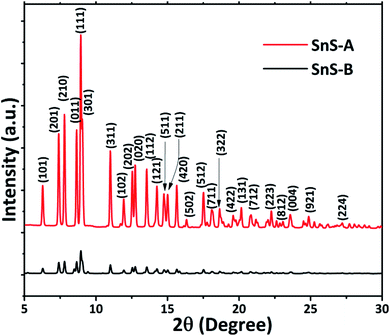
The ScXRD patterns of the α-SnS samples are shown in Fig. 1. The ScXRD data were used to obtain the PDF from the AD/ED-XRD BL-11 beamline at RRCAT. The 2D images were recorded on a marXperts mar345 2D image plate camera with an imaging plate of 50 × 30 mm, using a compound refractive lens.25 The scattering signal obtained from the sample was measured independently and subtracted from the background signal during data reduction. Then the collected 2D diffraction images were combined and subjected to geometric correction, integrated and converted to intensity versus 2θ using the FIT2D program.26 To investigate the local structure of the SnS microrods, the ScXRD and PDF techniques were combined. For the total scattering structure function S(Q) and PDF, the data were corrected and normalized using the program PDFgetX3-1.1 (ref. 27) and the results are shown in Fig. 2(a) and (b).17 In the Fourier transform step, to get from S(Q) to PDF G(r), the data were truncated at a finite maximum value of the momentum transfer, Qmax = 9.5 Å−1, and it was found to be optimal.17 The SnS material revealed a long range atomic order which was expected from the ScXRD and PDF data because the patterns of the SnS microrods showed well defined Bragg peaks at Q = 9.5 Å−1. The ScXRD results revealed high resolution diffraction for structural refinement. From Fig. 1 the diffraction peak of the SnS-A and SnS-B samples could be readily indexed as an orthorhombic structure. There were no secondary phases observed in the samples. The ScXRD results were very close to the standard value card no. JCPDS-89-0253 space group Pnma (62), with lattice constants for SnS-A of a = 11.312 Å, b = 3.971 Å, c = 4.305 Å and for SnS-B of a = 11.256 Å, b = 3.948 Å, c = 4.272 Å.38 From Fig. 1 the full width at half maxima (FWHM) of the (111) peak (this peak was strongest and narrowest of all the peaks), indicated that microrods had formed in the (111) plane. Sample SnS-A seemed to have more crystallinity when compared to SnS-B. This could be inferred from relatively broader peaks in the XRD as well as in the PDF data presented in Fig. 3. Also the TEM results showed that SnS-A seemed to have relatively longer crystals when compared to SnS-B.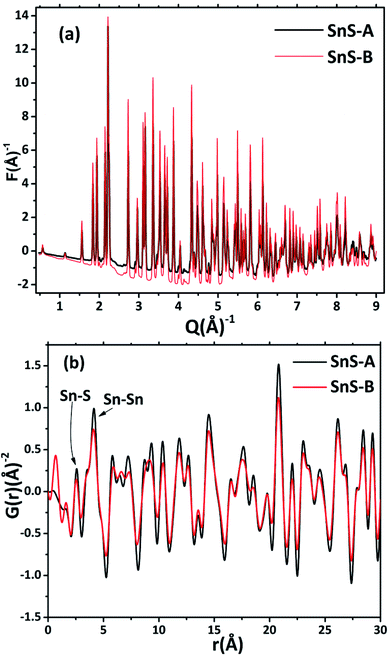 | ||
| Fig. 2 (a) The experimental reduced structure functions F(Q) of α-SnS microrods, and (b) the corresponding pair distribution functions obtained by Fourier transformation of the sample data. | ||
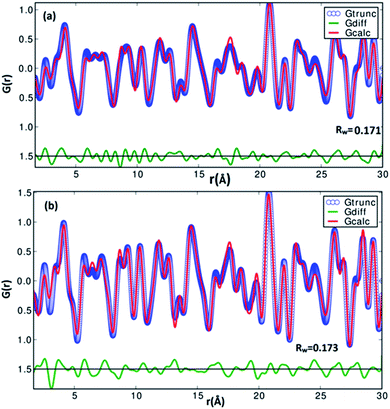 | ||
| Fig. 3 The experimetal and refined PDFs G(r) of α-SnS samples (a) SnS-A and (b) SnS-B, which correspond to orthorhombic structures. | ||
A pair distribution function G(r) was plotted, which revealed the probability of finding a certain distance ‘r’ between the atoms shown in Fig. 2(b). It can be seen in Fig. 2(b) and 3 that the as-synthesized samples showed a series of well-defined peaks up to quite a long real-space distance, which meant that the samples exhibited along-range periodic atomic order. The meaning of the pair distribution function G(r) is the probability of finding the nearest neighbour at a certain distance ‘r’ from atoms. In Fig. 2(b) the scan shows sharp and well resolved peaks which suggested high symmetry and well-defined local structures for the SnS samples, which gave the interatomic distances from the peak values. Quantitative structural information was extracted from the refinement of the PDF by comparing data from the observed PDF and the calculated PDF from the models. The PDFgui computer program27 was used to fit and simulate the structural model of the experimental PDF, as shown in Fig. 3. From the refinement of PDF, the first and second peaks corresponded to the nearest (Sn2+–S2−) and second nearest distances of (Sn2+–Sn2+) at 2.546 (0.003) Å, 4.106 (0.004) Å and 2.527 (0.005) Å, 4.087 (0.006) Å for the SnS-A and SnS-B samples, respectively, with Rw = 0.17. Here the residual function (Rw) was used to quantify the agreement of the calculated PDF from refinement to experimental data. Results for the modelling of the structures of the samples, concerning the unit cell parameters, atomic displace parameters (ADPs), scale factors, and resolution damping factors (Qdamp) are given in Table 1 but they are slightly different. Also from the refinement from Fig. 3, the α-SnS layer structure has two distinct bond lengths, one nearly parallel with the ‘a’ axis (Sn1–S1 or Sn2–S2) and another perpendicular to the ‘a’ axis (Sn2–S1). The corresponding bond lengths at 2.62528 (0.0038) Å and 2.66204 (0.003) Å for SnS-A, and 2.62571 (0.005) Å and 2.65981 (0.005) Å for SnS-B matched well with those reported by Liu et al.38 at (2.687 Å and 2.698 Å) because the α-SnS is a layer structure which has two distinct bond lengths.
| Sample | Structural parameter | Obtained value |
|---|---|---|
| SnS-A | a (Å) | 11.1931 (0.016) |
| b (Å) | 3.98608 (0.0062) | |
| c (Å) | 4.32257 (0.0051) | |
| SnS U11 = U22 = U33 | 0.0195761 (0.0022) | |
| Qdamp | 0.0199048 (0.0078) | |
| Scale factor | 0.46212 (0.034) | |
| Sn–Sn | 2.62528 (0.0038) | |
| Sn–S | 3.28478 (0.0043) | |
| Rw | 0.171 | |
| SnS-B | a (Å) | 11.1951 (0.024) |
| b (Å) | 3.98104 (0.0085) | |
| c (Å) | 4.32122 (0.0073) | |
| SnS U11 = U22 = U33 | 0.0262051 (0.0034) | |
| Qdamp | 0.017481 (0.012) | |
| Scale factor | 0.389119 (0.037) | |
| Sn–Sn | 2.62571 (0.0055) | |
| Sn–S | 3.28262 (0.0060) | |
| Rw | 0.173 |
The growth of a microrod like structure in both samples was observed but SnS-A showed high crystallinity due to the presence of water. In this reaction the water oxidized tin source (Sn2+) and ethylenediamine form a tin complex [Sn-(ethylenediamine)n]2+ but due to high pressure and temperature the stability of the ethylenediamine-complex decreased and S2− immediately reacted with it to form the SnS microrods. It is well known that Sn and S combine with the double layered crystal structure which is perpendicular to the c-axis. However, in the case of SnS-B, 100% of the ethylenediamine tin source was not immediately oxidized and the correct reaction may not have occurred, and thus, less crystallinity was observed.39
Raman spectroscopy
Micro-Raman analysis was carried out on α-SnS microrods having an orthorhombic structure with eight atoms per unit cell. For the orthorhombic structure, the 24 vibrational modes are represented by the following irreducible representations at the center of Brillouin zone as:| Γ = 4Ag + 2B1g + 4B2g + 2B3g + 2Au + 4B1u + 2B2u + 4B3u | (1) |
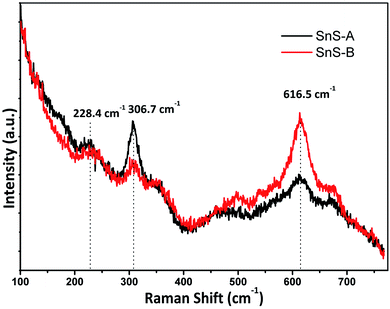
The α-SnS had 21 optical phonons of which 12 were Raman active modes (4Ag, 2B1g, 4B2g and 2B3g), seven were infrared active modes (3B1u, 1B2u and 3B3u) and two were inactive (2Au).28,29 The micro-Raman spectra for SnS-A and SnS-B microrods exhibiting the Ag mode of SnS at 228.4 and 223 cm−1, respectively, are shown in Fig. 4. The reported result was in good agreement with those of Liu et al.30 which were observed at Ag modes at 223, 273.7 cm−1 and those of Gou et al.31 which were observed at Ag modes at 189 and 220 cm−1 for SnS particles. The next peaks at 306.7 and 309 cm−1 associated A1g with the secondary phases of the SnS2 phase,32 whereas the third set of broad peaks at 616.5, and 613 cm−1 revealed the deformation mode of sulfate in SnS-A and SnS-B samples, which was only observed in the bulk materials at a lower temperature, and may be attributed to second-order effects.32
Diffuse reflectance spectroscopic study
The energy band gap of a semiconducting material has a significant impact on its optical, electronic and catalytic properties. To investigate the optical properties or bond gap of the samples, UV-diffuse reflectance spectroscopy was carried out and the results are shown in Fig. 5. The UV-diffuse reflectance data of SnS-A and SnS-B samples were processed using the Kubelka–Munk (K–M) equation,2,5,33 and were used to further calculate the band gap by using the Tauc equation as follows:34,35| F(R) = (1 − R)2/2R = α/s | (2) |
| (∝hν)1/n = A(hν − Eg) | (3) |
Morphological study
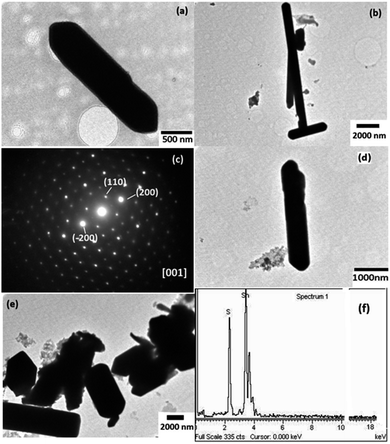
The TEM images of the as-synthesized samples are shown in Fig. 6. It showed the formation of non-uniform micro sized rods. The average diameter of the samples, SnS-A and SnS-B was found to be 800 and 500 nm, respectively, with lengths of tens of micrometers. Fig. 6(c) shows the SAED spot patterns of the SnS-A sample. The SAED spot pattern suggested the formation of single crystal SnS-A microrods and the spots were indexed at the (110) and (200) planes along the [001] zone. Fig. 6(f) shows the compositional analysis of the as synthesized samples using EDS analysis. The emission peaks of tin (Sn) and sulfur (S) could be clearly seen. It was confirmed that only Sn and S elements were present in the sample. A EDS spectrum revealed that the atomic wt% of S was 43.43 and for Sn was 56.57.Conclusions
Tin sulfide microrods were successfully synthesized by a hydrothermal method using ethylenediamine and deionized water as the surfactant. The atomic structures of the as-synthesized samples were studied using atomic pair distribution function analysis and total synchrotron X-ray scattering data. From the ScXRD patterns and PDF analysis, it is confirmed that the samples have an orthorhombic structure. The TEM micrographs clearly reveal the rod-like structures of the samples. The direct energy band gap of samples was evaluated using UV-Vis spectra. The micro-Raman spectra of SnS-A and SnS-B microrods exhibited an Ag mode of SnS at 228.4 and 223 cm−1, respectively, whereas the third broad peaks at 616.5, and 613 cm−1 revealed the deformation mode of sulfate in the SnS-A and SnS-B samples. From the refinement of the PDF, the α-SnS layer structure has two distinct bond lengths, one nearly parallel with the ‘a’ axis (Sn1–S1 or Sn2–S2) and another perpendicular to the ‘a’ axis (Sn2–S1), corresponding to bond lengths at 2.62528 (0.0038) Å and 2.66204 (0.003) Å for SnS-A, and 2.62571 (0.005) Å and 2.65981 (0.005) Å for the SnS-B sample. Comparing the SnS-A and SnS-B samples, the water and ethylenediamine (50![[thin space (1/6-em)]](https://www.rsc.org/images/entities/char_2009.gif) :
:![[thin space (1/6-em)]](https://www.rsc.org/images/entities/char_2009.gif) 50) surfactant solution (SnS-A) was preferred from a technological point of view, because it improved the crystallinity.
50) surfactant solution (SnS-A) was preferred from a technological point of view, because it improved the crystallinity.
Conflicts of interest
There are no conflicts to declare.Acknowledgements
The authors are thankful to Dr U. P. Deshpande, UGC-DAE CSR, Indore, for providing UV-Vis facilities.References
- K. Ramasamy, V. L. Kuznetsov, K. Gopal, M. A. Malik, J. Raftery, P. P. Edwards and P. O'Brien, Chem. Mater., 2013, 25, 266–276 CrossRef CAS.
- A. Rauf, Md. Selim Arif Sher Shah, J. Y. Lee, C.-H. Chung, J. W. Baea and P. J. Yoo, RSC Adv., 2017, 7, 30533–30541 RSC.
- R. E. Abutbul, E. Segev, L. Zeiri, V. Ezersky, G. Makov and Y. Golan, RSC Adv., 2016, 6, 5848–5855 RSC.
- A. M. Tripathi and S. Mitra, RSC Adv., 2014, 4, 10358–10366 RSC.
- M. ZubairIqbal, F. Wang, M. Y Rafique, S. Ali, M. H. Farooq and M. Ellah, Mater. Lett., 2013, 106, 33–36 CrossRef.
- (a) A. S. Sarkar, A. Mushtaq, D. Kushavah and S. K. Pal, npj 2D Mater. Appl., 2020, 4, 1–9 CrossRef CAS; (b) H. Wiedemeier and H. G. von Schnering, Z. Kristallogr., 1978, 148, 295–303 CrossRef CAS.
- Ki-H. Cho and Y.-Mo Sung, Nanoscale, 2013, 5, 3690–3697 RSC.
- S. K. Panda, A. Datta, A. Dev, S. Gorai and S. Chaudhuri, Cryst. Growth Des., 2006, 6, 2177–2218 CrossRef CAS.
- S. Ali, F. Wang, M. Z. Iqbal, H. U. Shah and S. Zafar, Mater. Lett., 2017, 206, 22–25 CrossRef CAS.
- D. Zhang, X. Zong, Z. Wu and Y. Zhang, ACS Appl. Mater. Interfaces, 2018, 10(38), 32631–32639 CrossRef CAS PubMed.
- D. Mudusu, K. Reddy Nandanapalli, S. Reddy Dugasani, J. W. Kang, S. Ha Park and C. W. Tu, RSC Adv., 2017, 7, 41452–41459 RSC.
- M. D. Chaudhary, S. H. Chaki and M. P. Deshpande, J. Asian Ceram. Soc., 2017, 5(2), 193–198 CrossRef.
- U. P. Gawai and B. N. Dole, RSC Adv., 2017, 7, 37402–37411 RSC.
- U. P. Gawai, H. A. Khawal, M. R. Bodke, K. K. Pandey, U. P. Deshpande, N. P. Lalla and B. N. Dole, RSC Adv., 2016, 6, 50479–50486 RSC.
- U. P. Gawai, D. K. Gaikwad, M. R. Bodke, H. A. Khawal, K. K. Pandey, A. K. Yadav, S. N. Jha, D. Bhattacharyya and B. N. Dole, Phys. Chem. Chem. Phys., 2019, 21, 1294–1307 RSC.
- X. Yang, A. Masadeh, J. McBride, E. Božin, S. Rosenthal and S. Billinge, Phys. Chem. Chem. Phys., 2013, 15, 8480 RSC.
- A. Masadeh, E. Božin, C. Farrow, G. Paglia, P. Juhas, S. Billinge, A. Karkamkar and M. Kanatzidis, Phys. Rev. B: Condens. Matter Mater. Phys., 2007, 76, 113101 CrossRef.
- V. Petkov, T. Ohta, Y. Hou and Y. Ren, J. Phys. Chem. C, 2007, 111, 714–720 CrossRef CAS.
- M. Feygenson, J. Neuefeind, T. Tyson, N. Schieber and W. Han, Inorg. Chem., 2015, 54, 11226–11235 CrossRef CAS PubMed.
- V. Petkov, Mater. Today, 2008, 11, 28–38 CrossRef CAS.
- S. J. L. Billinge, Philos. Trans. R. Soc., A, 2019, 377, 20180413 CrossRef CAS PubMed.
- K. Ohara, S. Tominaka, H. Yamada, M. Takahashi, H. Yamaguchi, F. Utsuno, T. Umeki, A. Yao, K. Nakada, M. Takemoto, S. Hiroi, N. Tsuji and T. Wakihara, J. Synchrotron Radiat., 2018, 25, 1627–1633 CrossRef PubMed.
- A. Poulain, I. Sobczak and M. Ziolek, Cryst. Growth Des., 2016, 16(10), 5985–5993 CrossRef CAS.
- S. Sanchez, U. Steiner and X. Hua, Chem. Mater., 2019, 31(9), 3498–3506 CrossRef CAS.
- K. K. Pandey, H. K. Poswal, A. K. Mishra, A. Dwivedi, R. Vasanthi, N. Garg and S. M. Sharma, Pramana, 2013, 80(4), 607–619 CrossRef CAS.
- A. P. Hammersley, J. Appl. Crystallogr., 2016, 49, 646–652 CrossRef CAS.
- P. Juhás, T. Davis, C. Farrow and S. Billinge, J. Appl. Crystallogr., 2013, 46, 560–566 CrossRef.
- P. M. Nikolic, P. Miljkovic and B. Lavrencic, J. Phys. C: Solid State Phys., 1977, 10, L289–L292 CrossRef CAS.
- S. Sohilaa, M. Rajalakshmi, C. Ghosh, A. K. Arora and C. Muthamizhchelvana, J. Alloys Compd., 2011, 509, 5843–5847 CrossRef.
- Y. Liu, D. Hou and G. Wang, Chem. Phys. Lett., 2003, 379, 67–73 CrossRef CAS.
- X. L. Gou, J. Chen and P. W. Shen, Mater. Chem. Phys., 2005, 93, 557–566 CrossRef CAS.
- C. Wang, K. Tang, Q. Yang and Y. Qian, Chem. Phys. Lett., 2002, 357, 371–375 CrossRef CAS.
- A. Hagfeldt and M. Gratzel, Chem. Rev., 1995, 95, 49 CrossRef CAS.
- J. Tauc, R. Grigorovic and A. Vancu, Phys. Status Solidi, 1966, 15, 627–637 CrossRef CAS.
- E. A. Davis and N. F. Mott, Philos. Mag., 1970, 22, 0903–0922 CrossRef CAS.
- J. R. Brent, D. J. Lewis, T. Lorenz, E. A. Lewis, N. Savjani, S. J. Haigh, G. Seifert, B. Derby and P. O'Brien, J. Am. Chem. Soc., 2015, 137, 12689–12696 CrossRef CAS PubMed.
- D. Das and R. Datta, J. Colloid Interface Sci., 2015, 457, 339–344 CrossRef CAS PubMed.
- C. M. Liu, C. Xu and M. Y. Duan, Z. Naturforsch., 2015, 70(11), 949–960 CAS.
- S. K. Panda, S. Gorai and S. Chaudhuri, Mater. Sci. Eng. B, 2006, 129, 265–269 CrossRef CAS.
| This journal is © The Royal Society of Chemistry 2020 |

