 Open Access Article
Theoretical perspective on the electronic structure and photophysical properties for a series of mixed-carbene tris-cyclometalated iridium(III) complexes†
Jiawei Lia,
Deming Han bc,
Jing Gaoa,
Tong Chena,
Bao Wanga and
Xiaohong Shang
 *a
*a
aCollege of Chemistry and Life Science, Changchun University of Technology, Changchun 130012, P. R. China. E-mail: shangxiaohong58@aliyun.com
bSchool of Life Science and Technology, Changchun University of Science and Technology, Changchun 130022, P. R. China
cJilin Provincial Science and Technology Innovation Center of Optical Materials and Chemistry, Changchun, 130022, P. R. China
First published on 14th May 2020
Abstract
The electronic structure and photophysical properties of four mixed-carbene tris-cyclometalated iridium(III) complexes have been theoretically investigated by the density functional theory (DFT) and time-dependent density functional theory (TDDFT) methods. The effect of varying the main ligand by introducing different ring structures on the photophysical properties of the studied complexes has been explored. All studied complexes have slightly distorted octahedral geometries. The complex with a rigid skeletal structural main ligand possesses the smallest difference between the recombination energy of hole transport and recombination energy of electron transport among these complexes, enhancing the charge transfer balance. The lowest energy emission wavelength calculated is in very good agreement with the available experimental value. This study will provide useful information for the design of new phosphorescent organic light-emitting diode (OLED) materials.
1. Introduction
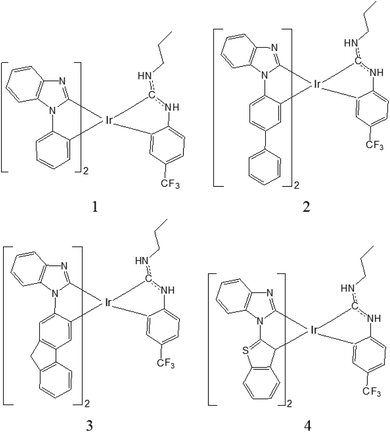
Nowadays, organic light-emitting diodes (OLEDs) have attracted great interest from researchers due to their potential applications as light-emitting materials and the next generation materials of flat panel displays.1–3 Transition metal phosphorescent complexes, such as Ru(II), Rh(III), Cu(I), Os(II), Ir(III) and Pt(II) complexes, have been successfully applied to OLEDs, electrochemiluminescence, dye-sensitized solar cells, photocatalysis and so on.4–9 Especially, iridium(III)-based phosphorescent complexes have attracted great attention due to their potential practical applications in OLEDs, and they have high emission quantum yields, short excited triplet state lifetimes and photochemical stability.10–15 Phosphorescent transition metal complexes can harvest both singlet and triplet excitons due to their effective intersystem crossing (ISC) and achieve an internal quantum efficiency as high as 100%, which breaks the 25% theoretical internal quantum efficiency limitation predicted in fluorescent devices based on singlet exciton emission.16,17It is known that the good selection of chelates with distinctive electronic and steric properties is very important in the design strategy, which chelates are one key factor in assembling luminescent metal complexes. The luminescence spectra of iridium(III) complexes can be tuned from near ultraviolet to visible and near infrared regions by the method of chemical modification and functionalization of the ligands. Hanah Na et al. have designed a new class of hybrid carbene ring metallated iridium complexes [Ir(C^C:NHC)2(C^C:ADC)], which emit blue light and have good photoluminescence quantum yield,18 Herein, on the basis of the experimental complex 3b18 (named as 1 in Fig. 1), three iridium(III) complexes have been designed. By using the density functional theory (DFT) and time-dependent density functional theory (TDDFT) method, the electronic structure and photophysical properties for these complexes have been theoretically studied. It is anticipated that the study will provide useful information for the designing of new phosphorescent OLEDs material.
2. Computational methods
The ground-state and the lowest-lying triplet excited-state geometries were optimized by density functional theory (DFT) method19 with hybrid Hartree–Fock/density functional model (PBE0) based on the Perdew–Burke–Ernzerhof (PBE) approach,20,21 respectively. All geometrical structures were fully optimized without any symmetry constraints. Vibrational frequencies were also calculated at the same theoretical level to confirm that each configuration was a minimum on the potential energy surface. On the basis of the optimized ground- and excited-state geometry structures, the time-dependent DFT (TDDFT) approach associated with the polarized continuum model (PCM)22 in dichloromethane (CH2Cl2) media was applied to investigate the absorption and emission spectral properties.In the calculations, the quasi-relativistic pseudo-potential of Ir atom proposed by Hay and Wadt with 17 valence electrons was used, and a ‘‘double-ξ’’ quality basis set LANL2DZ was adopted.23,24 The 6-31G* basis set was employed on non-metal atoms in the gradient optimizations. The above-mentioned methods and basis sets for transition metal complexes have supported their reliability and gave good agreement with experimental results.25–27 The properties of the Ir(III) complexes, such as ionization potential (IP), electron affinity (EA), reorganization energy (λ), etc. were also calculated by the method mentioned above. For all calculations, the Gaussian 09 software package of programs28 was performed. The absorption spectra were simulated by using GaussSum program Rev. 2.5 (ref. 29) based on the data obtained via TDDFT calculations.
3. Results and discussion
3.1 Molecular geometries in ground and lowest triplet states
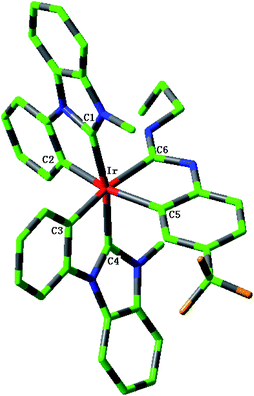
The sketch map of iridium(III) complexes 1–4 are presented in Fig. 1. The optimized ground state geometric structure for complex 1 is also shown in Fig. 2 along with the numbering of some key atoms. The optimized geometry parameters of 1–4 in the ground and lowest triplet states (T1) are listed in Table 1.| 1 | 2 | 3 | 4 | |||||
|---|---|---|---|---|---|---|---|---|
| S0/exptla | T1 | S0 | T1 | S0 | T1 | S0 | T1 | |
| a Ref. 18. | ||||||||
| Bond length (Å) | ||||||||
| Ir–C1 | 2.035/2.026 | 2.043 | 2.035 | 2.035 | 2.033 | 2.033 | 2.054 | 2.054 |
| Ir–C2 | 2.085/2.096 | 2.078 | 2.087 | 2.072 | 2.087 | 2.064 | 2.063 | 2.066 |
| Ir–C3 | 2.075/2.081 | 2.009 | 2.074 | 2.074 | 2.078 | 2.078 | 2.048 | 2.049 |
| Ir–C4 | 2.018/1.997 | 2.079 | 2.020 | 2.022 | 2.020 | 2.024 | 2.040 | 2.038 |
| Ir–C5 | 2.102/2.094 | 2.097 | 2.101 | 2.104 | 2.101 | 2.106 | 2.092 | 2.095 |
| Ir–C6 | 2.056/2.019 | 2.104 | 2.056 | 2.060 | 2.056 | 2.061 | 2.055 | 2.068 |
![[thin space (1/6-em)]](https://www.rsc.org/images/entities/char_2009.gif) |
||||||||
| Bond angle (°) | ||||||||
| C1–Ir–C2 | 78.04/77.82 | 78.30 | 78.02 | 79.14 | 78.07 | 79.19 | 76.80 | 76.80 |
| C3–Ir–C4 | 78.12/77.70 | 79.23 | 78.13 | 78.22 | 77.97 | 78.03 | 76.74 | 77.78 |
| C5–Ir–C6 | 78.62/79.57 | 77.20 | 78.63 | 78.54 | 78.63 | 78.49 | 78.66 | 78.16 |
| C1–Ir–C4 | 166.81/170.67 | 169.30 | 166.80 | 166.63 | 166.79 | 167.24 | 167.87 | 166.15 |
| C2–Ir–C5 | 170.72/168.19 | 164.38 | 170.90 | 170.34 | 170.49 | 169.92 | 169.89 | 169.77 |
| C3–Ir–C6 | 172.69/171.99 | 170.75 | 172.11 | 172.12 | 172.46 | 172.41 | 173.04 | 171.47 |
![[thin space (1/6-em)]](https://www.rsc.org/images/entities/char_2009.gif) |
||||||||
| Dihedral angle (°) | ||||||||
| C1–C2–C4–C5 | 15.11/12.32 | 17.28 | 14.84 | 15.54 | 15.35 | 15.81 | 15.73 | 16.19 |
| C1–C3–C4–C6 | 10.38/10.03 | 11.96 | 10.93 | 10.78 | 10.51 | 9.91 | 8.35 | 11.54 |
| C2–C3–C5–C6 | 0.80/3.81 | 0.51 | 0.88 | 0.88 | 0.76 | 0.76 | 2.52 | 1.72 |
These complexes have the general structure Ir(L1)2L2, where L1 is an N-heterocyclic carbene (NHC) and L2 is cyclometalating ligand featuring an acyclic diaminocarbene (ADC). The optimized ground state geometric structure for complex 1 is good agreement with the single-crystal X-ray structure.18 The maximum deviation between the calculated bond lengths and the experimental values is 0.017 Å, which indicates the theoretical method is reliable. The bond angles C1–Ir–C2 (C3–Ir–C4, C5–Ir–C6) and C1–Ir–C4 (C2–Ir–C5, C3–Ir–C6) are close to 80° and 170°, respectively, which shows that complexes 1–4 adopt a pseudo-octahedral coordination geometry. In addition, the dihedral angles C1–C2–C4–C5 and C1–C3–C4–C6 for complexes 1–4 are between 8° and 16°. The C2–C3–C5–C6 for complexes 1–4 are smaller than 3°, especially, those of 1, 2 and 3 are near to 1°, which shows that there is a plane structure around the central Ir atom. Upon excitation to the T1 state, complexes 1–4 basically retain their geometries with slightly changed bond lengths and bond angles around the iridium center.
3.2 Frontier molecular orbital (FMOs) properties
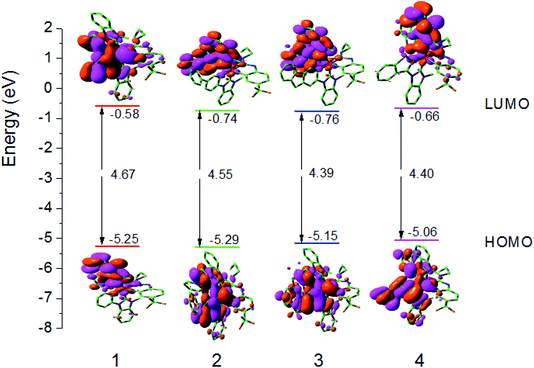
Since the optical and chemical properties of these complexes are closely related to the electronic structure of their ground state, the properties of the Frontier molecular orbitals (FMOs) of these complexes are investigated in detail in this section. The distribution of HOMO and LUMO, energy level, and the energy gap between HOMO–LUMO (ΔEL→H) are shown in Fig. 3. The Frontier FMO compositions of all studied complexes are listed in Tables S1–S4 (ESI).†The LUMO for complexes 1–4 mainly reside on the L1 main ligand. For example, for complex 1, the LUMO has the distribution with L1 ligand 94% π*-orbital. The HOMO for complexes 1–4 are mainly localized at Ir d-orbital and L1 main ligand. For example, the LUMO of 1 has 36% Ir 5d orbital and 57% π-orbital. It is known that the tuning emission color by changing substituents relies on the fact that the lowest excited state is relatively well described as a transition from HOMO to LUMO in a given ligand. Hence, to investigate the ΔEL→H can give some useful information on the variation trend of absorption and emission spectra. In comparison with those of 1, the LUMO energy levels of complexes 2–4 are decreased. In contrast to 2, the HOMO and LUMO energy levels of 3 with rigid ligand are increased and decreased, respectively. The ΔEL→H values of 1 and 3 are the largest and smallest ones, respectively, among all studied complexes, which indicates that enhancing the conjugated degree by changing the main ligand can reduce the ΔEL→H values.
3.3 Ionization potential (IP) and electronic affinity (EA)
The performance of an OLED device is closely associated with IP, EA and migration of charge. IP and EA can be used to predict the energy barrier of holes and electrons. The size of IP and EA is related to the HOMO and LUMO levels of the complex. The IP and EA can be either for vertical excitations (v; at the geometry of neutral molecule) or adiabatic excitations (a; optimized structure for both the neutral and charged molecules). Generally, a smaller IP value means easier hole injection ability and a larger EA value will facilitate electron injection. We have calculated the hole extraction potential (HEP), which is the energy difference between M (neutral molecule) and M+ (cationic), using M+ geometry, and electron extraction potential (EEP), which is the energy difference between M and M− (anionic), using M− geometry. The calculated vertical IP (IPv), adiabatic IP (IPa), vertical EA (EAv), adiabatic EA (EAa), HEP, and EEP are listed in Table 2.| IPv | IPa | HEP | EAv | EAa | EEP | λh | λe | Δ | |
|---|---|---|---|---|---|---|---|---|---|
| 1 | 5.07 | 4.84 | 4.58 | 0.70 | 0.88 | 1.15 | 4.91 | 0.70 | 4.21 |
| 2 | 5.11 | 4.89 | 4.65 | 0.86 | 1.07 | 1.29 | 4.94 | 0.86 | 4.08 |
| 3 | 4.98 | 4.79 | 4.57 | 0.89 | 1.01 | 1.15 | 4.81 | 0.89 | 3.92 |
| 4 | 4.91 | 4.75 | 4.59 | 0.79 | 1.00 | 1.43 | 4.74 | 0.79 | 3.95 |
The IP values of 4 the smallest ones among these studied complexes, indicating that its hole injection energy barrier is the lowest, which is also consistent with its highest HOMO energy level. Complexes 2 and 3 have the larger EA values, so their electron injection is relatively easy compared to other complexes, which is consistent with their lowest LUMO energy level. The EA values of 1 are the smallest one, which will lead to an increased electron injection energy barrier. According to the semi-empirical Marcus model,30–32 the transfer rate of charge (holes and electrons) Ket can be expressed by the following formula:
Ket = A![[thin space (1/6-em)]](https://www.rsc.org/images/entities/char_2009.gif) exp(–λ/4KBT) exp(–λ/4KBT)
| (1) |
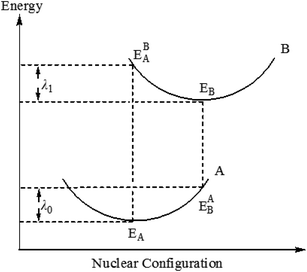
Among them, λ is the recombination energy, A is the electron coupling correlation factor between adjacent complexes, and T and KB are the temperature and Boltzmann constant, respectively. Due to the limited intermolecular charge transfer range in the solid state, the mobility of charges has been demonstrated to be predominantly related to the internal reorganization energy λ for OLEDs materials.33,34 According to the formula (1), at a certain temperature, the smaller the λ value, the faster the charge transfer rate. In general, the value of the recombination energy λ is mainly determined by two aspects: internal recombination energy (λi) and external recombination energy (λe). The external recombination energy can mainly come from the polarization effect of the surrounding medium, and in the solid-state optoelectronic device, the external recombination energy of the luminescent material can be neglected. Therefore, here we will mainly discuss the internal recombination energy of the complex. Internal recombination energy refers to the energy change caused by the rapid change of molecular geometry, which is caused by the change of internal nuclear coordinates from the reactant A to the product B and vice versa (Fig. 4), which is mainly the sum of two relaxation energies:
| λi = λ0 + λl = (EAB − EA) + (EBA − EB) | (2) |
| λh = IPv − HEP | (3) |
| λe = EEP − EAv | (4) |
λh and λe can be used to estimate the charge transfer rate and balance ability. The low reorganization energy is necessary for an efficient charge transport process. In general, the smaller λe (λh) means the better electron-transporting (hole-transporting) performance. Complex 4 with the smallest λh (0.74 eV) has the best hole transfer ability among these studied complexes, whereas complex 1 has the best electron transporting performance due to the smallest λe value. The λh of complexes 1–4 are larger than those λe, which shows that the electron-transport performance of these complexes is better than hole-transporting performance. In addition, the difference between λh and λe for complex 3 is the smallest among these complexes, which can greatly improve the charge transfer balance, thus further enhancing the device performance of OLEDs.
3.4 Absorption spectral properties
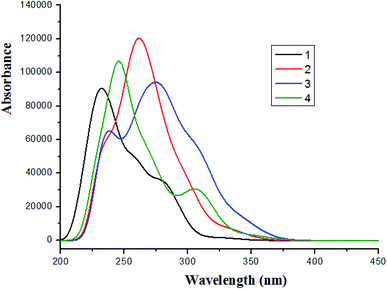
Based on the optimized ground state structure, the absorption spectra of complexes 1–4 in CH2Cl2 solvent were calculated using TDDFT/PBE0 method. The absorption wavelength, oscillator strength (f) and the transition properties are listed in Table S5 (ESI).† The absorption spectra of complexes 1–4 are shown in Fig. 5.The lowest energy absorption wavelengths are located at 328 nm (f = 0.0104) for 1, 335 nm (f = 0.0258) for 2, 345 nm (f = 0.0332) for 3 and 347 nm (f = 0.0391) for 4, respectively. In contrast to 1, the increase of conjugated degree for 2–4 leads to redshifted absorption. It can be seen form Table S5† that the lowest lying singlet → singlet absorption for complex 1 is comparable with the experimental value. The lowest lying transitions of complexes 1–4 are mainly attributed to the configuration of HOMO → LUMO [d(Ir) + π(L1) → π*(L1)]/MLCT (metal to ligand charge transfer)/ILCT (intraligand charge transfer). Differently, the lowest lying transition of 4 is characterized as HOMO → LUMO (59%) and HOMO → LUMO + 1 (35%) [d(Ir) + π(L1) → π*(L1)]/MLCT/ILCT. It can also be seen that the intense absorptions are in the region of wavelength < 300 nm. For complex 3, there is a shoulder peak at about 238 nm wavelength.
3.5 Phosphorescence properties
Based on the optimized geometry of the T1 state, the emission properties of these studied complexes by the TDDFT/M052X method in CH2Cl2 solvent have been presented in Table 3. The plots of the molecular orbitals related to emissions of complexes 1–4 are also provided in Fig. 6.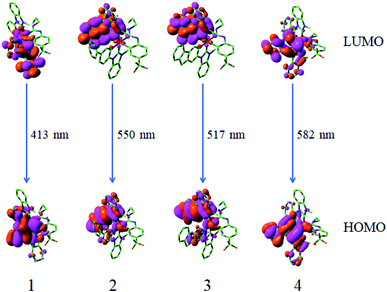 | ||
| Fig. 6 Transitions responsible for the emissions at 413, 550, 517 and 582 nm for complexes 1–4, respectively, simulated in CH2Cl2 media at M052X level. | ||
From Table 3, it can be seen that the calculated lowest energy emissions of complexes 1–4 are localized at 413, 550, 517 and 582 nm, respectively. The lowest energy emission wavelength for 1 is in very good agreement with the experimental value (420 nm).18 The lowest energy emission wavelengths of 2–4 are obviously redshifted in contrast to that of complex 1. The phosphorescence emissions for complexes 1–4 are mainly from the transition of LUMO → HOMO configuration, which are described as 3MLCT (triplet metal to ligand charge transfer)/3LLCT (triplet ligand to ligand charge transfer). From Fig. 6 and Table S6,† it can be seen that the LUMO distribution is mainly localized at the L1 ligand, however, the HOMO distribution is mainly at Ir d-orbitals and L1 ligand.
The emission quantum efficiency (Φ) is linked to the radiative decay rate (kr) and nonradiative (knr), which can be expressed by formula (5):
| Φ = kr/(kr + knr) | (5) |
It can be seen, to increase Φ, kr should be increased and knr should be decreased simultaneously or respectively.35,36 Besides, kr is also theoretically related to the mixing between S1 and T1, which is proportional to the spin–orbit coupling (SOC) and inversely proportional to the energy gaps between the S1 and T1 states according to the following formula:37,38
 | (6) |
| γ = 16π3106n3Eem3/3hε0 |
4. Conclusion
The geometrical structures, transporting abilities, absorptions, and phosphorescent properties for four iridium(III) complexes have been investigated by DFT/TDDFT. The HOMO and LUMO distribution for these studied complexes respectively possesses the same character, which indicates that the change of main ligands has not obvious effect. The complex with rigid skeletal structural main ligand will greatly improve the charge transfer balance and enhance the device performance of OLEDs. The maximum absorption peaks of complexes 1–3 are in the order of 1 < 2 < 3, which is in accordance with their ΔEL→H values. Complexes 1 and 3 possibly have the large kr values among these complexes. It can be seen that the modification of main ligands in the studied complexes can produce an important effect on the electronic structure and photophysical properties. Our study will be useful for the search for efficient iridium(III) phosphors in OLEDs.Conflicts of interest
There are no conflicts to declare.Acknowledgements
The authors are grateful for the financial aid from the Program of Science and Technology Development Plan of Jilin Province of China (Grant No. 20200201099JC) and the Science and Technology Research Project for the Thirteenth Five-year Plan of Education Department of the Jilin Province of China (Grant No. JJKH20181021KJ and JJKH20170604KJ).References
- B. Q. Liu, M. A. Jabed, J. L. Guo, W. Xu, S. L. Brown, A. Ugrinov, E. K. Hobbie, S. Kilina, A. J. Qin and W. F. Sun, Inorg. Chem., 2019, 58, 14377–14388 CrossRef CAS PubMed.
- D. Liu, K. Y. Sun, G. M. Zhao, J. Y. Wei, J. X. Duan, M. H. Xia, W. Jiang and Y. M. Sun, J. Mater. Chem. C, 2019, 7, 11005–11013 RSC.
- R. R. Valiev, R. M. Gadirov, K. M. Degtyarenko, D. V. Grigoryev, R. T. Nasubullin, G. V. Baryshnikov, B. F. Minaev, S. K. Pederse and M. Pittelkow, Chem. Phys. Lett., 2019, 732, 136667 CrossRef CAS.
- D. X. Ma, C. Zhang, Y. Qiu and L. Duan, Org. Electron., 2017, 42, 194–202 CrossRef CAS.
- F. F. Wei, S. L. Lai, S. N. Zhao, M. Ng, M. Y. Chan, V. W. W. Yam and K. M. C. Wong, J. Am. Chem. Soc., 2019, 141, 12863–12871 CrossRef CAS PubMed.
- W. Luo, C. Zeng, X. Q. Du, C. Q. Leng, W. Yao, H. F. Shi, X. Z. Wei, C. L. Du and S. R. Lu, J. Mater. Chem. C, 2018, 6, 4895–4902 RSC.
- J. L. Liao, Y. Chi, C. C. Yeh, H. C. Kao, C. H. Chang, M. A. Fox, P. J. Low and G. H. Lee, J. Mater. Chem. C, 2015, 3, 4910–4920 RSC.
- P. Gnanasekaran, Y. Yuan, C. S. Lee, X. W. Zhou, A. K. Y. Jen and Y. Chi, Inorg. Chem., 2019, 58, 10944–10954 CrossRef CAS PubMed.
- I. Taidakov, S. Ambrozevich, R. Saifutyarov, K. Lyssenko, R. Avetisov, E. Mozhevitina, A. Khomyakov, M. Khrizanforov, Y. Budnikova and I. Avetissov, J. Organomet. Chem., 2018, 867, 253–260 CrossRef CAS.
- L. Y. Hsu, D. G. Chen, S. H. Liu, T. Y. Chiu, C. H. Chang, A. K. Y. Jen, P. T. Chou and Y. Chi, ACS Appl. Mater. Interfaces, 2020, 12, 1084–1093 CrossRef CAS PubMed.
- L. Y. Hsu, Q. M. Liang, Z. H. Wang, H. H. Kuo, W. S. Tai, S. J. Su, X. W. Zhou, Y. Yuan and Y. Chi, Chem.–Eur. J., 2019, 25, 15375–15386 CrossRef CAS PubMed.
- A. K. Pal, S. Krotkus, M. Fontani, C. F. R. Mackenzie, D. B. Cordes, A. M. Z. Slawin, I. D. W. Samuel and E. Zysman-Colman, Adv. Mater., 2018, 30, 1804231 CrossRef PubMed.
- S. Urinda, G. Das, A. Pramanik and P. Sarkar, Phys. Chem. Chem. Phys., 2017, 19, 29629–29640 RSC.
- K. P. S. Zanoni and N. Y. M. Iha, Synth. Met., 2016, 222, 393–396 CrossRef CAS.
- T. Guo, L. Yu, Y. Yang, Y. H. Li, Y. Tao, Q. Hou, L. Ying, W. Yang, H. B. Wu and Y. Cao, J. Lumin., 2015, 167, 179–185 CrossRef CAS.
- M. A. Baldo, S. Lamansky, P. E. Burrows, M. E. Thompson and S. R. Forrest, Appl. Phys. Lett., 1999, 75, 4–6 CrossRef CAS.
- V. Cleave, G. Yahioglu, P. Le Barny, R. H. Friend and N. Tessler, Adv. Mater., 1999, 11, 285–288 CrossRef CAS.
- H. Na, L. M. Canada, Z. L. Wen, J. I. C. Wu and T. S. Teets, Chem. Sci., 2019, 10, 6254–6260 RSC.
- P. Hohenberg and W. Kohn, Phys. Rev., 1964, 136, B864–B871 CrossRef.
- C. Adamo and V. Barone, J. Chem. Phys., 1999, 110, 6158–6169 CrossRef CAS.
- J. P. Perdew, K. Burke and M. Ernzerhof, Phys. Rev. Lett., 1996, 77, 3865–3868 CrossRef CAS PubMed.
- J. Tomasi, B. Mennucci and R. Cammi, Chem. Rev., 2005, 105, 2999–3094 CrossRef CAS PubMed.
- P. J. Hay and W. R. Wadt, J. Chem. Phys., 1985, 82, 270–284 CrossRef CAS.
- P. J. Hay and W. R. Wadt, J. Chem. Phys., 1985, 82, 299–310 CrossRef CAS.
- Y. Y. Hu, W. Luo, C. G. Hu, Y. Wang, B. H. Tong, M. K. Fung, Y. P. Tian and Q. F. Zhang, J. Lumin., 2020, 219, 116846 CrossRef CAS.
- C. H. Lin, J. L. Liao, Y. S. Wu, K. Y. Liao, Y. Chi, C. L. Chen, G. H. Lee and P. T. Chou, Dalton Trans., 2015, 44, 8406–8418 RSC.
- C. H. Chang, Z. J. Wu, C. H. Chiu, Y. H. Liang, Y. S. Tsai, J. L. Liao, Y. Chi, H. Y. Hsieh, T. Y. Kuo, G. H. Lee, H. A. Pan, P. T. Chou, J. S. Lin and M. R. Tseng, ACS Appl. Mater. Interfaces, 2013, 5, 7341–7351 CrossRef CAS PubMed.
- M. J. Frisch, G. W. Trucks, H. B. Schlegel, G. E. Scuseria, M. A. Robb, J. R. Cheeseman, G. Scalmani, V. Barone, B. Mennucci, G. A. Petersson, H. Nakatsuji, M. Caricato, X. Li, H. P. Hratchian, A. F. Izmaylov, J. Bloino, G. Zheng, J. L. Sonnenberg, M. Hada, M. Ehara, K. Toyota, R. Fukuda, J. Hasegawa, M. Ishida, T. Nakajima, Y. Honda, O. Kitao, H. Nakai, T. Vreven, J. A. Montgomery Jr, J. E. Peralta, F. Ogliaro, M. Bearpark, J. J. Heyd, E. Brothers, K. N. Kudin, V. N. Staroverov, R. Kobayashi, J. Normand, K. Raghavachari, A. Rendell, J. C. Burant, S. S. Iyengar, J. Tomasi, M. Cossi, N. Rega, J. M. Millam, M. Klene, J. E. Knox, J. B. Cross, V. Bakken, C. Adamo, J. Jaramillo, R. Gomperts, R. E. Stratmann, O. Yazyev, A. J. Austin, R. Cammi, C. Pomelli, J. W. Ochterski, R. L. Martin, K. Morokuma, V. G. Zakrzewski, G. A. Voth, P. Salvador, J. J. Dannenberg, S. Dapprich, A. D. Daniels, J. B. Foresman, J. V. Ortiz, J. Cioslowski and D. J. Fox, Gaussian 09, Gaussian Inc., Wallingford CT, 2009 Search PubMed.
- N. M. O'Boyle, A. L. Tenderholt and K. M. Langner, J. Comput. Chem., 2008, 29, 839–845 CrossRef PubMed.
- N. S. Hush, J. Chem. Phys., 1958, 28, 962–972 CrossRef CAS.
- R. A. Marcus, Rev. Mod. Phys., 1993, 65, 599–610 CrossRef CAS.
- R. A. Marcus, J. Chem. Phys., 1956, 24, 966–978 CrossRef CAS.
- M. Malagoli and J. L. Brédas, Chem. Phys. Lett., 2000, 327, 13–17 CrossRef CAS.
- B. C. Lin, C. P. Cheng, Z. Ping and M. Lao, J. Phys. Chem. A, 2003, 107, 5241–5251 CrossRef CAS.
- S. Fantacci, F. De Angelis, A. Sgamellotti, A. Marrone and N. Re, J. Am. Chem. Soc., 2005, 127, 14144–14145 CrossRef CAS PubMed.
- A. B. Tamayo, S. Garon, T. Sajoto, P. I. Djurovich, I. M. Tsyba, R. Bau and M. E. Thompson, Inorg. Chem., 2005, 44, 8723–8732 CrossRef CAS PubMed.
- S. Haneder, E. D. Como, J. Feldmann, J. M. Lupton, C. Lennartz, P. Erk, E. Fuchs, O. Molt, I. Münster, C. Schildknecht and G. Wagenblast, Adv. Mater., 2008, 20, 3325–3330 CrossRef CAS.
- N. Turro, Modern Molecular Photochemistry, University Science Books, Palo Alto, CA, 1991 Search PubMed.
Footnote |
| † Electronic supplementary information (ESI) available. See DOI: 10.1039/d0ra03444d |
| This journal is © The Royal Society of Chemistry 2020 |

