
 Open Access Article
 This Open Access Article is licensed under a Creative Commons Attribution-Non Commercial 3.0 Unported Licence
Hydrogen absorption and desorption on Rh nanoparticles revealed by in situ dispersive X-ray absorption fine structure spectroscopy†
Chulho Song‡
a,
Okkyun Seo‡ab,
Daiju Matsumura*c,
Satoshi Hiroib,
Yi-Tao Cui d,
Jaemyung Kima,
Yanna Chena,
Akhil Tayala,
Kohei Kusadae,
Hirokazu Kobayashie,
Hiroshi Kitagawaef and
Osami Sakata*abgh
d,
Jaemyung Kima,
Yanna Chena,
Akhil Tayala,
Kohei Kusadae,
Hirokazu Kobayashie,
Hiroshi Kitagawaef and
Osami Sakata*abgh
aSynchrotron X-ray Station at SPring-8, Research Network and Facility Services Division, National Institute for Materials Science, 1-1-1 Kouto, Sayo, Hyogo 679-5148, Japan
bSynchrotron X-ray Group, Research Center for Advanced Measurement and Characterization, National Institute for Materials Science, 1-1-1 Kouto, Sayo, Hyogo 679-5148, Japan. E-mail: SAKATA.Osami@nims.go.jp; Tel: +81 791 58 1970
cQuantum Beam Science Center, Japan Atomic Energy Agency, 1-1-1 Koto, Sayo, Hyogo 679-5165, Japan. E-mail: daiju@spring8.or.jp
dSynchrotron Radiation Laboratory, The Institute for Solid State Physics, The University of Tokyo, 1-490-2 Kouto, Shingu-cho, Tatsuno, Hyogo 679-5165, Japan
eDivision of Chemistry, Graduate School of Science, Kyoto University, Kitashirakawa Oiwake-cho, Sakyo-ku, Kyoto 606-8502, Japan
fINAMORI Frontier Research Center, Kyushu University, 744 Motooka, Nishi-ku, Fukuoka 819-0395, Japan
gDepartment of Innovative and Engineered Materials, Tokyo Institute of Technology, 4259-J3-16, Nagatsuta, Midori, Yokohama 226-8502, Japan
hCenter for Synchrotron Radiation Research, Japan Synchrotron Radiation Research Institute (JASRI), 1-1-1 Koto, Sayo, Hyogo 679-5198, Japan. E-mail: sakata.osami@spring8.or.jp
First published on 26th May 2020
Abstract
To unveil the origin of the hydrogen-storage properties of rhodium nanoparticles (Rh NPs), we investigated the dynamical structural change of Rh NPs using in situ dispersive X-ray absorption fine structure spectroscopy (XAFS). The variation of the Rh–Rh interatomic distance and Debye–Waller factor of Rh NPs with a size of 4.0 and 10.5 nm during hydrogen absorption and desorption suggested that they have a different mechanism for hydrogen absorption, which is that the hydrogen absorption on the inner site has a greater contribution than that on a surface for Rh 4.0 nm. In the case of Rh 10.5 nm, it is opposed to Rh 4.0 nm. This study demonstrates a powerful in situ XAFS method for observing small local structural changes of metal nanoparticles and its importance for understanding of the hydrogen-absorption properties of Rh NPs with an interesting hydrogenation mechanism.
1 Introduction
Metal nanoparticles (NPs) have recently attracted much attention as advanced materials1–3 related to hydrogen-storage due to their unique abilities to store hydrogen compactly and safely as a consequence of the stability of hydrides. Rhodium (Rh) is an effective catalyst for various chemical reactions in the 4d transition metal series. The synthesis of metal NPs for improving catalytic activities and obtaining unexpected properties is a very hot topic owing to the quantum size effects and high surface area-to-volume ratios exhibited by NPs.4–6 For instance, while bulk Rh metal does not absorb hydrogen, Rh NPs do. Kusada et al. observed that the hydrogen-storage capacity of Rh NPs increases with decreasing particle size.7 They also reported that the enthalpy of hydrogen-storage in the Rh NPs changes from endothermic to exothermic with decreasing their particle sizes, with a critical size between 7.1 and 10.5 nm. These phenomena might be caused by a change in an electronic state of Rh with decreasing particle size.8,9 However, an origin of the hydrogen-storage property and performance of Rh NPs can hardly be described as one parameter and has not yet been revealed. Therefore, investigating the local crystal structure of such NPs is very important for understanding their catalyst properties. Song et al.10 reported that from the bond-orientational order analysis, the localized disordering is distributed over the surface part than the core part a lot and hydrogen, can be trapped on the surface part of Rh NPs, increased with decreasing NP diameter.A Rh hydride phase is only formed the smaller Rh NPs (below to 2.3 nm size) under ambient pressure.11–13 On the other hand, bulk Rh absorbs hydrogen only a limited extent under ambient pressure and does not form a Rh hydride phase.14 Therefore, researchers have investigated the small size of Rh NPs to observe the Rh hydride. However, studies of hydrogen absorption on Rh NPs over 3 nm-diameter have been insufficient up to now. To deeply understand the hydrogen-storage property of Rh NPs, it is needed to observe the change of local structure during hydrogen absorption/desorption process.
X-ray absorption fine structure (XAFS) measurements are a powerful probe for observing the geometric and electronic structural change of metals during a reaction in solution. Especially, a dispersive XAFS mode adopting a bent crystal enables us to observe an XAFS spectrum without mechanical movement at all.15,16 The dispersive mode has been mainly applied for the real-time observation during chemical reaction.17–21
In this study, we report the investigation of the local structure changes of Rh NPs of two particle sizes with an average diameter of 4.0 and 10.5 nm, using in situ dispersive X-ray absorption fine structure spectroscopy (DXAFS). We discuss an origin of their hydrogen-absorption capability by comparison of the particle size/temperature dependence of the hydrogen absorption/desorption speed and hydrogen-storage capacity of the Rh NPs.
2 Experimental
2.1 Sample preparation
We investigated Rh NPs having two different sizes 4.0 and 10.5 nm in diameter, as shown in Table 1. The Rh NPs were fabricated by chemical reduction method. Poly(N-vinyl-2-pyrrolidone) (PVP) as the stabilizing agent was dissolved in ethylene glycol (EG), which was used as both the solvent and the reducing agent (solution 1). RhCl3·3H2O as a metal precursor was dissolved in water (solution 2). While solution 1 was heated at 196 °C with stirring, solution 2 was added to solution 1 over 10 min. The solution mixture of solution 1 and solution 2 was maintained for 1.5 h. The Rh NPs were achieved by centrifugation. The detailed recipe was described in ref. 7. The particle sizes of the prepared samples were determined from transmission electron microscopy (TEM) images. The details of the determination of NP sizes from the size histograms and temperature dependences for the hydrogen pressure-composition (PC) isotherms are also described in Note 1 and 2 in the ESI.†| Size (TEM)/nm | Metal precursor/mmol | Solvent/mL | PVP/mmol | H/Rh at 303 K | H/Rh at 373 K |
|---|---|---|---|---|---|
| 4.0 ± 0.7 | RhCl3·3H2O/2.0 | EG/220 | 10.0 | 0.185 | 0.072 |
| 10.5 ± 1.5 | RhCl3·3H2O/5.0 | EG/200 | 5.0 | 0.067 | 0.090 |
2.2 Dispersive X-ray absorption fine structure (DXAFS)
The mixture of powdered Rh NPs (7.5 mg) and boron nitride (BN) (25 mg) was set into a cylindrical sample holder (inner ϕ7 × 10 mm3) and pressed by hand in order to make a disk pellet. The sample holder with the pellet was placed in an in situ flow type XAFS cell.17 Samples were reduced to complete metal state by H2 (10%)/He gas of 100 cm3 min−1 flow at room temperature for 10 min. The Rh K-edge XAFS in situ spectra were measured by an energy dispersive and time-resolved mode at the bending magnet beamline BL14B1 of SPring-8, Japan.22 Dispersed X-rays were generated by a bent crystal of Si (422) lattice planes with the Laue configuration. Although this lattice planes contain the second higher harmonics, the stronger X-ray intensity than that from all-odd reflection planes can be used. A polychromator was bent horizontally by setting it in a curved stainless steel block cooled by the water. From the curvature with a radius of 3 m, X-rays with an energy range of 1000 eV were generated. Respective samples were set to the focal point of X-rays. A Gd2O2S(Tb) scintillator was exposed to re-dispersed X-ray and emitted lights were collected using a complementary metal–oxide–semiconductor (CMOS) camera (2048 × 2048 channels, 16 bits). Signals in the vertical direction (400 channels) were summed up to produce a one-dimensional spectroscopy as a function of an incident photon energy. The horizontal focus size of the X-rays was measured to be 0.1 mm in full width at half maximum and the vertical size is equal to the sample pellet height for accumulating the intensity of transmitted X-rays. Neither vertical focusing nor the removal of higher-order reflection using a mirror was adopted. H2 (10%)/He and He gases were used for studying the hydrogen-storage property of Rh NPs as the absorption and desorption gases, respectively. The gases were supplied at a flow rate of 100 cm3 min−1. All XAFS spectra were collected under in situ conditions in the gas flow and time-resolved mode. Immediately after switching the gas flow, spectra were measured at a frame rate of 33 Hz. To improve counting statistics, XAFS spectra were accumulated 50 times in absorption and desorption processes. Namely, a sampling rate was 0.67 Hz (1.5 s). In situ and time-resolved DXAFS, which consists of the absorption process for 20 min and desorption for 40 min, was measured twice at 300 K and 373 K to confirm the reproducibility.3 Results
Fig. 1 shows the results of the 0.67 Hz observation of Rh K-edge XAFS spectra for Rh NPs taken with a dispersive mode during hydrogen absorption and desorption at 300 K and 373 K. The black and blue lines represent Rh NPs with a size of 4.0 and 10.5 nm in diameter, respectively. The direction of the arrows represents the increase of operation time during hydrogen absorption and desorption. It is noticed that the oscillations in the extended region from Rh absorption edge are clearly observed even in the case of the total observation time of 1.5 s (0.67 Hz). Generally, the oscillation wavelength contract and expand after hydrogen absorption and desorption, because of the change of inter-atomic distance. However, as can be seen in Fig. 1, there is no distinct change of oscillation wavelength, which suggests that hydrogen cannot be absorbed on the entire volume of Rh NPs. It can be realized a large interval (white line) between XAFS spectra in an early stage of hydrogen absorption and desorption. The enlarged part of Fig. 1 is also shown in Fig. S2 in the ESI.† It is originated from the change of background, due to the gas change between H2 (10%)/He and He.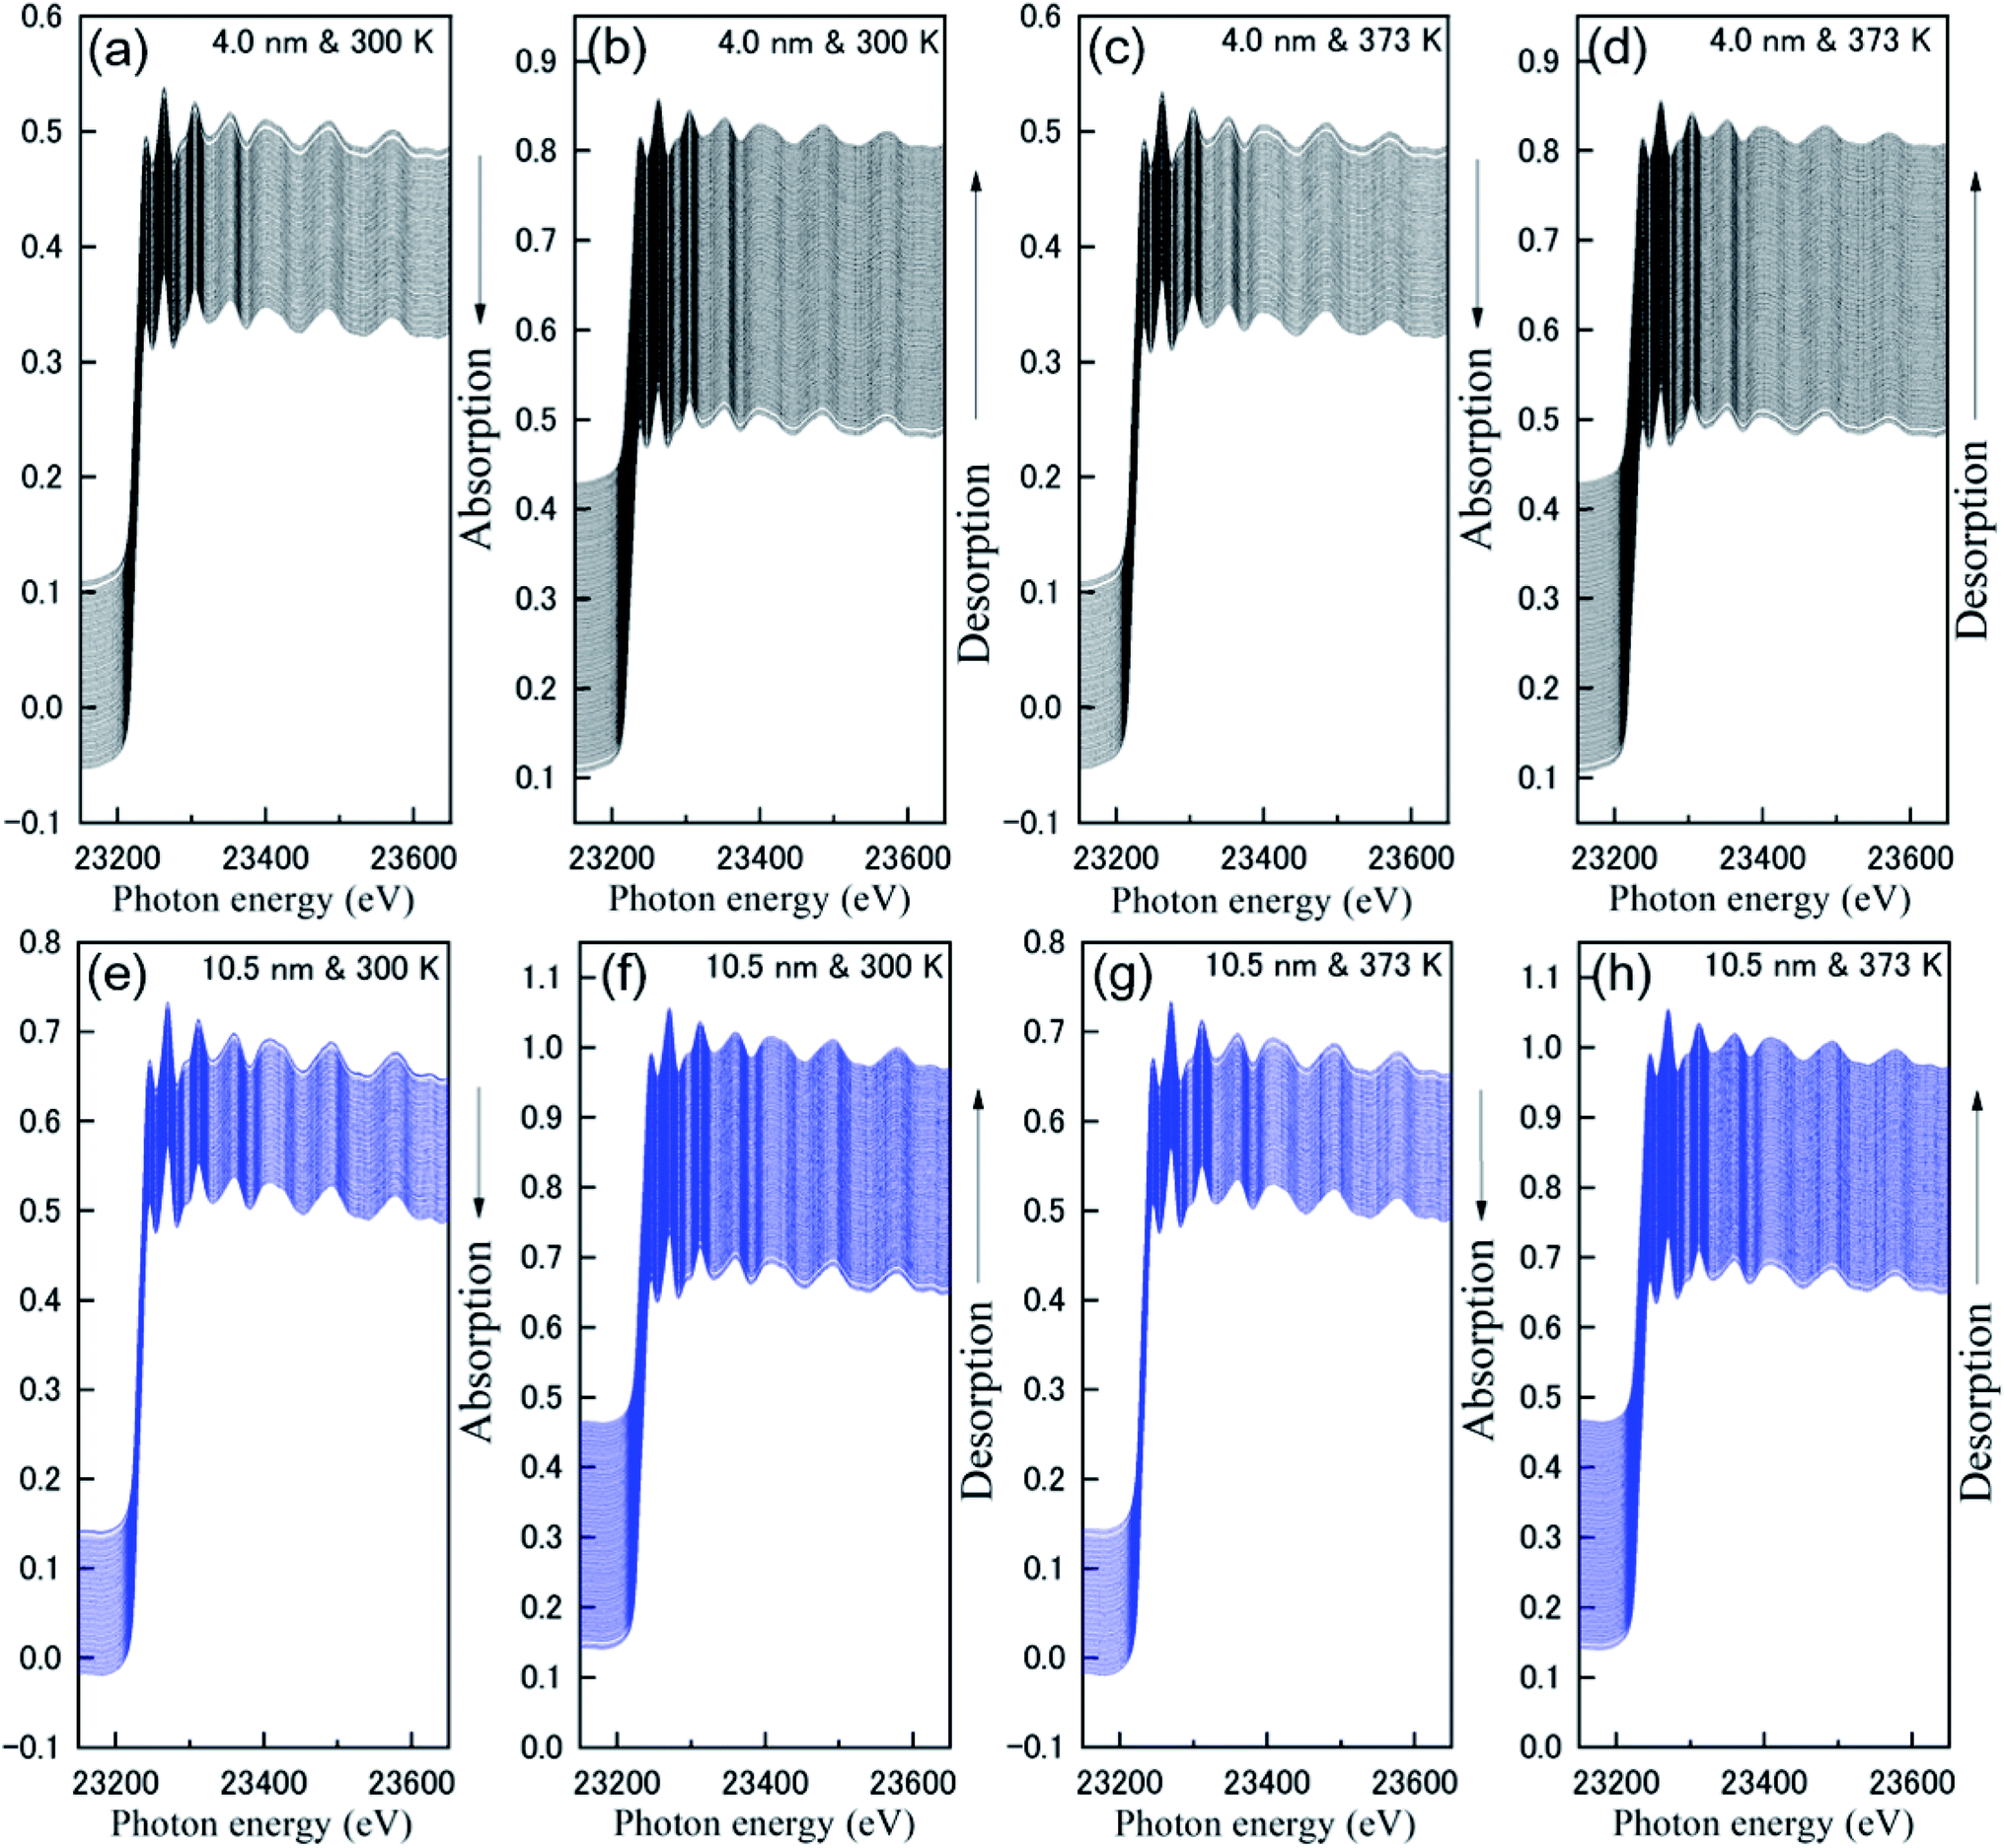 | ||
| Fig. 1 Real-time-resolved Rh K-edge XAFS spectra during the hydrogen absorption and desorption of the Rh NPs: (a) absorption, (b) desorption at 300 K and (c) absorption, (b) desorption at 373 K for Rh NPs with a size of 4.0 nm. (e) Absorption, (f) desorption at 300 K and (g) absorption, (h) desorption at 373 K for Rh NPs with a size of 10.5 nm. | ||
We discuss near-edge structures in XAFS spectra before and after hydrogen absorption at 300 K on Rh 4.0 nm are shown in Fig. 2. An in situ XAFS with dispersive optics is powerful for observing small local structural changes even though it is hard for the convent to detect.
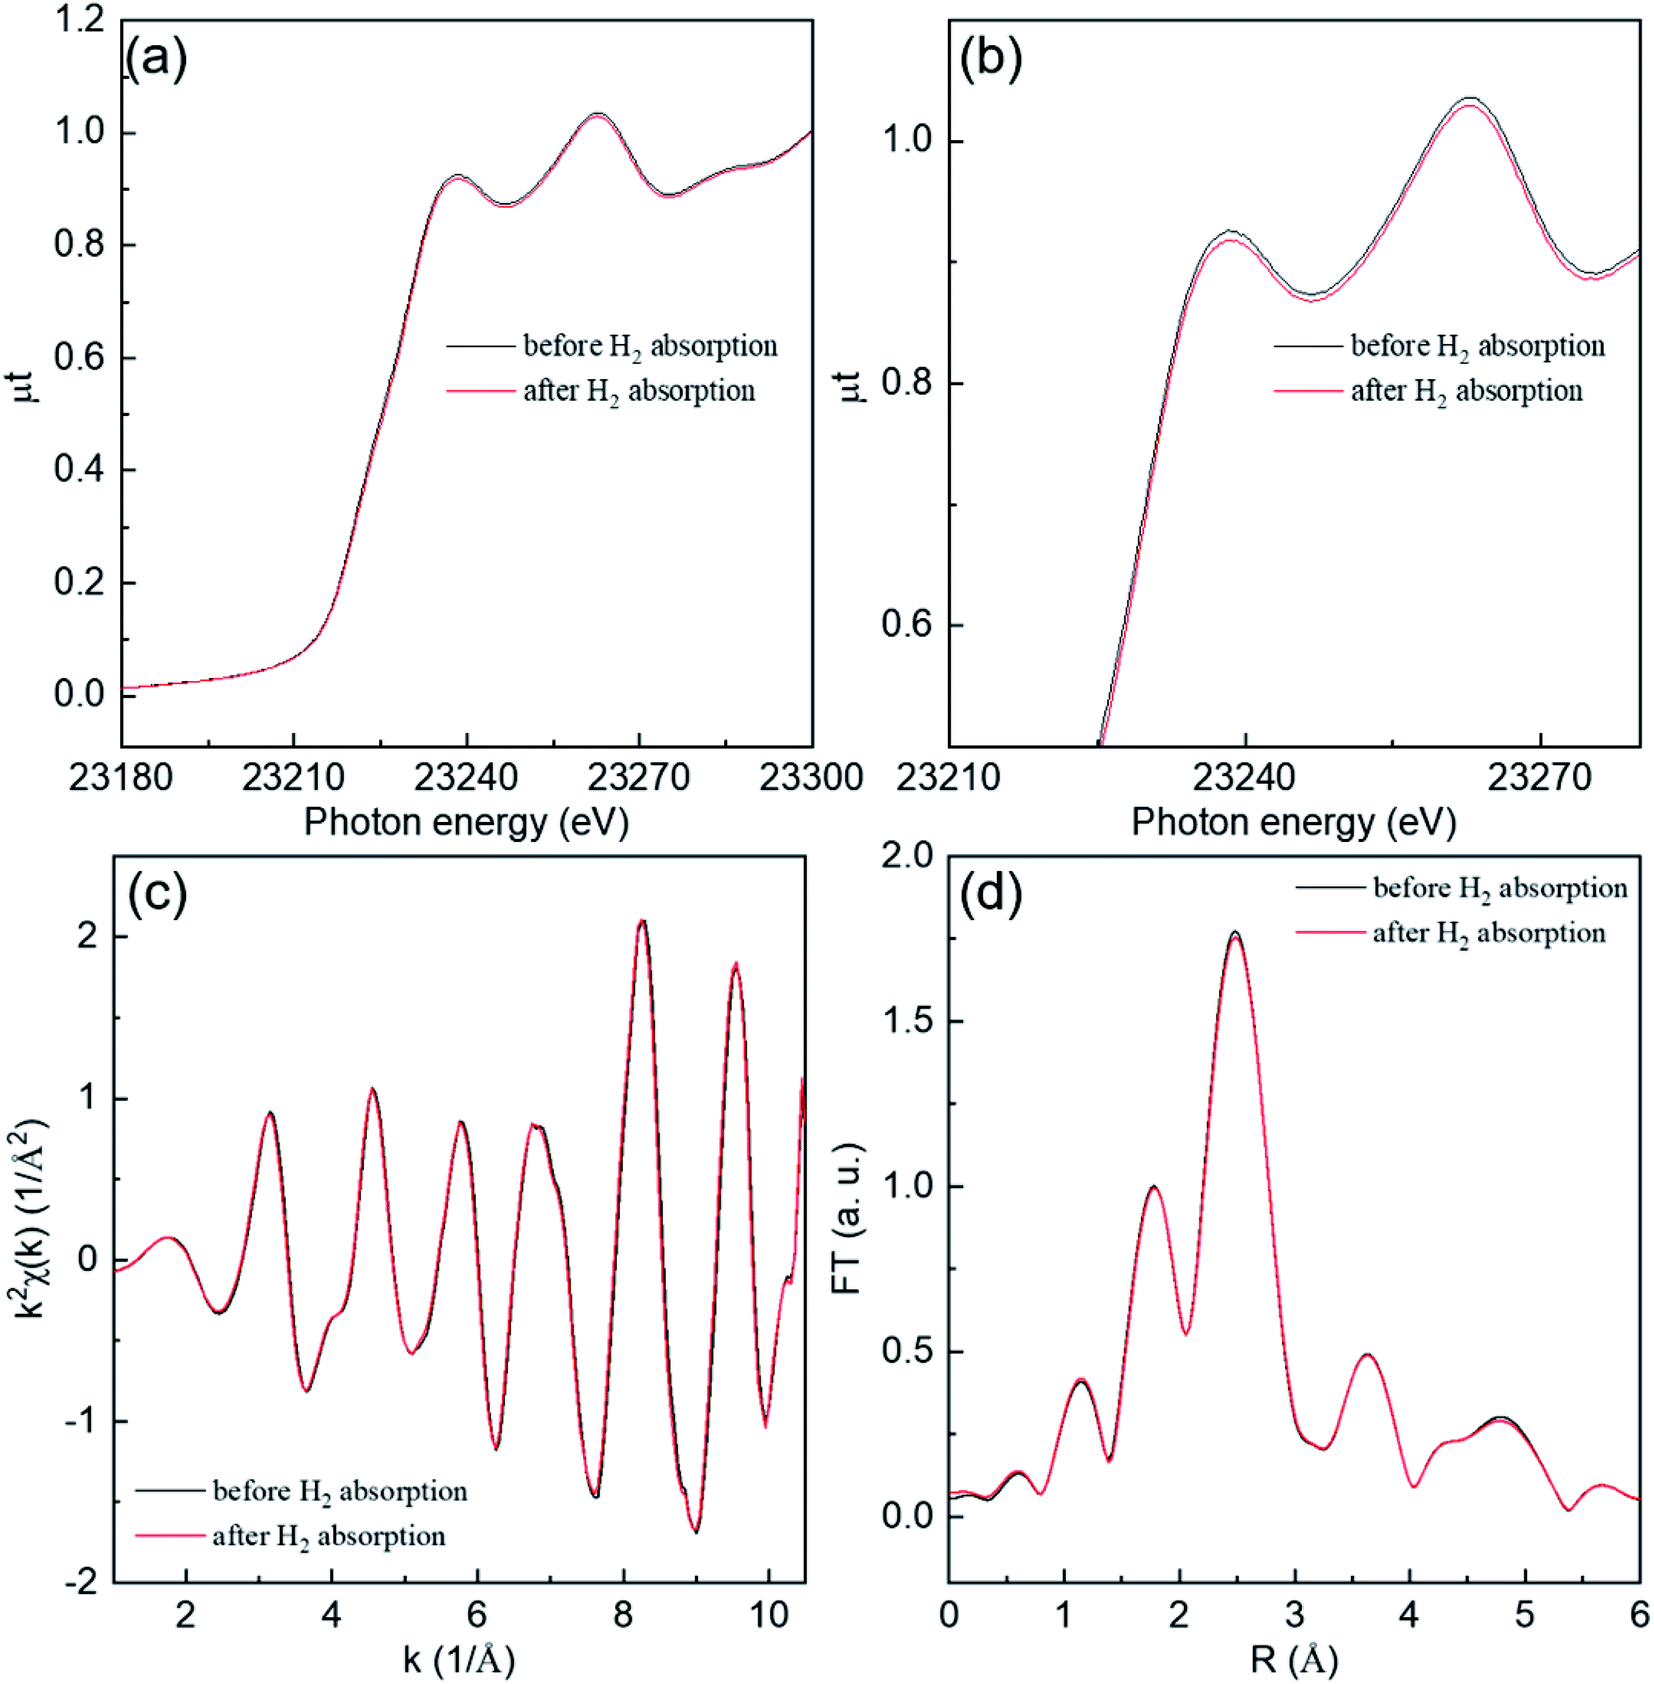 | ||
| Fig. 2 Rh K-edge (a) X-ray absorption near edge structure (XANES) spectra, (b) enlarged view of (a), (c) EXAFS functions, and (d) Fourier transform intensities before and after hydrogen absorption at 300 K on for Rh NP with a size of 4.0 nm. The black and red lines represent information of before and after hydrogen absorption, respectively. | ||
To accurately observe the change of local structure due to the hydrogen absorption and desorption of the Rh NPs, we plotted the time dependence of relative change of Rh–Rh interatomic distance (ΔRRh–Rh) in Fig. 3 and Debye–Waller factor (DWF) values during the hydrogen absorption and desorption of the Rh NPs at 300 K and 373 K. The black and blue closed circles are plotted for Rh NPs 4.0 and Rh 10.5 nm, respectively. The solid red lines are fitting results with a logistic function of ΔRRh–Rh = A2 + (A1 − A2)/(1 + (t/t1/2)p). Here, A1 − A2: maximum value of Rh–Rh interatomic distance (ΔRRh–Rh, max), t1/2: time at a half maximum of ΔRRh–Rh, p: power (Table 2).
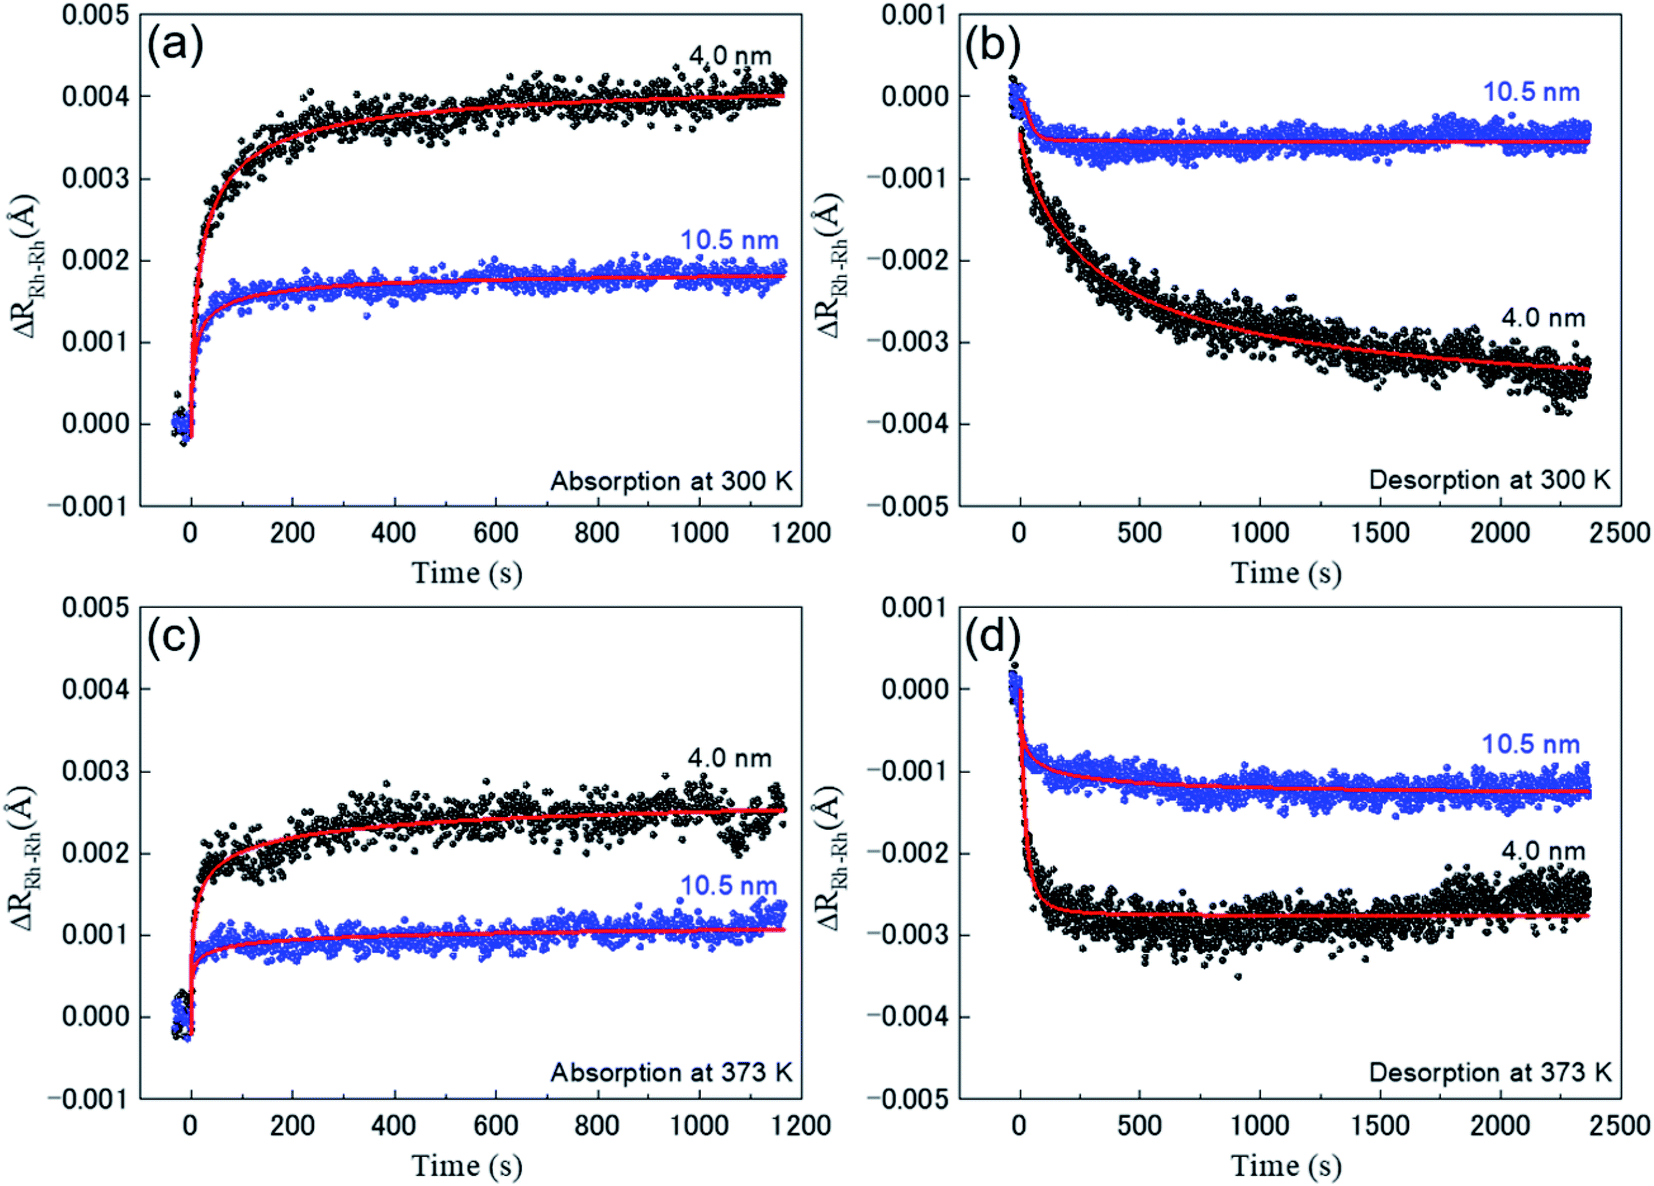 | ||
| Fig. 3 Real-time relative change of Rh–Rh interatomic distance (ΔRRh–Rh) during the hydrogen absorption and desorption process: (a) absorption, (b) desorption at 300 K and (c) absorption, (d) desorption at 373 K. The black and blue closed circles represent Rh NPs with a size of 4.0 and 10.5 nm, respectively. The solid red lines are fitting results with a function of ΔRRh–Rh = A2 + ((A1 − A2))/1 + (t/t1/2)p. | ||
| Sample & condition | Rh 4.0 nm | Rh 10.5 nm | ||||||
|---|---|---|---|---|---|---|---|---|
| 303 K | 373 K | 303 K | 373 K | |||||
| Abs. | Des. | Abs. | Des. | Abs. | Des. | Abs. | Des. | |
| ΔRRh–Rh,max (Å) | 0.00428 | −0.00386 | 0.00297 | −0.00276 | 0.00192 | −0.0005 | 0.00130 | −0.00135 |
| ±3.1 × 10⁻⁵ | ±5.5 × 10⁻⁵ | ±1.1 × 10⁻⁴ | ±6.2 × 10⁻⁶ | ±2.1 × 10⁻⁵ | ±2.7 × 10⁻⁶ | ±1.1 × 10⁻⁴ | ±2.4 × 10⁻⁵ | |
| t1/2 (s) | 20.063 | 338.567 | 11.753 | 22.661 | 8.395 | 41.343 | 9.946 | 21.764 |
| ±1.674 | ±11.898 | ±3.111 | ±1.872 | ±1.308 | ±3.532 | ±6.011 | ±5.768 | |
Respective changes look clearly different, which demonstrates convincingly that the hydrogen absorption and desorption mechanism of Rh NPs strongly depend on the particle size and temperature. The evaluated ΔRRh–Rh,max and t1/2 are summarized in Table 3. The value of ΔRRh–Rh,max of Rh 4.0 nm is greater than that of Rh 10.5 nm for the same temperature during hydrogen absorption. At 300 K, this result is agreement with the hydrogen-storage capacity. However, there is a discrepancy between ΔRRh–Rh,max and the hydrogen-storage capacity for Rh 10.5 nm. Namely, the value of ΔRRh–Rh,max at 300 K for Rh 10.5 nm is greater than that at 373 K during hydrogen absorption. For hydrogen-storage capacity, the value at 373 K is larger than that at 300 K.7 This result suggests that hydrogen absorption on Rh NPs has two process types; one is a chemisorption on the surface and an occupation of subsurface (inner) sites and the other is the diffusion into the bulk. Hydrogen adsorption on a surface of Rh NPs cannot affect the change of Rh–Rh interatomic distance. Especially, it is noted that the behavior of ΔRRh–Rh for Rh 4.0 nm during desorption at 300 K shows a slow relaxation process, compared with the others. This desorption process has a large value of t1/2, meaning that hydrogen absorption can occur inside the NPs. ΔRRh–Rh,max of absorption process decreases with increasing temperature for both Rh NPs, which implies that a larger thermal vibration may interrupt the hydrogen-absorption.
Fig. 4 shows the time-resolved observation of DWF during the hydrogen absorption and desorption of the Rh NPs at 300 K and 373 K. The black and blue closed circles are plotted for Rh NPs 4.0 nm and Rh 10.5 nm, respectively. The thermal vibration and static disorder in the bond length or local structure is reflected in the DWF.23,24 The decrease of DWF is originated from a static disorder or the restrained thermal vibration of Rh atoms due to the absorbed hydrogen. The large DWF of Rh 4.0 nm during hydrogen absorption compared to Rh 10.5 nm suggests that the surface area to volume ratio of Rh 4.0 nm is large so that the possibility of hydrogen absorption by the surface is higher than that of Rh 10.5 nm. Normal hydrogen storage alloys show the increase of DWF by hydrogen absorption. However, in our case, because only the surface layers of Rh NPs absorb hydrogen, H/Rh is negligibly small and ΔR is also small. Such a case may hide the small change of DWF by hydrogenation. From a different point of view, almost the constant value for DWF by hydrogenation indicates that small NPs have a distortion in the inside of metal NP.10,25 Hydrogen absorption reaction can release the distortion of Rh NP.
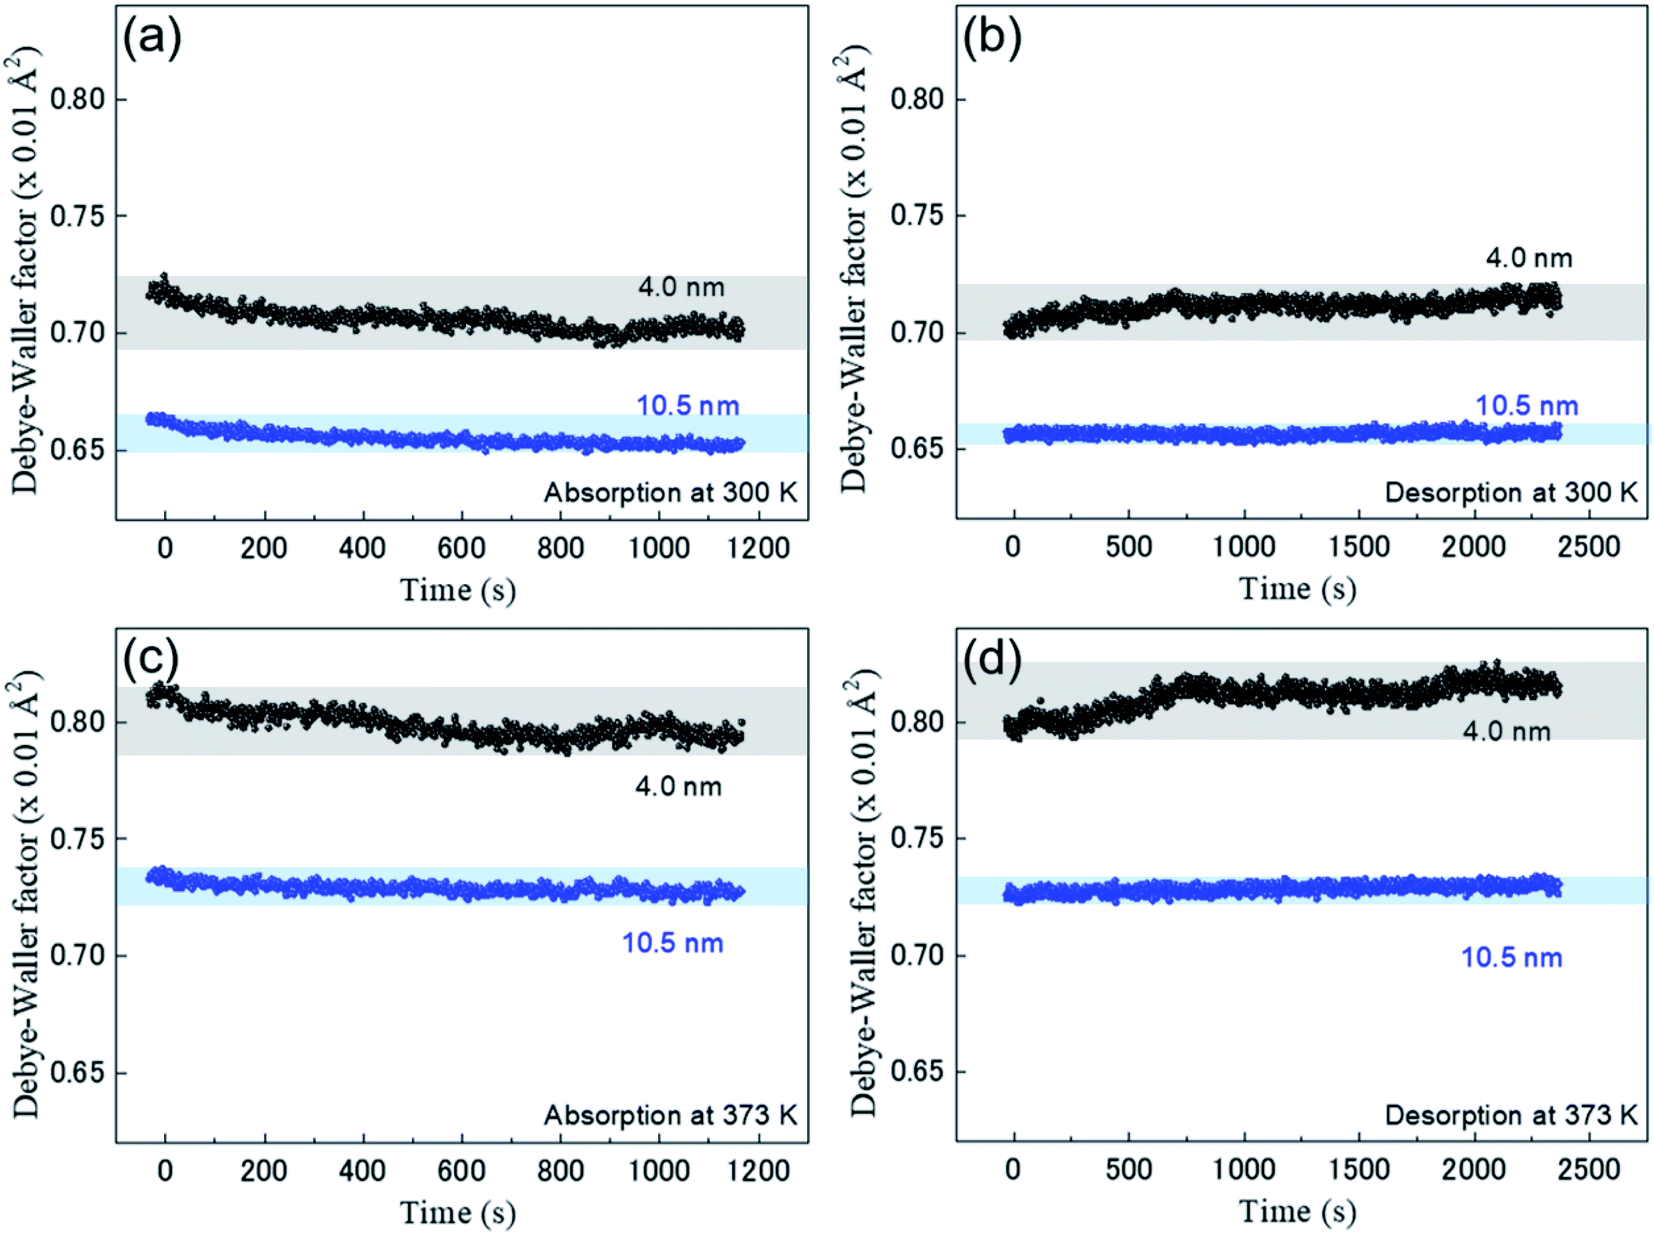 | ||
| Fig. 4 Real-time-resolved Debye–Waller factor (DWF) during the hydrogen absorption and desorption of the Rh NPs: (a) absorption, (b) desorption at 300 K and (c) absorption, (d) desorption at 373 K. The black and blue closed circles represent Rh NPs with a size of 4.0 and 10.5 nm, respectively. | ||
4 Discussion
As mentioned in the results section, it seems the hydrogen-absorption mechanism of Rh 4.0 nm is different to that of Rh 10.5 nm. The hydrogen-absorption model of Rh NPs is depicted in Fig. 5. Several reaction stages of hydrogen with a metal would occur, as shown in Fig. 5(a) when a hydrogen molecule is loaded on the metal surface. The kinetics process of reaction stages is as follows: (i) physisorption of the hydrogen molecule through van der Waals interaction with the metal surface, (ii) chemisorption of hydrogen after their dissociation (H2 → 2H), and (iii) occupation of subsurface (inner) sites and diffusion into the inside. The Rh–H bond gets stronger in stage (iii) than stage (i) and (ii). It can also lead to the localized disorder/the expansion of interatomic distance, which is shown in the cyan colored atoms of Fig. 5(a). Stage (iii) is based on the fact that Rh–Rh interatomic distance of Rh 4.0 nm during hydrogen absorption is more expanded than that of Rh 10.5 nm as mentioned above. On the contrary, the existence possibility of stage (i) and (ii) is higher than that of stage (iii) for Rh 10.5 nm, as shown in Fig. 5(c). The larger DWF of Rh 4.0 nm in Fig. 4, along with the result of the behavior of Rh–Rh interatomic distance, is another clue for supporting the hydrogen-absorption model of Rh NPs in Fig. 5(b) and (c).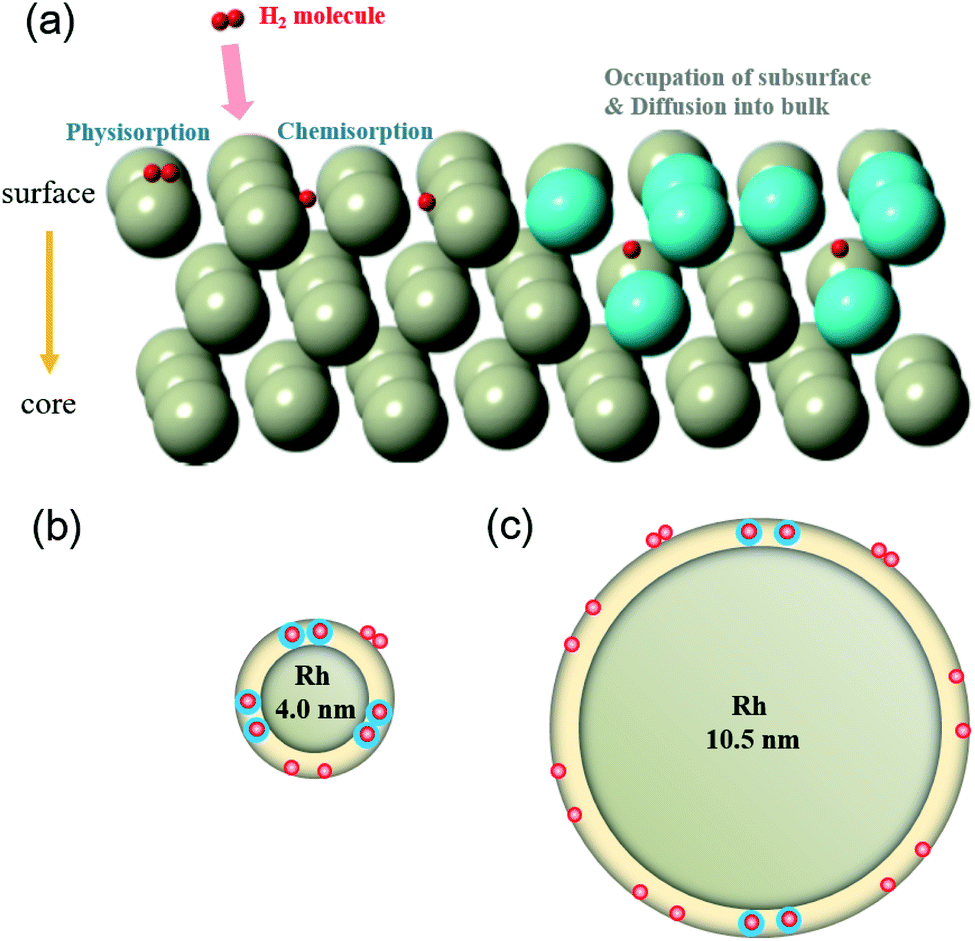 | ||
| Fig. 5 (a) Schematic view of the reaction between hydrogen and surface on Rh NPs. Hydrogen-absorption model of (b) Rh 4.0 nm (c) Rh 10.5 nm when hydrogen is absorbed on their surface. The cyan colored area indicates the disordered region due to the occupation of subsurface and the diffusion into the bulk. | ||
Hydrogen-absorption kinetics and performance are mainly affected by the morphology and chemical composition of the samples which eventually depends on the preparation routes.9,26–28 The operation temperature is another important factor which can affect the hydrogen-absorption kinetics and performance. To fully reveal the size effect of the hydrogen-absorption model of Rh NPs, activation energies of hydrogen absorption/desorption for Rh NPs were calculated using Arrhenius equation,29 which is expressed eqn (S1) and (S2) in the ESI.†
The rate constant 1/t1/2 was obtained from the fitting results of the change of the Rh–Rh interatomic distance (see Fig. 3 and Table 3). The slopes of ln[1/t1/2] versus 1000/T give us a value of −Ea/R × 1000, which is ultimately converted into the activation energy (Ea). The Arrhenius plots of hydrogen adsorption/desorption for Rh NPs are shown in Fig. S3 in the ESI.† The activation energies of hydrogen absorption for Rh 4.0 nm and Rh 10.5 nm were 6.82 and −2.16 kJ mol−1, respectively. Especially, although the negative activation energy for Rh 10.5 nm is negligible within an error bar, this result may be closely related to the changeover of the thermodynamic behavior for hydrogen storage, which changes from endothermic to exothermic with decreasing their particle size. The activation energies of hydrogen desorption for Rh 4.0 nm and Rh 10.5 nm were 34.46, 8.18 kJ mol−1, respectively, indicating that Rh 4.0 nm and Rh 10.5 nm have different mechanisms for hydrogen desorption. It is also supported by the hydrogen-absorption model of Rh NPs in Fig. 5(b) and (c). The information of the dynamic local structure obtained in the present work will contribute to understand the hydrogen-absorption property of nano-sized metals.
Table 3 shows the evaluated values of the interatomic distance of the Rh NPs under N2 and H2 gas environments. Morfin et al., reported that there were no changes in the interatomic distance R and the DWF in bulk Rh under N2 and H2 gas condition at room temperature.11 On the other hand, the interatomic distance of 2.682 Å![[thin space (1/6-em)]](https://www.rsc.org/images/entities/char_2009.gif) of Rh 1.0 nm-diameter NPs under the H2 gas conditions was larger than that of 2.667 Å under the N2 gas condition. Our results are consistent with the increment in hydrogen absorption for the smaller Rh NPs. In addition, there was an increase of the interatomic distance of 0.004 Å in the 4.0 nm-diameter (2.685 Å) and an increase of about 0.002 Å in the 10.5 nm-diameter (2.687 Å).
of Rh 1.0 nm-diameter NPs under the H2 gas conditions was larger than that of 2.667 Å under the N2 gas condition. Our results are consistent with the increment in hydrogen absorption for the smaller Rh NPs. In addition, there was an increase of the interatomic distance of 0.004 Å in the 4.0 nm-diameter (2.685 Å) and an increase of about 0.002 Å in the 10.5 nm-diameter (2.687 Å).
5 Conclusions
We have investigated the dynamical structural change of Rh NPs using in situ time-resolved dispersive X-ray absorption fine structure spectroscopy at 300 K and 373 K. The structural change of Rh nanoparticles was observed by a 33.3 Hz rate. From the results obtained in the present study, it is confirmed as follows: during hydrogen absorption and desorption, (1) the difference of the Rh–Rh interatomic distance increases/decreases with decreasing particle size and increasing temperature. (2) The behavior of the Rh–Rh interatomic distance for Rh 4.0 nm during desorption at 300 K shows a slow relaxation process, compared to the others. It is closely related to the contribution of hydrogen absorption on the inner site. (3) The value of DWF decreases/increases during hydrogen absorption/desorption. The decrease of DWF is originated from a static disorder or the restrained thermal vibration of Rh atoms due to the absorbed hydrogen. (4) The activation energy for hydrogen absorption/desorption of Rh 4.0 nm is larger than that of Rh 10.5 nm. It is concluded that the hydrogen absorption on the inner site is more contributed than that on the surface for Rh 4.0 nm. In the case of Rh 10.5 nm, it is opposed to Rh 4.0 nm. It is hoped that these findings will enable us to understand of the hydrogen absorption property of metal NPs with an interesting hydrogenation mechanism.Conflicts of interest
There are no conflicts to declare.Acknowledgements
This work was partly supported by ACCEL (JPMJAC1501) of the Japan Science and Technology Agency (JST). The DXAFS measurements were performed at BL14B1 in SPring-8 with the approval of the Japan Synchrotron Radiation Institute under Proposal No. 2017B3632, 2018A3630, 2018A3632, 2018B3632, and 2019B3646 under the Shared Use Program of JAEA Facilities (Proposal No. 2017B-E03, 2018A-E02, 2018A-E03, 2018B-E06, and 2019B-E05), which are approved as part of the JAEA Nanotechnology Platform (Proposal No. JPMXP09A17AE0023, JPMXP09A18AE0002, JPMXP09A18AE0003, JPMXP09A18AE0026, and JPMXP09A19AE0025). This work was also partly supported by Japan Society for the Promotion of Science (JSPS) KAKENHI (Grants No. 18K04868 and 20K15083) and Basic Science Research Program through the National Research Foundation of Korea (NRF) funded by the Ministry of Education (Grant No. 2018R1A6A3A03012052). O. Sakata, C. Song, and H. Kitagawa managed the project. K. Kusada, H. Kobayashi, and H. Kitagawa synthesized the samples. O. Sakata, C. Song, O. Seo, D. Matsumura, S. Hiroi, Y.-T. Cui, J. Kim, Y. Chen, A. Tayal performed the XAFS experiments. C. Song, O. Seo, and D. Matsumura analyzed all the experimental data. C. Song, O. Seo, D. Matsumura, and O. Sakata wrote the manuscript with contribution from Y.-T. Cui.References
- S. K. Konda and A. Chen, Mater. Today, 2016, 19, 100–108 CrossRef CAS.
- H. Kobayashi, M. Yamauchi, H. Kitagawa, Y. Kubota, K. Kato and M. Takata, J. Am. Chem. Soc., 2008, 130, 1818–1819 CrossRef CAS PubMed.
- H. Kobayashi, M. Yamauchi, H. Kitagawa, Y. Kubota, K. Kato and M. Takata, J. Am. Chem. Soc., 2008, 130, 1828–1829 CrossRef CAS PubMed.
- A. Zaluska, L. Zaluski and J. Ström-Olsen, J. Alloys Compd., 1999, 288, 217–225 CrossRef CAS.
- R. Kubo, J. Phys. Soc. Jpn., 1962, 17, 975–986 CrossRef CAS.
- A. Henglein, Chem. Rev., 1989, 89, 1861–1873 CrossRef CAS.
- K. Kusada, H. Kobayashi, R. Ikeda, H. Morita and H. Kitagawa, Chem. Lett., 2013, 42, 55–56 CrossRef CAS.
- H. Kobayashi, H. Morita, M. Yamauchi, R. Ikeda, H. Kitagawa, Y. Kubota, K. Kato and M. Takata, J. Am. Chem. Soc., 2011, 133, 11034–11037 CrossRef CAS PubMed.
- Hydrogen in Metals, ed. G. Alefeld and J. Völkl, Springer, Berlin, 1978 Search PubMed.
- C. H. Song, A. Yang, O. Sakata, L. S. R. Kumara, S. Hiroi, Y.-T. Cui, K. Kusada, H. Kobayashi and H. Kitagawa, Phys. Chem. Chem. Phys., 2018, 20, 15183–15191 RSC.
- F. Morfin, L. Blondeau, K. Provost, A. Malouche, L. Piccolo and C. Zlotea, Catal. Sci. Technol., 2018, 8, 2707–2715 RSC.
- C. Cachet-Vivier, S. Bastide, C. Zlotea, Y. Oumellal, M. Laurent and M. Latroche, Electrochim. Acta, 2017, 228, 528–536 CrossRef CAS.
- C. Zlotea, Y. Oumellal, M. Msakni, J. Bourgon, S. Bastide, C. Cachet-Vivier and M. Latroche, Nano Lett., 2015, 15, 4752–4757 CrossRef CAS PubMed.
- A. Driessen, P. Sanger, H. Hemmes and R. Griessen, J. Phys.: Condens. Matter, 1990, 2, 9797–9814 CrossRef CAS.
- T. Matsushita and R. P. Phizackerley, Jpn. J. Appl. Phys., 1981, 20, 2223–2228 CrossRef CAS.
- U. Kaminaga, T. Matsushita and K. Kohra, Jpn. J. Appl. Phys., 1981, 20, L355–L358 CrossRef CAS.
- A. Suzuki, A. Yamaguchi, T. Chihara, Y. Inada, M. Yuasa, M. Abe, M. Nomura and Y. Iwasawa, J. Phys. Chem. B, 2004, 108, 5609–5616 CrossRef CAS.
- A. J. Dent, J. Evans, S. G. Fiddy, B. Jyoti, M. A. Newton and M. Tromp, Angew. Chem., Int. Ed., 2007, 46, 5356–5358 CrossRef CAS PubMed.
- M. A. Newton, C. Belver-Coldeira, A. Martínez-Arias and M. Fernández-García, Nat. Mater., 2007, 6, 528–532 CrossRef CAS PubMed.
- A. Suzuki, Y. Inada, A. Yamaguchi, T. Chihara, M. Yuasa, M. Nomura and Y. Iwasawa, Angew. Chem., Int. Ed., 2003, 42, 4795–4799 CrossRef CAS PubMed.
- T. Yamamoto, A. Suzuki, Y. Nagai, T. Tanabe, F. Dong, Y. Inada, M. Nomura, M. Tada and Y. Iwasawa, Angew. Chem., 2007, 119, 9413–9416 CrossRef.
- Y. Okajima, D. Matsumura, Y. Nishihata, H. Konishi and J. Mizuki, AIP Conf. Proc., 2007, 879, 1234–1237 CrossRef CAS.
- P. Debye, Ann. Phys., 1913, 348, 49–92 CrossRef.
- I. Waller, Z. Phys., 1923, 17, 398–408 CrossRef CAS.
- O. Seo, J. Kim, A. Tayal, C. Song, L. S. R. Kumara, S. Dekura, H. Kobayashi, H. Kitagawa and O. Sakata, RSC Adv., 2019, 9, 21311–21317 RSC.
- S. Kumar and N. Krishnamurthy, Int. J. Hydrogen Energy, 2012, 35, 191–195 CAS.
- S. Kumar and N. Krishnamurthy, Int. J. Hydrogen Energy, 2012, 37, 13429–13436 CrossRef CAS.
- K. Kusada, H. Kobayashi, R. Ikeda, Y. Kubota, M. Takata, S. Toh, T. Yamamoto, S. Matsumura, N. Sumi, K. Sato, K. Nagaoka and H. Kitagawa, J. Am. Chem. Soc., 2014, 136, 1864–1871 CrossRef CAS PubMed.
- M. Menzinger and R. L. Wolfgang, Angew. Chem., Int. Ed. Engl., 1969, 8, 438–444 CrossRef CAS.
Footnotes |
| † Electronic supplementary information (ESI) available: Particle size distributions of Rh NPs, hydrogen pressure-composition (PC) isotherms and enlarge part of real-time-resolved Rh K-edge XAFS spectra (Fig. S1–S3). Activation energy of hydrogen absorption and desorption (Fig. S4). See DOI: 10.1039/d0ra03322g |
| ‡ There authors contributed equally to this work. |
| This journal is © The Royal Society of Chemistry 2020 |