
 Open Access Article
 This Open Access Article is licensed under a Creative Commons Attribution-Non Commercial 3.0 Unported Licence
Effect of polyvinylpyrrolidone (PVP) on palladium catalysts for direct synthesis of hydrogen peroxide from hydrogen and oxygen†
Geun-Ho Hana,
Seok-Ho Leea,
Myung-gi Seo*ab and
Kwan-Young Lee *ac
*ac
aDepartment of Chemical and Biological Engineering, Korea University, 145 Anam-ro, Seoul 02841, Republic of Korea. E-mail: kylee@korea.ac.kr; Fax: +82-2-926-6102; Tel: +82-2-3290-3299
bLotte Chemical, 115 Gajeongbuk-ro, Daejeon 34110, Republic of Korea. E-mail: bluebird677@gmail.com; Fax: +82-2-926-6102; Tel: +82-2-3290-3727
cGraduate School of Energy and Environment (KU-KIST Green School), Korea University, Seoul 02841, Republic of Korea
First published on 27th May 2020
Abstract
When synthesizing nanoparticles in the liquid phase, polymeric materials (mainly polyvinylpyrrolidone, PVP) are applied as capping and/or stabilizing agents. The polymer layer on the nanoparticles must likely be removed since it blocks the active sites of the catalyst and inhibits mass transfer of the reactants. However, we have found that the polymer can have a positive effect on the direct synthesis of hydrogen peroxide. By testing Pd/SiO2 catalysts with different amounts of PVP, it was revealed that an adequate amount of PVP resulted in a higher rate of hydrogen peroxide production (1001 mmolH2O2 gPd−1 h−1) than pristine Pd/SiO2 did (750 mmolH2O2 gPd−1 h−1), unlike other PVP added Pd/SiO2 catalysts containing excess PVP (less than 652 mmolH2O2 gPd−1 h−1). The effect of PVP on the catalysts was examined by transmission electron microscopy, Fourier transform infrared spectroscopy, CO chemisorption, thermogravimetric analysis, and X-ray photoelectron spectroscopy. For the catalysts containing PVP, the oxidation state of the palladium 3d shifted to high binding energy due to electron transfer from Pd to the PVP molecules. Consequently, the presence of PVP on the catalysts inhibited oxygen dissociation and decomposition of the produced hydrogen peroxide, resulting in a high selectivity and high production rate of hydrogen peroxide.
Introduction
Hydrogen peroxide (H2O2) is used for numerous applications in global industries, including in the bleaching of pulp and paper, waste water treatment, semiconductor cleaning, soil remediation and the oxidization of chemical compounds.1,2 In particular, hydrogen peroxide is used to oxidize propene to produce value-added propylene oxide (Hydrogen Peroxide Propene Oxide, HPPO process). Commercially, hydrogen peroxide is manufactured by an auto-oxidation of anthraquinone which generates large amounts of harmful organic substances such as anthraquinone compounds.3 In addition, the commercial process requires substantial financial capital because it is separate redox processes involving complex multistage procedures. Moreover, it is only suitable for large-scale production, leading to difficulties associated with the transportation and storage of the produced hydrogen peroxide.4 To overcome these issues, there has been great research interest in developing catalysts for the direct synthesis of hydrogen peroxide (DSHP) from hydrogen (H2) and oxygen (O2).5–10The DSHP involves four primary reactions, as shown in Scheme 1. In addition to the desired reaction (1) that produces H2O2, three side reactions, namely, the formation of H2O (2), the hydrogenation of H2O2 (3) and the decomposition of H2O2 (4), also occur. All the reactions are spontaneous due to their negative Gibbs free energies;11 therefore, it is challenging to directly and selectively produce hydrogen peroxide. Additionally, the three-phase reaction system which results from the solid catalysts, liquid media, and gas reactants severely inhibits mass transfer of the reactants (H2 and O2). Hence, to overcome the hurdles that preclude the commercialization of the DSHP, the low yield of hydrogen peroxide should be solved by improving the conversion of reactants as well as the selectivity for hydrogen peroxide.
 | ||
| Scheme 1 Reaction pathways involved in the formation of hydrogen peroxide. | ||
Recent studies have attempted to achieve this goal. In particular, computational chemistry12–14 and nanoparticle catalysts15–18 have been explored for improving the catalytic performance in the synthesis of hydrogen peroxide. In particular, a number of tailored structures and nanocatalysts with multiple metals have been developed. The exposed plane index of the metal nanoparticles (NPs) can be controlled based on the shape of the nanoparticles. The selectivity for hydrogen peroxide in the DSHP was improved by exposing only the (111) plane of Pd, as revealed by density functional theory (DFT) calculations by P. Tian et al.12,19 The effect of the size of the nanoparticles in the range of 3.5–20 nm was also examined. Our previous studies showed that smaller Pd nanoparticles showed lower hydrogen peroxide selectivity because the dangling bonds on the corner and edge sites of the nanoparticles facilitated O–O dissociation.20,21 In addition, bimetallic nanoparticles, including Pd–Pt, Pd–Au and Ag–Pt, offer improved yields of hydrogen peroxide, and reliable tools were applied to reveal their catalytic activities.16,17,22
To synthesize the desired nanoparticles according to the aim, capping and/or stabilizing agents must be used.23 Major function of stabilizing agents (e.g., polyvinylpyrrolidone (PVP), and citric acid) can be summarized as follows: surface stabilizer, reducing agent, nanoparticle dispersant, and growth modifier.24–26 In a specific synthetic conditions, it stabilizes nanoparticles by enclosing their surfaces as well as provides individual space of nanoparticles by giving repulsive force. Such as PVP, surfactant can also act as a mild reducing agent for reduction metal salts. Moreover, preferable adsorption of surfactant on a specific facet of NPs induces facet controlled NPs like cubic, octahedral shape. Despite of those facile function of the surfactants, however, these agents on the surface of the nanoparticles could block the active sites and inhibit mass transfer of the reactants and products.11 Thus, the elimination of these agents is generally required before the catalytic reaction.6,11 Nevertheless, complete removal of the surfactants under mild conditions that do not alter the tailored structure of the nanoparticles is exceedingly difficult. Hence, investigating the effects of stabilizing agents on the surface is of great importance because they interact with the active sites and can alter the electronic structure. Moreover, the discrepancy between the results obtained by DFT calculations and the catalytic tests of the nanoparticles can likely be narrowed. Herein, the effects of polyvinylpyrrolidone (PVP), the most common surfactant for NPs synthesis, on the catalytic properties of these systems were elucidated. Because it is difficult to control the removal of PVP from the as-synthesized Pd nanoparticles (or remove it completely), we added PVP to the Pd/SiO2 catalyst. By varying the amount of adsorbed PVP on the Pd/SiO2, we found that PVP had a positive effect on the DSHP.
Experimental
Chemicals
Polyvinylpyrrolidone (PVP, Mw = 55![[thin space (1/6-em)]](https://www.rsc.org/images/entities/char_2009.gif) 000 g mol−1), palladium(II) nitrate dihydrate (Pd(NO3)2·2H2O), ethanol (ACS reagent, ≥ 99.5%, absolute), silica gel (specific surface area = 480 m2 g−1, pore volume = 0.75 cm3 g−1), phosphoric acid (85 wt% in H2O, ≥99.99%) and hydrogen peroxide (30 wt% in H2O) were purchased from Sigma-Aldrich Co. All chemicals were used without further purification.
000 g mol−1), palladium(II) nitrate dihydrate (Pd(NO3)2·2H2O), ethanol (ACS reagent, ≥ 99.5%, absolute), silica gel (specific surface area = 480 m2 g−1, pore volume = 0.75 cm3 g−1), phosphoric acid (85 wt% in H2O, ≥99.99%) and hydrogen peroxide (30 wt% in H2O) were purchased from Sigma-Aldrich Co. All chemicals were used without further purification.
Catalyst synthesis
The PVP-containing Pd/SiO2 catalyst was prepared in two steps as shown in Scheme 2. Since it is difficult to remove PVP from the synthesized nanoparticles, the catalyst was prepared according to the following steps: (i) preparation of the Pd/SiO2 catalyst by the incipient wetness impregnation method and (ii) adsorption of the PVP by using PVP contained suspension. The details of the catalyst synthesis method are as follows.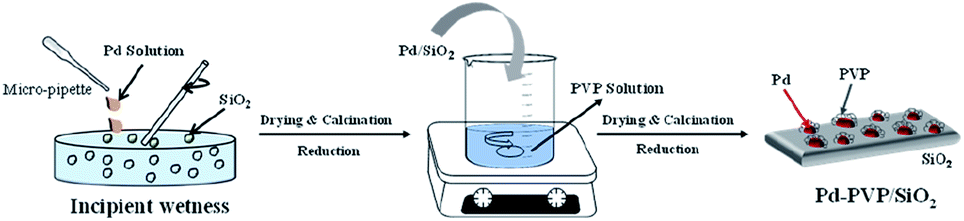 | ||
| Scheme 2 Two steps for preparing the Pd–PVP/SiO2 catalyst. | ||
A volume of Pd(NO3)2-containing solution corresponding to the pore volume of SiO2 was impregnated into the SiO2 by the incipient wetness method. The powder was dried overnight in an oven at 80 °C and then calcined at 500 °C for 3 h. Then, the prepared Pd/SiO2 was reduced at 150 °C in a H2 atmosphere to activate the oxidized Pd. After that, different amounts of PVP were added to 100 mL of deionized (DI) water to prepare aqueous suspensions containing 0.05 mM, 0.1 mM, and 0.2 mM of PVP. Subsequently, 2 g of the prepared Pd/SiO2 was added to the PVP suspensions, and they were mixed at room temperature for 12 h. After mixing, the catalyst was obtained by filtration through filter paper, dried overnight in an oven at 80 °C, and then reduced in a H2 atmosphere at 60 °C for 2 h. The synthesized catalysts were named Pd–PVP(1), Pd–PVP(2), and Pd–PVP(3), according to the concentration of the PVP suspension (0.05, 0.1, and 0.2 M, respectively).
Catalyst characterization
Transmission electron microscopy (TEM) was performed using a Tecnai G2 F30 transmission electron microscope (FEI Company, OR, USA) operating at 300 kV. The analysis was performed at the Korea Basic Science Institute (KBSI), Seoul. Scanning transmission electron microscopy (STEM) images were obtained by operating at 200 kV. Fourier transform infrared (FT-IR) spectroscopy (Perkin Elmer, Spectrum GX) was employed to study the adsorbed PVP in the catalysts. The spectra were recorded from 1300 to 2000 cm−1 using 100 scans and a resolution of 4 cm−1. The exposed specific area of Pd was determined via CO pulse chemisorption by using an ASAP 2020 chemisorption analyser (Micrometrics Inc., Norcross, USA). The Pd content of the catalyst was estimated by inductively coupled plasma optical emission spectrometry (ICP-OES) by using an iCAP-6300 duo ICP-OES spectrometer (Thermo Scientific, Waltham, MA, USA). The analysis was performed at the Korea Basic Science Institute (KBSI), Seoul. X-ray photoelectron spectroscopy (XPS) analyses were used to measure the electronic states of N and Pd in each catalyst. XPS was performed using an ESCA2000 (VG Microtech, U.K.). Thermogravimetric analysis (TGA; TGA-N 1000, Scinco) was used to estimate the amount of PVP adsorbed on the catalysts. Prior to weight change measurement, the sample was heated to 150 °C under a N2 flow of 50 mL min−1 for removing water. Then, the sample was heated to 800 °C at a rate of 2°C min−1 under 50 mL min−1 of air gas and the weight change was recorded.Catalytic activity tests: direct synthesis of H2O2 from H2 and O2
H2O2 was directly synthesized using each catalyst in a double-jacket glass reactor. The reaction medium was composed of ethanol and water (150 mL, 20 vol% ethanol) containing 0.03 M of H3PO4. The reaction was performed at 10 °C and 1 bar with 1200 rpm stirring for 1 h, and the volumetric flow rate of the reactant gas stream (volume ratio of O2/H2 = 10) was 22 mL min−1. The concentration of H2O2 in the solution was measured using iodometric titration after the reaction.27 The H2 concentration was measured via gas chromatography (Younglin, ACME6000 with a Carbosieve SII (60–80 mesh)) with a column and a thermal conductivity detector (TCD). Eqn (1)–(3) were used to calculate the H2 conversion, H2O2 selectivity, and H2O2 production rate, respectively:
 | (1) |
 | (2) |
 | (3) |
The H2O2 hydrogenation and decomposition tests were performed under the same reaction conditions, except that gas mixtures of H2 + N2 (22 mL min−1, H2/N2 = 1/10, for hydrogenation) or pure N2 (22 mL min−1, for decomposition) were used instead of H2 + O2 feed. Then, 1 mL of 30% aqueous H2O2 solution was added. The concentration of remaining hydrogen peroxide was measured by the iodometric titration, and the fraction of converted H2O2 (%) was calculated with eqn (4) as follows.
 | (4) |
Safety
Using explosive gas feed composed of H2 and O2 should be controlled safely. Less than 4 mol% of H2 with O2 balance is an out of explosive range. However, our research was performed under explosive range in order to obtain high H2O2 yield which is can be substantially affected by H2/O2 ratio. Under this explosive area, powder type catalyst should be banned. Instead, slurry phase catalyst including reaction medium with powder catalyst can avoid the explosion. In addition, high temperature catalyst powder can make a fire while it is mixed with the reaction medium, thus the slurry phase must be mixed with completely cooled powder.Results and discussion
Prior to investigate the effect of PVP on Pd catalyst, several catalytic properties need to be controlled. In this perspective, size effect of Pd particles which has been reported in a number of researches should not be a main factor determining the catalytic activity.20,28,29 Thus, we prepared PVP added catalyst by using a pristine Pd/SiO2 synthesized at once as described in the experimental section. Fig. 1a–d confirm that Pd particles, which appear in bright color, were dispersed on the surface of SiO2 with negligible differences. They mainly present 5–7 nm size of Pd and some of agglomerated Pd particles co-existed. In terms of optimum size of Pd, F. Menegazzo and co-workers demonstrated Pd particle between 2–3 nm was able to activate O2 molecules without dissociation, enabling selective H2O2 synthesis.30 Meanwhile, P. Tian and co-workers found that sub-nano dominating (between 1.4–2.6 nm) Pd catalyst increased H2O2 selectivity, and especially, ∼1.4 nm of Pd particles substantially improved the selectivity by suppressing H2O pathway.31 On the other hand, under coordinate sites denominated as corner or edge sites can be changed on the basis of particles size, which is crucial for H2O2 selectivity.20,29 More than 3.5 nm, the larger Pd particle exposed smaller ratio of the under coordinate sites, resulting in high H2O2 selectivity. Based on the literatures, it can be said that the prepared Pd/SiO2 and PVP-added Pd/SiO2 catalysts are appropriate for investigating the effect of PVP addition due to their similar size distributions and size range over 3.5 nm (insets in Fig. 1a–d). In detail, the size distributions of the Pd particles were obtained by counting more than 150 number of particles and their average particles sizes were in the range of 6.07–6.35 nm. | ||
| Fig. 1 STEM images for the catalysts (a–d). STEM image and EDS mapping images of Pd–PVP(3) catalyst. (e) STEM image, (f) EDS mapping image of Si and Pd element, (g) EDS mapping image of Pd element, and (h) EDS mapping image of N element. | ||
In Fig. 2e–h, EDS mapping images for Pd–PVP(3) catalyst are shown to examine whether the PVP molecules adsorbed on the place we expected or not. Since nitrogen is a light element, unfortunately Pd–PVP(3) having enough amount of PVP molecules only exhibited reliable counts in the EDS analysis. As shown, bright color particles are in good agreement with Pd element points with green (Fig. 1e and g). However, it is found that N atoms are detected throughout the SiO2, and more intense along with the surface of SiO2, indicating PVP molecules distributed on the surface of SiO2 without preference toward Pd particles. Thus, it can be supposed that Pd–PVP(3) contains excess amount of PVP.
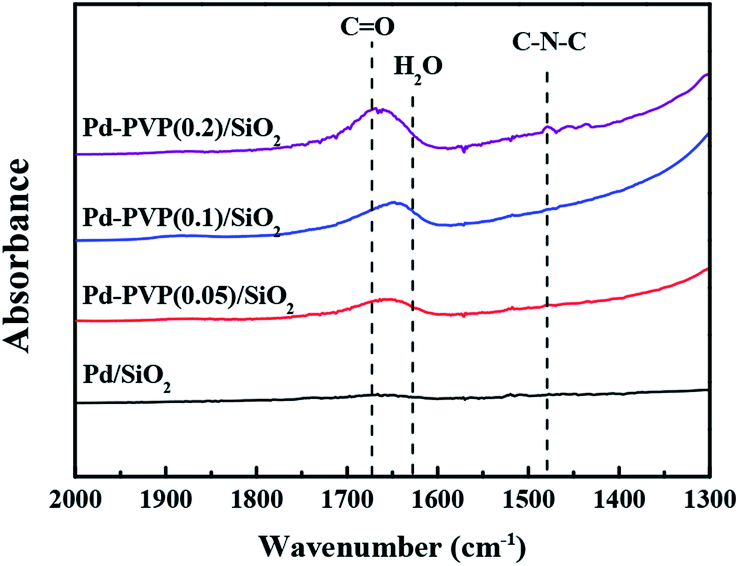 | ||
| Fig. 2 Infrared spectra of the Pd/SiO2, Pd–PVP(1), Pd–PVP(2), and Pd–PVP(3) catalysts. | ||
Since the polymer, PVP, was difficult to be identified in the TEM images, the relative amount of PVP in the catalyst was confirmed by FT-IR analysis (Fig. 2). As shown, the characteristic peaks of the C![[double bond, length as m-dash]](https://www.rsc.org/images/entities/char_e001.gif) O and C–N–C bonds in PVP were observed at 1670 cm−1 and 1480 cm−1, respectively. When the higher concentration of PVP was used in preparation step, the CO and C–N–C peaks were more intense as expected. The gradual increase in the peak intensities indicated that larger amount of PVP was adsorbed on the Pd/SiO2. In addition, Fig. 2 shows a shift of CO bond from Pd–PVP(1) to Pd–PVP(3). It can be elucidated by the interaction between PVP and Pd particles. Through FT-IR spectra, pristine PVP and PVP interacting with metal particles can be determined by peak shift of carbonyl group (CO).32,33 R. J. Kalbasi et al. reported that when carbonyl bond of PVP was coordinated to Pd particles, peak of CO shifted to a lower wave number (1636 cm−1) compared to the pristine PVP (1655 cm−1).32 They suggested that the interaction between Pd and CO bond resulted in weak CO stretches. Similarly, C.-L. Lee et al. compared PVP on Pd nanospheres with PVP molecule by FT-IR spectra.33 They also found a shift of stretching frequency of the carbonyl group toward low wave number when PVP interacted with the Pd particles. Likewise, we also found a shift of carbonyl group over Pd–PVP(1) and Pd–PVP(2) compared to Pd–PVP(3), implying that PVP molecules in Pd–PVP(1) and Pd–PVP(2) properly formed interaction with Pd particles but Pd–PVP(3) included excess amount of PVP as supposed above TEM analysis.
O and C–N–C bonds in PVP were observed at 1670 cm−1 and 1480 cm−1, respectively. When the higher concentration of PVP was used in preparation step, the CO and C–N–C peaks were more intense as expected. The gradual increase in the peak intensities indicated that larger amount of PVP was adsorbed on the Pd/SiO2. In addition, Fig. 2 shows a shift of CO bond from Pd–PVP(1) to Pd–PVP(3). It can be elucidated by the interaction between PVP and Pd particles. Through FT-IR spectra, pristine PVP and PVP interacting with metal particles can be determined by peak shift of carbonyl group (CO).32,33 R. J. Kalbasi et al. reported that when carbonyl bond of PVP was coordinated to Pd particles, peak of CO shifted to a lower wave number (1636 cm−1) compared to the pristine PVP (1655 cm−1).32 They suggested that the interaction between Pd and CO bond resulted in weak CO stretches. Similarly, C.-L. Lee et al. compared PVP on Pd nanospheres with PVP molecule by FT-IR spectra.33 They also found a shift of stretching frequency of the carbonyl group toward low wave number when PVP interacted with the Pd particles. Likewise, we also found a shift of carbonyl group over Pd–PVP(1) and Pd–PVP(2) compared to Pd–PVP(3), implying that PVP molecules in Pd–PVP(1) and Pd–PVP(2) properly formed interaction with Pd particles but Pd–PVP(3) included excess amount of PVP as supposed above TEM analysis.
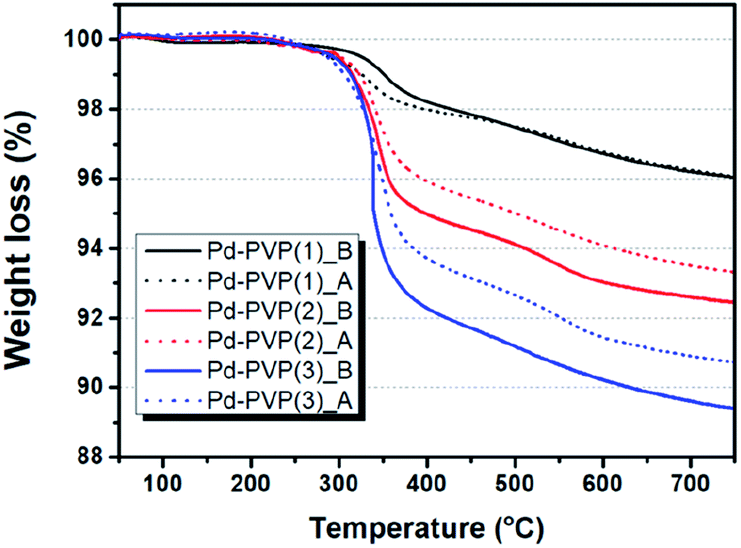
In Table 1 and Fig. 3, the quantity of adsorbed PVP was measured by TGA analysis once more. The weight loss of the catalyst that is assigned to combustion of PVP molecule. In Fig. 3, solid lines indicate that Pd–PVP(1), (2), and (3) catalysts contained about 4, 7.5, and 10.8 wt% of PVP, respectively, before the DSHP reaction. However, unexpected continuous weight loss is observed in the temperature range over 400 °C. Since PVP combustion under air condition occurs mainly around 300–400 °C, it should be explained by other reason. The surface terminal groups of SiO2, siloxane (![[triple bond, length as m-dash]](https://www.rsc.org/images/entities/char_e002.gif) Si–O–Si) and silanol (Si–OH), can be changed by thermal treatment. R. Mueller et al. determined that SiO2 loses its surface hydroxyl group from 120 °C to 800 °C by using both TGA and titration analysis, resulting in continuous weight decrease.34 According to this, we performed TG analysis for fresh Pd/SiO2 without any PVP and presented it in Fig. S1.† First run of TGA for Pd/SiO2 showed 0.8 wt% of continuous weight loss over 100 °C, corresponding to the literature. This weight loss didn't shown in second run of Pd/SiO2, indicating that surface hydroxyl groups were completely eliminated during first run of TGA. Hence, exact weight loss of PVP in those catalysts could be re-calculated by subtracting weight loss of fresh Pd/SiO2 (0.8 wt%), as follows: Pd–PVP(1) = 3.2 wt%, Pd–PVP(2) = 6.7 wt%, and Pd–PVP(3) = 10.0 wt%.
Si–O–Si) and silanol (Si–OH), can be changed by thermal treatment. R. Mueller et al. determined that SiO2 loses its surface hydroxyl group from 120 °C to 800 °C by using both TGA and titration analysis, resulting in continuous weight decrease.34 According to this, we performed TG analysis for fresh Pd/SiO2 without any PVP and presented it in Fig. S1.† First run of TGA for Pd/SiO2 showed 0.8 wt% of continuous weight loss over 100 °C, corresponding to the literature. This weight loss didn't shown in second run of Pd/SiO2, indicating that surface hydroxyl groups were completely eliminated during first run of TGA. Hence, exact weight loss of PVP in those catalysts could be re-calculated by subtracting weight loss of fresh Pd/SiO2 (0.8 wt%), as follows: Pd–PVP(1) = 3.2 wt%, Pd–PVP(2) = 6.7 wt%, and Pd–PVP(3) = 10.0 wt%.
| Catalyst | Exposed Pd areaa (m2 gPd−1) | Peak centerb (eV) | Actual PVP loadingc (wt%) | |
|---|---|---|---|---|
| 3d3/2 | 3d5/2 | |||
| a Exposed Pd areas were calculated by CO pulse chemisorption.b Peak centers of Pd 3d spectra were measured by XPS analysis.c Actual PVP loadings were measured by TGA analysis. n.d. indicates not determined. | ||||
| Pd/SiO2 | 193 | 340.1 | 335.0 | n.d. |
| Pd–PVP(1) | 157 | 340.2 | 335.2 | 4.0 |
| Pd–PVP(2) | 133 | 340.2 | 335.2 | 7.5 |
| Pd–PVP(3) | 74 | 340.3 | 335.3 | 10.5 |
 | ||
| Fig. 3 TGA profiles of Pd–PVP(N) (N = 1, 2, and 3) catalysts before and after DSHP reaction. Denominated by ‘B’ indicates before reaction (solid line) and ‘A’ indicates after reaction (dotted line). | ||
Interestingly, the weight loss of the catalysts are different after the reaction. When PVP molecules were contained more than 7.5 wt% (Pd–PVP(2) and (3)), the molecules were detached and/or decomposed of 1–1.5 wt% during the reaction. However, Pd–PVP(1) showed negligible difference in weight loss. Thus, it is notable to say that Pd–PVP(1) has an optimum amount of PVP for occurring the interaction between Pd and PVP, which cannot be defined in the IR spectra. In addition, the less weight loss of the used Pd–PVP(2) and (3) could be explained by detachment rather than decomposition, because, if it was decomposed, Pd–PVP(1) also showed a distinguishable weight loss after the reaction.
XRD data of the catalysts are shown at Fig. 4. A broad peak at 22° indicates amorphous SiO2.35 Palladium metal diffractogram are (JCPDS no. 46-1043 Pd) at 40°, 46°, and 68° which are assigned to Pd(111), Pd(200), Pd(220), respectively, but owing to low Pd content (∼0.8 wt%), peaks of Pd(200) and Pd(220) are not distinct enough to be analyzed here, therefore only Pd(111) peak is identified and marked. However, it is obvious that metallic diffraction information of Pd is identified over all the catalysts, indicating that Pd catalyst was sufficiently activated to metallic state during reduction.
 | ||
| Fig. 4 XRD diffractogram of Pd/SiO2 and Pd–PVP catalysts. Black circle indicates Pd(111) crystal plane and black diamond indicates amorphous SiO2. | ||
PVP can interact with the metal through either way; withdrawing electrons or providing electrons. In terms of the former, PVP molecules can interact with Pd particle due to their CO and C–N–C bonds since those groups contain high electronegativity elements (i.e., C, N, and O) compared to Pd. They can withdraw electron density from the electron-rich Pd particles to form the interaction. On the other hand, Y. Borodko et al. found that unshared electron pairs in O and N atoms provided themselves to electron deficient Pt, resulting in strong interaction between metal and PVP.36 XPS analysis solved this uncertainty. In Fig. 5, the XPS spectra revealed how PVP and Pd exchanged electrons. The electronic state of Pd in the pristine Pd/SiO2 was observed, and the signals of both Pd 3d5/2 and Pd 3d3/2 were almost equal to what is typical of metallic Pd0 (334.9 eV). However, the peak center in the spectra of the Pd–PVP/SiO2 catalysts shifted to a higher binding energy (335.2–335.3 eV, Table 1). Moreover, the peak attributed to Pd2+ became more intense, meaning that PVP generated electron-deficient Pd species. In terms of the N 1s regions, the Pd-coordinated N 1s peaks shifted to a low binding energy (399.1 eV) compared to those of pristine PVP (399.4 eV). The N 1s peak was located at a lower binding energy when the catalyst contained a lower amount of PVP. This is because the exact amount of electron withdrawn by PVP molecules are similar, causing average electron state of N 1s gradually close to that of pristine PVP. It also is good agreement with the similar electronic state of Pd around at 335.2–335.3 eV of Pd–PVP catalysts even though they contain different amount of PVP. As a result, it is examined that electrons were transferred from the electron-rich Pd (induced by reduction step in preparation) to the nitrogen in PVP instead of forming interactions by the unshared electron pairs of nitrogen or oxygen atoms. In addition, notably, the electron transfer induced by PVP resulted in an electron-deficient Pd species, and especially, Pd–PVP(1) is an optimized catalyst in terms of PVP interacted Pd.
 | ||
| Fig. 5 XPS spectra of the catalysts. (a) Pd 3d region and (b) N 1s region of Pd/SiO2, Pd–PVP(1), Pd–PVP(2), and Pd–PVP(3). | ||
CO pulse chemisorption analysis was performed to measure the exposed Pd area as PVP content increased. As described above, since the amount of PVP in Pd–PVP(1) was enough to form interactions with Pd, decrease of the exposed Pd area (193 → 157 m2 gPd−1) can be derived by an occupation of Pd sites. Moreover, the exposed Pd area gradually decreased as the PVP content increased. It might be induced by PVP layers on the surface of Pd/SiO2 which can crucially cause mass transfer limitation of gas molecules. Thus, for the catalytic activity, these situation is expected to reduce H2 activation in DSHP reaction.
Fig. 6 shows the catalytic activity for DSHP with the prepared catalysts, including their H2 conversions, H2O2 selectivities and H2O2 production rates. As the PVP content increased (Pd/SiO2 → Pd–PVP(3)), the H2 conversion decreased. This reduced H2 conversion can be attributed to lowered amount of exposed Pd sites which mainly accounted for H2 activation (Table 1). Based on the CO chemisorption results, larger PVP content resulted in lower Pd sites by either ways; interaction between Pd and PVP, and PVP polymer layer surrounding the Pd surface. For the latter, Giorgianni et al. investigated the effect of polyvinyl alcohol as a capping agent on the kinetics of direct hydrogen peroxide production.28 The polyvinyl alcohol layers on the surface of the nanoparticle were shown to hinder mass transfer. Thus, in a similar manner, the PVP layers formed on the Pd likely impeded the mass transfer of the reactants. Therefore, removing PVP layers would be expected to enhance the catalytic activity as expected.
 | ||
| Fig. 6 Direct synthesis of hydrogen peroxide using Pd/SiO2, Pd–PVP(1), Pd–PVP(2), and Pd–PVP(3) as catalysts in the presence of ethanol and H3PO4: (a) H2 conversion and H2O2 selectivity; (b) H2O2 productivity (gram-Pd-specific H2O2 production rate). | ||
However, Pd–PVP(1)/SiO2 achieved higher H2O2 production rate (1001 mmolH2O2 gPd−1 h−1) than Pd/SiO2 did (750 mmolH2O2 gPd−1 h−1), which resulted from enhanced H2O2 selectivity of Pd–PVP(1) (Fig. 6b). Above characterizations for PVP added Pd/SiO2 catalyst disclosed that the layers not only interrupted mass transfer but also influenced the oxidation state of Pd (Fig. 5). As described in the XPS analysis, overall, the Pd 3d region became more electron deficient when PVP was added.
The effect of the Pd oxidation state on the DSHP has been studied for explaining H2O2 selectivity. Choudhary et al. argued that unlike Pd0 (Pd metal), PdO (Pd2+) was a suitable catalyst for the selective synthesis of H2O2, because PdO inhibited the decomposition and hydrogenation of H2O2.37–39 N. M. Wilson et al. demonstrated that electron back-donation to adsorbed O–O molecules can facilitate O–O bond dissociation; thus, a lower electron density resulted in higher H2O2 selectivity.5 In terms of Pd–PVP catalyst, it was found by XPS analysis that PVP adsorbed Pd showed electron deficient state compared to pristine Pd/SiO2. Correspondingly, as shown in Fig. 6, a comparison of the H2O2 selectivities of Pd–PVP(1) and Pd/SiO2 suggested that the electron-deficient Pd in Pd–PVP(1) improved its H2O2 selectivity (27% → 42%) by suppressing O–O bond dissociation as well as further H2O2 decomposition. In addition, H2O2 selectivity continuously increased as PVP content increased (44% for Pd–PVP(2) and 52% for Pd–PVP(3)). However, it has to be pointed out here that a product (H2O2) selectivity of successive reaction such as DSHP can critically be affected by conversion of a reactant (H2). For instance, one catalyst generally shows higher H2O2 selectivity at low H2 conversion under different reaction conditions. Thus, to avoid a misunderstanding of H2O2 selectivity trend, H2O2 selectivity should be examined by iso-conversion tests as below.
Fig. 7a shows iso-conversion tests of the catalysts. By adjusting H2 conversion to 7.5%, their H2O2 selectivity trend became more distinguishable and reliable. It was obvious that Pd–PVP(1) achieved the highest H2O2 selectivity of 72%. In addition, Pd–PVP(2) and Pd–PVP(3) having excess PVP showed gradual decrease in H2O2 selectivity. The reason for their low selectivity is proposed as the poor back-diffusion of the produced H2O2.28 It was reported that poor back-diffusion caused by the layer of capping agent (polyvinyl alcohol) led to low H2O2 selectivity since further decomposition/hydrogenation of H2O2 to H2O was unavoidable on the surface of catalyst. Thus, the excess PVP layers offset the positive effect of the PVP on electron-deficient Pd species, resulting in low H2O2 selectivity (72% → 32%).
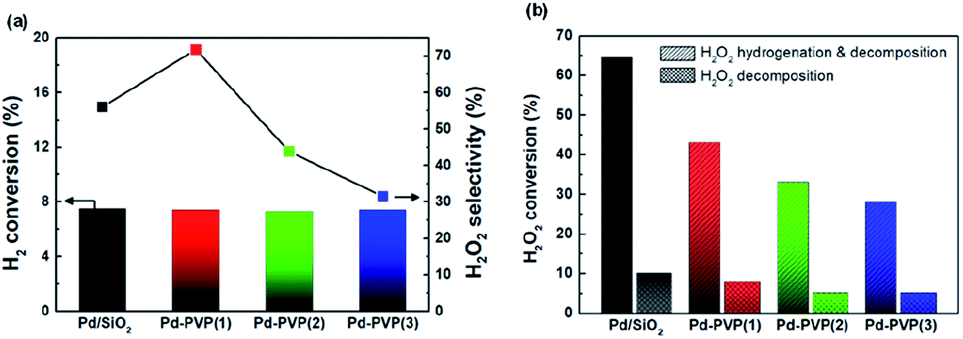 | ||
| Fig. 7 (a) Iso-conversion DSHP results of the catalysts. It was obtained by varying the amount of Pd metal. (b) H2O2 hydrogenation and decomposition results of the catalysts. The H2O2 hydrogenation and decomposition tests were performed under (H2 + N2), and the decompositions tests were performed under pure N2. | ||
Meanwhile, in terms of PVP molecule, its hydrophilicity/hydrophobicity can affect the catalytic performance. In detail, PVP has two main repeating group; pyrrolidone moiety (hydrophilic component) and alkyl group (considerable hydrophobic group).24 Yao X. et al. measured octanol–water affinity coefficients (KAOW) of nanoparticles with PVP to investigate hydrophobicity of the nanoparticles. KAOW values higher than 1 mean a hydrophobic compound, while those less than 1 indicate a hydrophilic one. Over their NPs with PVP, KAOW value of the NPs with PVP were close to 1, implying the amphiphilic property of PVP.40 In addition, to stabilize metallic nanoparticles in aqueous solution, CO bonds in PVP molecules surround the nanoparticles while pyrrolidone and alkyl group are placed outward,41,42 suggesting that the surface of Pd–PVP catalysts could expose either hydrophobic or hydrophilic groups. Thus, this study more focused on the distinct and observable effect of PVP on electronic alteration and mass transfer limitation.
Fig. 7b shows the results of the decomposition and hydrogenation of H2O2. The H2O2 decomposition rate and the hydrogenation rate of the catalysts gradually decreased as the PVP content increased. This phenomenon resulted from both alterations to the electronic state of Pd and mass transfer hindrance by PVP layer. By comparing the H2O2 conversions of Pd/SiO2 and Pd–PVP(1), Pd–PVP(1) showed much higher order of lowered H2O2 conversion (64.5% and 43%, respectively) compared to H2 conversion (15.7% and 13.2%, respectively). Suppression of the H2O2 conversion is well elucidated by the positive effect of electron deficient Pd species and also underpins the high H2O2 selectivity of Pd–PVP(1). Meanwhile, excess PVP suppressed the conversion of H2O2 to a great extent by hindering the mass transfer of the reactant from the bulk solution to the catalyst surface, which was in good agreement with the back-diffusion situation shown in Fig. 7a.
After the DSHP (Fig. 8), no distinguishable difference in the catalysts were observed, indicating that the textural properties of the Pd–PVP/SiO2 catalysts were stable for DSHP reaction. However, the reuse test of the most active Pd–PVP(1) catalyst shows necessity of further study. As observed in Fig. 9, the activity of the catalyst slightly decreased when the catalyst was recycled accompanying slight increase of H2 conversion (13.2 to 13.5%) and decrease of H2O2 selectivity (42% to 40%). From this result, it could be assume that there is an inevitable deactivation of PVP promotes catalyst despite of a loading of the adequate amount of PVP such as Pd–PVP(1). By using FT-IR spectra, a slight change of the peak intensity was observed. In Fig. S2,† those spectra of the pristine Pd–PVP(1) and 3rd used Pd–PVP(1) are shown in the range of PVP molecule bonds. Obvious CO bond and C–N–C bond included in PVP molecule are observed in pristine Pd–PVP(1) catalyst, and the peak intensities of those bonds slightly decrease after the catalyst used. Considering the TGA data, Pd–PVP(1) can retain near most of adsorbed PVP but it can lose the molecules while repeating the DSHP reaction. Therefore, reusability of these catalysts needs to be further improved since PVP can be slightly but continuously detached from the surface of the catalyst during catalytic reactions.
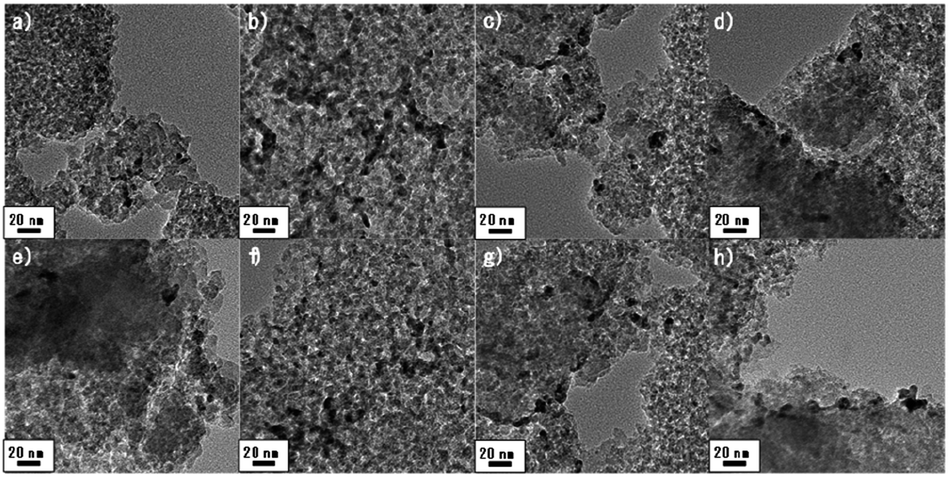 | ||
| Fig. 8 TEM images of the catalysts before the DSHP; (a) Pd/SiO2, (b) Pd–PVP(1), (c) Pd–PVP(2), and (d) Pd–PVP(3). TEM images of the catalysts after the reaction; (e) Pd/SiO2, (f) Pd–PVP(1), (g) Pd–PVP(2), and (h) Pd–PVP(3). | ||
 | ||
| Fig. 9 Catalyst recycling test results (rate of H2O2 production by Pd–PVP(1)). Recycling tests were performed under the same conditions as the H2O2 direct synthesis tests. | ||
To compare catalytic activities of Pd–PVP(1) with those of other developed catalysts, literatures were surveyed and summarized at below Table 2. It contains activity test results performed under similar reaction system (semi-batch and ambient pressure). It is observable that higher H2O2 selectivities were obtained with lower H2 conversions although there are major unseen factors (e.g., reaction temperature, feed ratio, medium, acid concentration, and electronic state of metals) determining the catalytic activity, especially over Pd mono-metal catalysts. Thus, by considering similar H2 conversion, our PVP-modified Pd/SiO2 (6.3 nm Pd) obtained comparable H2O2 selectivity to highly dispersed Pd catalyst such as Pd/N–TiO2(c) (2.2 nm) and Pd/hydroxyapatite (1.6 nm), suggesting that those developed catalysts can be further improved by adopting our findings. In terms of bi-metal catalyst, Pd–Te showed 100% of H2O2 selectivity at low H2 conversion of 6%, and a renowned Au–Pd catalysts showed 40% of H2O2 selectivity under no additive conditions, indicating that a great selectivity could be achieved with bi-metal modification. In a similar manner, those Pd based bimetal catalyst also has potential for being enhanced their activity through the surfactant effect.
| Catalysts | Additives | H2 conv. (%) | H2O2 selec. (%) | Ref. |
|---|---|---|---|---|
| Pd–PVP(1) | H3PO4 | 7.5 | 72 | This study |
| Pd/rutile TiO2 | H3PO4 | 9 | 56 | 43 |
| Pd/N–TiO2(c) | H2SO4 | 6 | 75 | 44 |
| Pd/hydroxyapatite | H2SO4 | 2 | 94 | 31 |
| Pd/mesoporous anatase TiO2 | H2SO4 | 40 | 40 | 45 |
| Pd–tellerium/TiO2 | H2SO4 | 6 | 100 | 46 |
| Au–Pd alloy | H2SO4 | None | 59 | 47 |
| Au–Pd alloy | None | 32 | 40 | 48 |
Overall, the PVP in the synthesis of nanoparticles could play two roles. The highly electronegative nitrogen atoms in PVP can alter the electronic structure of the active sites by withdrawing electron density from the metal atoms. Additionally, when the concentration of PVP is sufficiently high, the PVP forms a surface layer that limits mass transfer of molecules. Thus, for Pd–PVP(1)/SiO2, which has a suitable amount of PVP, the positive effect of PVP was dominant, resulting in the highest H2O2 selectivity and production rate. This study showed that the surfactants used in nanoparticle synthesis could alter the surface electronic states to being favourable for certain reactions. Hence, it is possible to both improve the catalytic activity and stabilize the nanoparticles by controlling the surface surfactant concentration rather than completely removing the surfactant.
Conclusions
We investigated the effects of PVP adsorbed on the catalyst surface in the DSHP by preparing PVP-adsorbed Pd/SiO2 catalysts. The experimental results showed that the electrons of Pd migrated to the PVP, inducing the electron deficient Pd species for high H2O2 selectivity. Excess PVP on the Pd surface was shown to inhibit the mass transfer of the reactants and impede the production of hydrogen peroxide. The former caused low H2 conversion, and the latter caused low H2O2 selectivity due to further decomposition. In conclusion, an adequate amount of PVP on the Pd/SiO2 catalyst improved the H2O2 selectivity compared to slight decrease in H2 conversion, leading to the highest H2O2 production rate of 1001 mmolH2O2 gPd−1 h−1. From this study, it is notably found that moderate content of such surfactants on the particle surface provide a betterment compared to a complete elimination of them. In addition, stable interaction between N containing groups and Pd can be considered as a promising way to develop DSHP-adequate catalysts in terms of electron deficient +Pd species.Conflicts of interest
There are no conflicts to declare.Acknowledgements
This work was supported by the National Research Foundation of Korea (NRF) grant funded by the Korean government (MSIP) (NRF-2016M3D1A1021143).Notes and references
- M. Ksibi, Chem. Eng. J., 2006, 119, 161–165 CrossRef CAS.
- X. S. Chai, Q. X. Hou, Q. Luo and J. Y. Zhu, Anal. Chim. Acta, 2004, 507, 281–284 CrossRef CAS.
- N. Mizuno, Modern Heterogeneous Oxidation Catalysis, Wiley-VCH, 2009 Search PubMed.
- J. M. Campos-Martin, G. Blanco-Brieva and J. L. G. Fierro, Angew. Chem., Int. Ed., 2006, 45, 6962–6984 CrossRef CAS PubMed.
- N. M. Wilson and D. W. Flaherty, J. Am. Chem. Soc., 2016, 138, 574–586 CrossRef CAS PubMed.
- M.-g. Seo, D.-W. Lee, S. S. Han and K.-Y. Lee, ACS Catal., 2017, 7, 3039–3048 CrossRef CAS.
- G.-H. Han, M.-g. Seo, Y.-H. Cho, S. S. Han and K.-Y. Lee, Mol. Catal., 2017, 429, 43–50 CrossRef CAS.
- S. J. Freakley, Q. He, J. H. Harrhy, L. Lu, D. A. Crole, D. J. Morgan, E. N. Ntainjua, J. K. Edwards, A. F. Carley, A. Y. Borisevich, C. J. Kiely and G. J. Hutchings, Science, 2016, 351, 965–968 CrossRef CAS PubMed.
- X. Xiao, T.-U. Kang, H. Nam, S. H. Bhang, S. Y. Lee, J.-P. Ahn and T. Yu, Korean J. Chem. Eng., 2018, 35, 2379–2383 CrossRef CAS.
- Y. Jang, H. Nam, J. Song, S. Lee, J.-P. Ahn and T. Yu, Korean J. Chem. Eng., 2019, 36, 1417–1420 CrossRef CAS.
- M.-g. Seo, H. J. Kim, S. S. Han and K.-Y. Lee, Catal. Surv. Asia, 2017, 21, 1–12 CrossRef CAS.
- P. Tian, L. Ouyang, X. Xu, J. Xu and Y.-F. Han, Chin. J. Catal., 2013, 34, 1002–1012 CrossRef CAS.
- T. Deguchi and M. Iwamoto, J. Phys. Chem. C, 2013, 117, 18540–18548 CrossRef CAS.
- A. Staykov, T. Kamachi, T. Ishihara and K. Yoshizawa, J. Phys. Chem. C, 2008, 112, 19501–19505 CrossRef CAS.
- H. E. Jeong, S. Kim, M.-g. Seo, D.-W. Lee and K.-Y. Lee, J. Mol. Catal. A: Chem., 2016, 420, 88–95 CrossRef CAS.
- S. Quon, D. Y. Jo, G.-H. Han, S. S. Han, M.-g. Seo and K.-Y. Lee, J. Catal., 2018, 368, 237–247 CrossRef CAS.
- I. Kim, M.-g. Seo, C. Choi, J. S. Kim, E. Jung, G.-H. Han, J.-C. Lee, S. S. Han, J.-P. Ahn, Y. Jung, K.-Y. Lee and T. Yu, ACS Appl. Mater. Interfaces, 2018, 10, 38109–38116 CrossRef CAS PubMed.
- A. Villa, S. Freakley, M. Schiavoni, J. K. Edwards, C. Hammond, G. M. Veith, W. Wang, D. Wang, L. Prati and N. Dimitratos, Catal. Sci. Technol., 2016, 6, 694–697 RSC.
- S. Kim, D.-W. Lee and K.-Y. Lee, J. Mol. Catal. A: Chem., 2014, 391, 48–54 CrossRef CAS.
- S. Kim, D.-W. Lee, K.-Y. Lee and E. A. Cho, Catal. Lett., 2014, 144, 905–911 CrossRef CAS.
- H. E. Jeong, S. Kim, M.-g. Seo, D.-W. Lee and K.-Y. Lee, J. Mol. Catal. A: Chem., 2016, 420, 88–95 CrossRef CAS.
- N. M. Wilson, Y.-T. Pan, Y.-T. Shao, J.-M. Zuo, H. Yang and D. W. Flaherty, ACS Catal., 2018, 8, 2880–2889 CrossRef CAS.
- M. Jin, H. Zhang, Z. Xie and Y. Xia, Energy Environ. Sci., 2012, 5, 6352–6357 RSC.
- K. M. Koczkur, S. Mourdikoudis, L. Polavarapu and S. E. Skrabalak, Dalton Trans., 2015, 44, 17883–17905 RSC.
- D. J. Bharali, S. K. Sahoo, S. Mozumdar and A. Maitra, J. Colloid Interface Sci., 2003, 258, 415–423 CrossRef CAS PubMed.
- S.-D. Oh, B.-K. So, S.-H. Choi, A. Gopalan, K.-P. Lee, K. R. Yoon and I. S. Choi, Mater. Lett., 2005, 59, 1121–1124 CrossRef CAS.
- H. Lee, S. Kim, D.-W. Lee and K.-Y. Lee, Catal. Commun., 2011, 12, 968–971 CrossRef CAS.
- G. Giorgianni, S. Abate, G. Centi and S. Perathoner, ChemCatChem, 2019, 11(1), 550–559 CrossRef CAS.
- P. Tian, D. Ding, Y. Sun, F. Xuan, X. Xu, J. Xu and Y.-F. Han, J. Catal., 2019, 369, 95–104 CrossRef CAS.
- F. Menegazzo, M. Signoretto, G. Frison, F. Pinna, G. Strukul, M. Manzoli and F. Boccuzzi, J. Catal., 2012, 290, 143–150 CrossRef CAS.
- P. Tian, L. Ouyang, X. Xu, C. Ao, X. Xu, R. Si, X. Shen, M. Lin, J. Xu and Y.-F. Han, J. Catal., 2017, 349, 30–40 CrossRef CAS.
- R. J. Kalbasi and N. Mosaddegh, Mater. Chem. Phys., 2011, 130, 1287–1293 CrossRef CAS.
- C.-L. Lee, R.-B. Wu and C.-M. Syu, Electrochem. Commun., 2009, 11, 270–273 CrossRef CAS.
- R. Mueller, H. K. Kammler, K. Wegner and S. E. Pratsinis, Langmuir, 2003, 19, 160–165 CrossRef CAS.
- Y. Liang, J. Ouyang, H. Wang, W. Wang, P. Chui and K. Sun, Appl. Surf. Sci., 2012, 258, 3689–3694 CrossRef CAS.
- Y. Borodko, S. M. Humphrey, T. D. Tilley, H. Frei and G. A. Somorjai, J. Phys. Chem. C, 2007, 111, 6288–6295 CrossRef CAS.
- V. R. Choudhary, A. G. Gaikwad and S. D. Sansare, Catal. Lett., 2002, 83, 235–239 CrossRef CAS.
- V. R. Choudhary, S. D. Sansare and A. G. Gaikwad, Catal. Lett., 2002, 84, 81–87 CrossRef CAS.
- A. G. Gaikwad, S. D. Sansare and V. R. Choudhary, J. Mol. Catal. A: Chem., 2002, 181, 143–149 CrossRef CAS.
- Y. Xiao and M. R. Wiesner, J. Hazard. Mater., 2012, 215, 146–151 CrossRef PubMed.
- M. Behera and S. Ram, Appl. Nanosci., 2013, 3, 543–548 CrossRef CAS.
- A.-Q. Zhang, L.-J. Cai, L. Sui, D.-J. Qian and M. Chen, Polym. Rev., 2013, 53, 240–276 CrossRef CAS.
- G.-H. Han, G. P. Lee and K.-Y. Lee, Catal. Today, 2019, 352, 262–269 CrossRef.
- C. Ao, P. Tian, L. Ouyang, G. Da, X. Xu, J. Xu and Y.-F. Han, Catal. Sci. Technol., 2016, 6, 5060–5068 RSC.
- R. Tu, L. Li, S. Zhang, S. Chen, J. Li and X. Lu, Catalysts, 2017, 7, 175 CrossRef.
- P. Tian, X. Xu, C. Ao, D. Ding, W. Li, R. Si, W. Tu, J. Xu and Y.-F. Han, ChemSusChem, 2017, 10(17), 3342–3346 CrossRef CAS PubMed.
- F. Menegazzo, M. Signoretto, M. Manzoli, F. Boccuzzi, G. Cruciani, F. Pinna and G. Strukul, J. Catal., 2009, 268, 122–130 CrossRef CAS.
- N. M. Wilson, P. Priyadarshini, S. Kunz and D. W. Flaherty, J. Catal., 2018, 357, 163–175 CrossRef.
Footnote |
| † Electronic supplementary information (ESI) available. See DOI: 10.1039/d0ra03148h |
| This journal is © The Royal Society of Chemistry 2020 |