DOI:
10.1039/D0RA03094E
(Paper)
RSC Adv., 2020,
10, 21049-21056
Photoluminescence, TGA/DSC and photocatalytic activity studies of Dy3+ doped SrY2O4 nanophosphors
Received
6th April 2020
, Accepted 12th May 2020
First published on 3rd June 2020
Abstract
Dy3+:SrY2O4 nanophosphors were prepared via a solution combustion method using glycine as an organic fuel. The structural, optical, and thermal properties of the nanophosphors were studied. Strain and crystal size were calculated via W–H analysis. The direct energy band gap is nearly 4.9 eV and photocatalytic studies reveal that Rh-B degradation of almost 50% can be achieved.
1. Introduction
In the last few decades, Dy3+-doped nanophosphors have attracted the attention of researchers because of their vast potential for use in a modern technological capacity. Dy3+ is one of the most efficient rare-earth elements for use as an activator. Dy3+ usually has two visible emission bands (blue and yellow). The blue emission is due to the 4F9/2 → 6H15/2 transition and the yellow emission band is due to the 4F9/2 → 6H13/2 transition.1–4 Trivalent rare earth (RE3+) doped inorganic nanophosphors may be broadly applied in display devices, fluorescent tubes, optical sensors, white light emitting diodes (w-LEDs), biological imaging, and scintillators due to their superior thermal and chemical stabilities and unique optical properties.5–15 Among these uses, w-LEDs are regarded as future light devices that may replace present traditional sources of light because of their low energy consumption, better consistency, higher brightness, longer operating times, and eco-friendly properties.14–19 W-light can be obtained via three possible means: firstly, via coalescing three basic coloured LEDs, like red, green and blue, even though this can be rather expensive and complicated, since each coloured LED is destroyed after a dissimilar time interval;20–25 secondly, via stimulating red, green and blue emitting nanophosphors with ultra-violet LED excitation, although the strong reverse absorption of blue light by red and green nanophosphors can considerably decrease the efficacy of the device;14 and finally, via yellow-emitting Ce3+:Y3Al5O12 under GaN-based blue LED excitation, which suffers from chromatic aberration and low w-light emitting performance after some period of functioning because of distinct degradation and the deficiency of the red constituent.13 Hence, further exciting research is required to examine powerful w-light producing nanophosphors in the presence of UV excitation.13–19 Therefore, it is a matter of interest to analyse the structural, morphological, optical, thermal, and, in particular, photoluminescence properties of Dy3+-doped SrY2O4 nanophosphors designed for warm w-LED uses.
In this article, a series of SrY2O4:Dy3+ nanophosphors was synthesized efficaciously with variable dopant molar concentrations (0.01 to 0.11%) via a solution combustion method (SCM). The obtained nanophosphors were calcinated and analysed via powder X-ray diffraction (XRD), high-resolution transmission electron microscopy (HRTEM) and field emission scanning electron microscopy (FESEM) techniques to obtain the crystal sizes, particle sizes and morphologies. Photoluminescence (PL) spectroscopy was used for the analysis of the excitation and emission spectra. FTIR and Raman spectroscopy studies were carried out to study the presence of different types of bonds in SrY2O4:Dy3+. UV-visible diffuse reflectance spectroscopy (UV-vis DRS) was used to determine the direct energy bandgaps. Thermogravimetric (TG/DSC) analysis was used to study the thermal solidities of the synthesized nanophosphors.
2. Experimental
2.1. Materials
Extremely pure strontium nitrate [Sr(NO3)2], yttrium nitrate hexahydrate [Y(NO3)3·6(H2O)], dysprosium nitrate hexahydrate [Dy(NO3)3·6(H2O)], glycine [C2H5NO2], and rhodamine blue [C28H31CIN2O3] were used as materials in this study. All these constituents were purchased from Sigma-Aldrich.
2.2. Synthesis
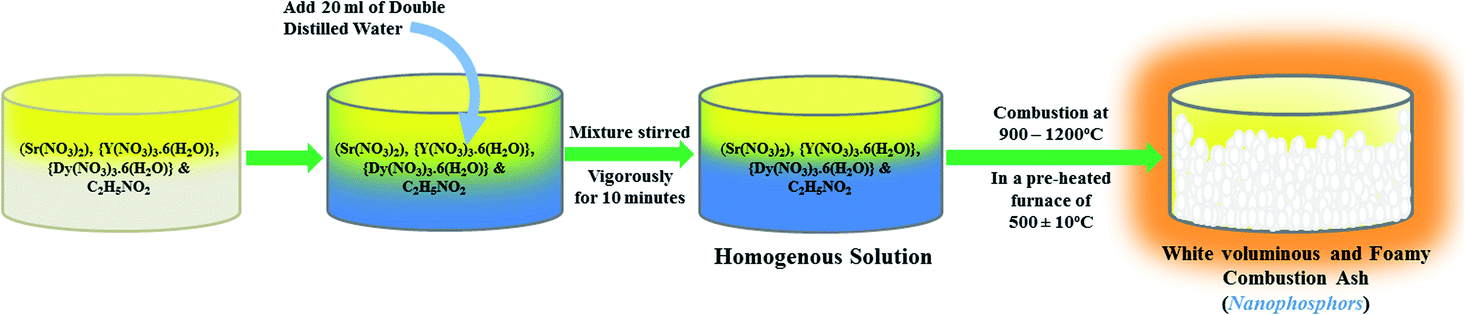
Dy3+-activated SrY2O4 nanophosphors were successfully synthesized through a novel SCM with glycine as the fuel. The above-mentioned constituents were weighed according to the calculated compositions for different Sr(1−x)Y2O4:Dyx3+ (x = 0.01, 0.03, 0.05, 0.07, 0.09, and 0.11 mol%) compounds and then added into a Borosil glass beaker, then 20 ml of double-distilled water was added into the beaker dropwise. Further, to achieve a homogenous solution, the mixture was stirred briskly using a magnetic stirrer for 10 min. Immediately the glass beaker was shifted into a muffle furnace, which was pre-heated to 500 ± 10 °C. After 5 min, oxidation occurs, resulting in the evaporation of N2, CO2 and water vapour. After the mixture was allowed to naturally cool, a large volume of white nanophosphors was obtained.
The flow chart of the SCM is shown in Fig. 1. The equivalent chemical reaction of the process is also given. The obtained nanophosphors were annealed using an alumina crucible at 1300 °C for three hours in a muffle furnace.
 |
| | Fig. 1 A flow chart showing the SCM to produce SrY2O4:Dy3+ nanophosphors. | |
2.3. Characterization
The phase pureness of Dy3+-doped SrY2O4 powder was analysed with a Rigaku Ultima IV powder X-ray diffractometer using Cu-Kα radiation (λ = 1.5406 Å). The superficial morphology and particle size were examined using FESEM (JEOL JSM-7100F) at an accelerating voltage of 30 kV and HRTEM (a JEOL JEM 2100 microscope operating at 200 kV; source: LaB6). Photoluminescence spectroscopy studies were carried out using a Shimadzu RF-5301-PC fluorescence spectrophotometer. Fourier transform infrared (FTIR) spectra were recorded with a NICOLET 6700 spectrometer (USA) using KBr as a reference. UV-vis diffuse reflectance spectroscopy (DRS) data was obtained with the help of a UV 3092 UV-vis spectrophotometer. The DSC/TGA (differential scanning calorimetry/thermal gravimetric analysis) studies were accomplished using a NETZSCH STA 449F3 thermogravimeter instrument. Room temperature Raman spectroscopic studies were done using LabRM HR revolution HORIBA apparatus. The photocatalytic activity in rhodamine B (Rh-B) solution was inspected using a SPECORD-210 Plus (Germany) UV-visible spectrophotometer in the range from 200 to 800 nm.
2.4. Photocatalytic activity
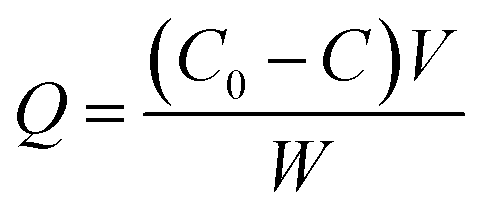
Rh-B was used to estimate the photocatalytic activity of un-doped and Dy3+ (0.03, 0.07, 0.11 mol%) doped SrY2O4 nanophosphors. The photocatalytic investigations were conducted at room temperature using a round glass container with a surface area of 176 cm2 and an average-pressure mercury vapour lamp as the ultra-violet light source with a wavelength of 365 nm at 125 W. The light flux is around 8 mW cm−2 according to a ferrioxalate actinometric approach.26,27 The UV light was made to focus directly onto the reaction mixture. Experiments were conducted using double distilled water. Usually, an experiment comprises 50 mg of photocatalyst distributed in 100 ml of 10 ppm Rh-B solution. The reaction mixture was stirred vigorously for 30 min prior to radiation treatment to guarantee the development of adsorption/desorption equilibrium, and magnetic stirring was continued throughout the entire experiment. The amount of adsorption is given by eqn (1):| |
 | (1) |
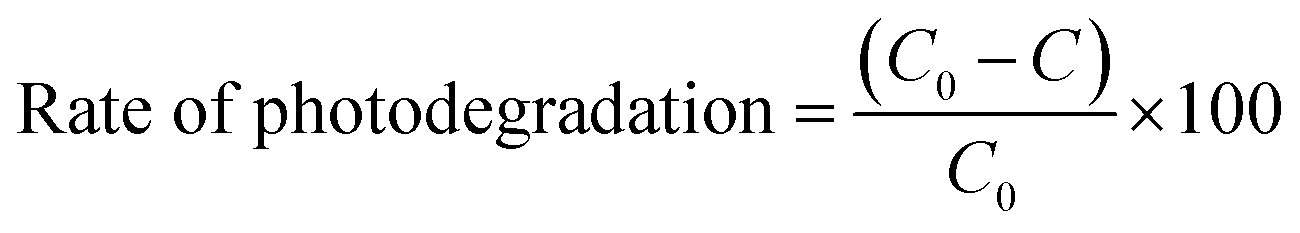
where Q is the degree of adsorption, C0 and C are the initial concentration (at time = 0 min) and concentration after adsorption (at time = t min), V is the volume of the reaction mixture, and W is the quantity of catalyst in grams; the unit of Q is ppm ml mg−1. About 5 ml of solution was taken from the suspension after a certain time intervals (say 15 min), centrifuged, and then subjected to spectrophotometric analysis; the maximum absorption was observed at a wavelength of 555 nm and the residual concentration of Rh-B was estimated. The dye degradation rate was calculated from the following eqn (2):28| |
 | (2) |
3. Results and discussion
3.1. Powder X-ray diffraction analysis
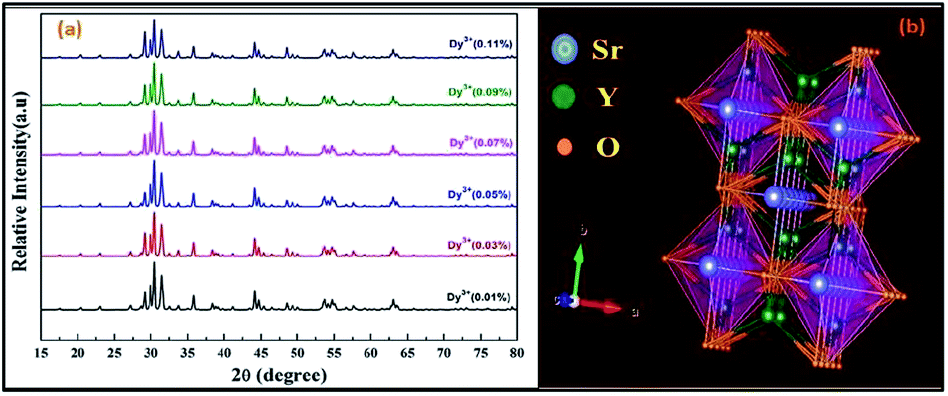
X-ray diffraction (XRD) spectra were recorded in the range of 15° ≤ 2θ ≤ 80° using Cu-Kα radiation (λ = 1.5406 Å). As we know, SrY2O4 fits the orthorhombic CaFe2O4 structure with the Pnam space group; it has a volume of 408.18 Å3, and cell parameters of a = 10.07 Å, b = 11.91 Å, and c = 3.41 Å.23 The XRD patterns of annealed SrY2O4 nanophosphors doped with Dy3+ (0.01, 0.03, 0.05, 0.07, 0.09, and 0.11 at%) at different molar concentrations are shown in Fig. 2(a), and the corresponding peaks can be indexed to the orthorhombic structure and match the typical SrY2O4 standard indicated in JCPDS Card No. 32-1272. Fig. 2(b) shows the crystal structure of the host SrY2O4:Dy3+ nanophosphors created using the VESTA program.29
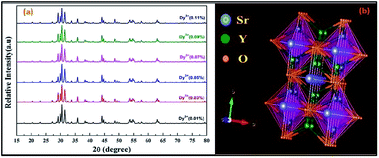 |
| | Fig. 2 (a) X-ray diffraction spectra of SrY2O4 nanophosphors doped with Dy3+ at different molar concentrations and annealed at a temperature of 1300 °C and (b) the crystal structure of the host SrY2O4 nanophosphors. | |
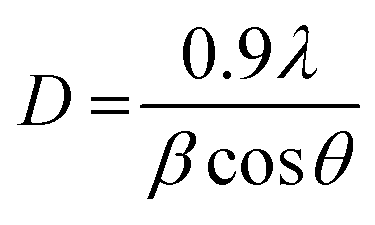
Typically, the average crystallite size of phosphors can be evaluated via the Debye Scherrer formula (3):
| |
 | (3) |
where
D is the typical nanocrystalline size,
λ is the wavelength of the X-rays (1.5406 Å),
β is the full width at half maximum (FWHM) in terms of radians, and
θ is the Bragg diffraction angle of a measured peak in terms of radians. The strongest diffraction heights were considered for computing the crystallite sizes, and the data are tabulated in
Table 1. With an increase in the Dy
3+ concentration, the crystallite size also varies moderately, and it is found that the average crystallite size is about 38 nm.
Table 1 The crystallite sizes of various concentrations of Dy3+-doped SrY2O4 phosphors annealed at a temperature of 1300 °C
| Phosphor |
Debye Scherrer method |
W–H method |
| Crystal size (nm) |
Lattice strain |
Crystal size (nm) |
| Sr0.99Y2O4:Dy0.013+ |
38 |
0.00109 |
67 |
| Sr0.97Y2O4:Dy0.033+ |
40 |
0.00142 |
63 |
| Sr0.95Y2O4:Dy0.053+ |
40 |
0.00158 |
50 |
| Sr0.93Y2O4:Dy0.073+ |
39 |
0.00110 |
58 |
| Sr0.91Y2O4:Dy0.093+ |
38 |
0.00147 |
76 |
| Sr0.89Y2O4:Dy0.113+ |
37 |
0.00129 |
69 |
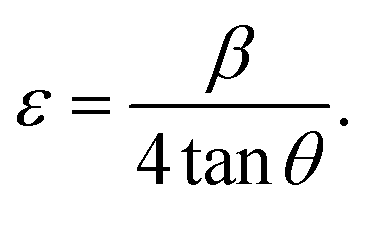
The Williamson–Hall (W–H) fitting method was applied to evaluate the strain (ε) and crystallite size values of the samples.30,31 Induced strain in nanophosphors may be caused by virtue of crystal faults and defects. Induced strain is estimated via eqn (4):
| |
 | (4) |
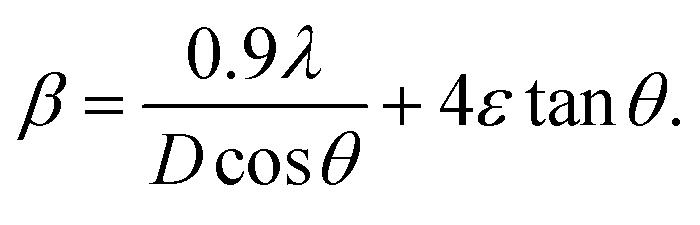
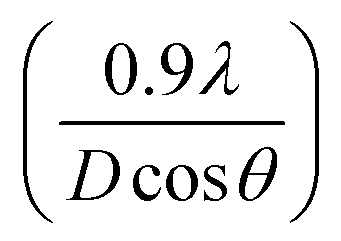
If the crystal size and strain contribution to enlargement are independent of one another and both possess a Cauchy-like profile,31 then the measured line breadth is merely the sum of eqn (3) and (4):
| |
 | (5) |
Further, rearranging eqn (5), one can get:
| |
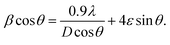 | (6) |
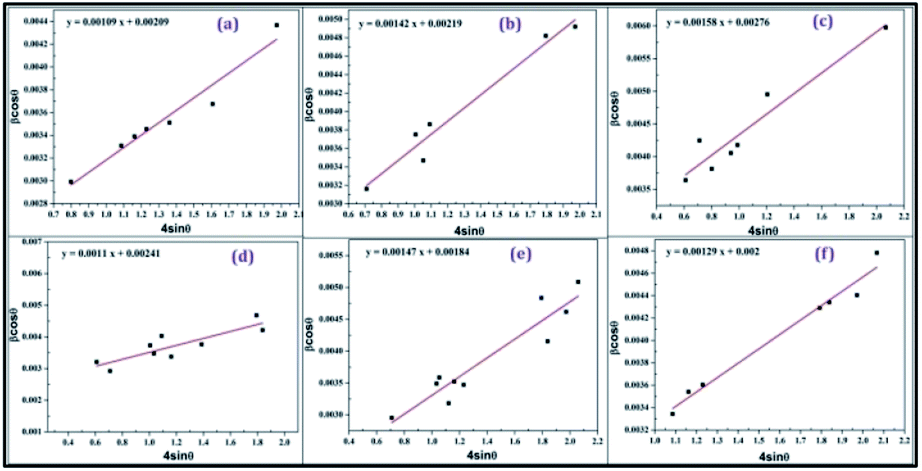
From eqn (6), the slope of the linear fit of a plot of β![[thin space (1/6-em)]](https://www.rsc.org/images/entities/char_2009.gif) cosθ versus 4sinθ is equal to the strain ε and linear fits of the graphs of 0.01 to 0.11 at% Dy3+-doped SrY2O4 are shown in Fig. 3. The induced strain values are in the range of 0.00109 to 0.00158, and the positive slopes specify the existence of tensile strain in the arrangement. Similar behaviour has been indicated for Eu3+-doped SrWO4 nanophosphors32 and a Gd3+-co-doped CaMoO4:Eu3+ system.33 Further, the W–H fitting method was used to compute the crystal size by using the intercept
cosθ versus 4sinθ is equal to the strain ε and linear fits of the graphs of 0.01 to 0.11 at% Dy3+-doped SrY2O4 are shown in Fig. 3. The induced strain values are in the range of 0.00109 to 0.00158, and the positive slopes specify the existence of tensile strain in the arrangement. Similar behaviour has been indicated for Eu3+-doped SrWO4 nanophosphors32 and a Gd3+-co-doped CaMoO4:Eu3+ system.33 Further, the W–H fitting method was used to compute the crystal size by using the intercept  of the line with the y-axis; crystallite size (D) values were calculated and they average 64 nm, as tabulated in Table 1.
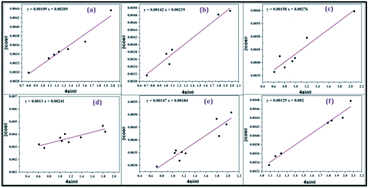 |
| | Fig. 3 W–H plots of βcosθ against 4sinθ for SrY2O4 doped with Dy3+ at different molar concentrations and annealed at 1300 °C: (a) 0.01%, (b) 0.03%, (c) 0.05%, (d) 0.07%, (e) 0.09% and (f) 0.11%. | |
3.2. FESEM and HRTEM analysis
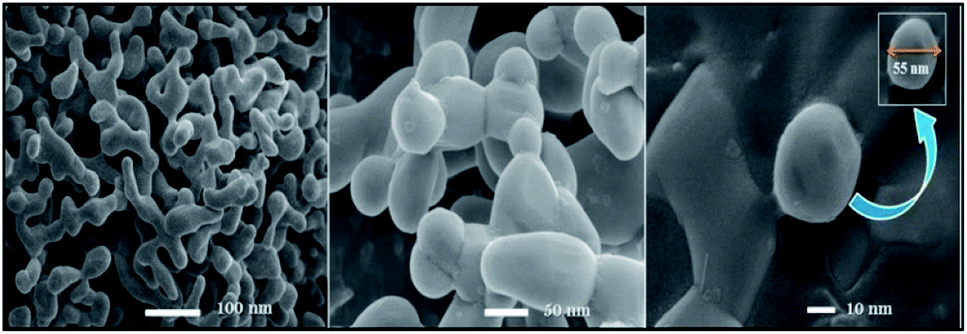
With the help of HRTEM, the morphologies of the formed nanophosphors were analysed, showing that the particles remain nearly spherical with their usual size.34–36 The average particle size is about 49 nm, as shown in Fig. 4. FESEM morphological images of SrY2O4:Dy3+ nanophosphors at different magnifications are shown in Fig. 5. From the FE-SEM image, it is clear that the SrY2O4:Dy3+ nanophosphors are spherical in nature with quite identical sizes and closely crowded with each other.34–37 Also from Fig. 5 it is found that the average phosphor particle size is around 55 nm; these very crowded phosphor particles avoid the scattering of light, creating strong light production and acting as a suitable material for potential applications in the area of lighting.
 |
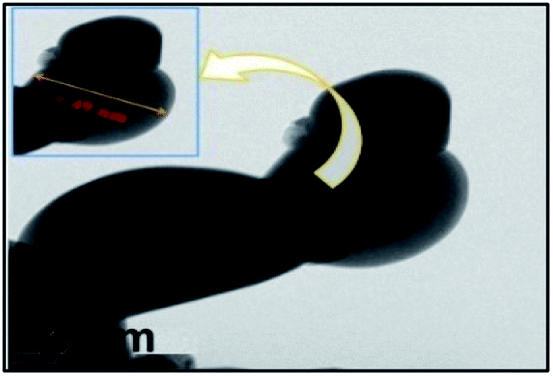
| | Fig. 4 A HR-TEM image of 0.11 at% Dy3+-doped SrY2O4 annealed at 1300 °C (the inset indicates an extended view of a single particle having an average diameter of 49 nm). | |
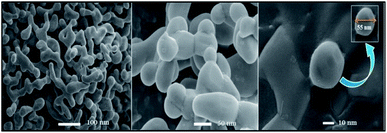 |
| | Fig. 5 FE-SEM micrographs of SrY2O4:Dy3+ (0.11 at%) nanophosphors at various resolutions. | |
3.3. Photoluminescence study
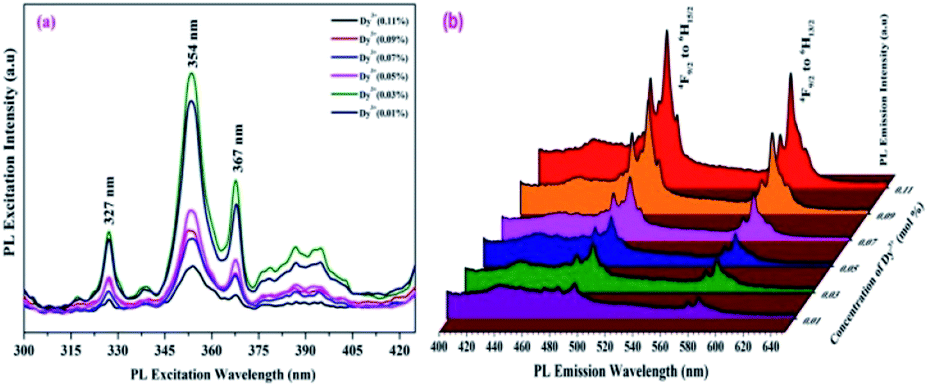
Room temperature photoluminescence excitation and emission spectra were recorded. Fig. 6(a) shows the excitation spectra of the SrY2O4:Dy3+ nanophosphors, and it is observed that prominent excitation peaks appear at wavelengths of 327 nm, 354 nm and 367 nm. Of the three peaks, the peak at 354 nm has the highest intensity and so we excited the SrY2O4:Dy3+ sample at this wavelength.
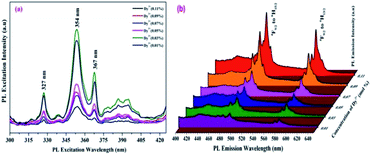 |
| | Fig. 6 Photoluminescence (a) excitation and (b) emission spectra of Dy3+ (0.01 to 0.11 mol%)-doped SrY2O4 nanophosphors. | |
At an excitation wavelength of 354 nm, the Dy3+-doped SrY2O4 nanophosphors show broad blue and yellow colour emission at wavelengths of 491 nm (4F9/2 → 6H15/2) and 581 nm (4F9/2 → 6H13/2) with the highest intensity,1–4 as shown in Fig. 6(b). The yellow 4F9/2 → 6H13/2 emission is associated with a forced electric dipole type transition, possible only at low symmetry via a non-inversion centre, and the peak intensity is strongly dependent on the crystal-field environment. The blue emission is related to the 4F9/2 → 6H15/2 magnetic dipole transition.26 Also, it is observed that with a rise in the Dy3+ concentration, there is an increase in the intensity of the emission spectrum. In addition to these peaks, there is the presence of small peaks; the source of these peaks may be magnetic dipoles or electric dipoles, after emitting to the completion levels, which is dependent on the sites of Dy3+ in the lattice of SrY2O4, and the type of transfer is determined by selection rules.34–37 The observed photoluminescence mechanism is described schematically through the energy level diagram in Fig. 7. From the PL emission spectra, it is noticed that the dopant Dy3+ emits blue and yellow colour light successfully, which is helpful for many types of lighting equipment.
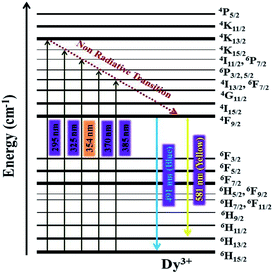 |
| | Fig. 7 The energy level diagram of Dy3+-doped SrY2O4 nanophosphors at λExcitation = 354 nm. | |
Fig. 8 shows the Commission Internationale de l'Eclairage (CIE) chromaticity graph of SrY2O4:Dy3+ (0.01, 0.03, 0.05, 0.07, 0.09, and 0.11 at%) nanophosphors. The calculated CIE ‘x’ and ‘y’ colour co-ordinates of all samples are presented in Table 2. At an excitation wavelength of 354 nm, blue and yellow light emission is perceived.1–4 It is found that, as the concentration of Dy3+ increases, the CIE coordinates initially are positioned in the blue region, further moving to the area that is very close to standard w-light illumination. These observed x and y coordinate values affirm that the colour is tuneable from blue-yellow to white in the visible spectrum region suitable for w-LED applications.34–37
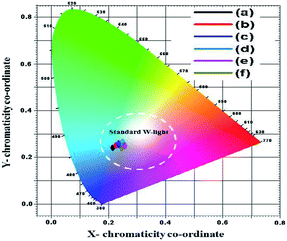 |
| | Fig. 8 The Commission Internationale de l'Eclairage (CIE) chromaticity coordinates of SrY2O4:Dy3+ nanophosphors with varied Dy3+ ion molar concentrations: (a) 0.01, (b) 0.03, (c) 0.05, (d) 0.07, (e) 0.09, and (f) 0.11 at%. | |
Table 2 The CIE x and y co-ordinates of Sr(1−x)Y2O4:Dyx3+ with variable molar concentrations
| Nanophosphor |
CIE co-ordinates |
| x |
y |
| Sr0.99Y2O4:Dy0.013+ |
0.2607 |
0.2720 |
| Sr0.97Y2O4:Dy0.033+ |
0.2616 |
0.2761 |
| Sr0.95Y2O4:Dy0.053+ |
0.2534 |
0.2580 |
| Sr0.93Y2O4:Dy0.073+ |
0.2562 |
0.2611 |
| Sr0.91Y2O4:Dy0.093+ |
0.2404 |
0.2415 |
| Sr0.89Y2O4:Dy0.113+ |
0.2395 |
0.2409 |
3.4. FTIR studies
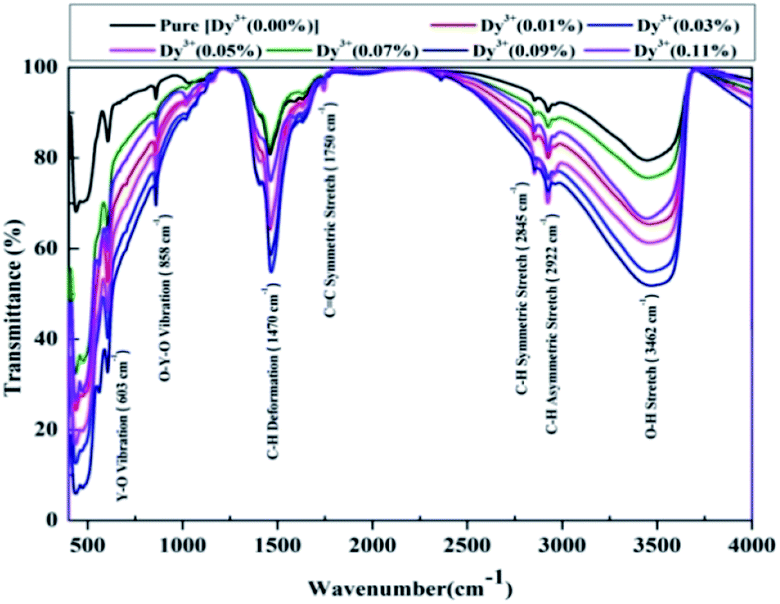
FTIR spectra of the Dy3+-doped SrY2O4 nanophosphors over wavenumbers ranging from 400 to 4000 cm−1 are shown in Fig. 9. In the FTIR spectra, the broad intense absorption peak at 3462 cm−1 implies O–H stretching vibrations, which is due to the existence of water molecules present superficially on the nanophosphors; two close weak peaks are detected at 2922 cm−1 and 2845 cm−1, which correspond to C–H symmetric and asymmetric stretching; and the weak extensive absorption peak observed at 1750 cm−1 can be allocated to C![[double bond, length as m-dash]](https://www.rsc.org/images/entities/char_e001.gif) C symmetric stretching vibrations. The sharp strong peak at 1470 cm−1 be allocated to the bending vibrations of C–H deformation. The medium sharp peak at 858 cm−1 corresponds to O–Y–O deformation, owing to the enlargement of the lattice of SrY2O4 after calcination at 1300 °C. The presence of the O–Y–O vibration peak is seen at 603 cm−1, and Y–O vibration is observed at 490 cm−1.36,37 From Fig. 9, it is clear that the peaks do not shift with a rise in the Dy3+ concentration, but the percentage absorption rises as the concentration is increased, clearly indicating the stability of the structure. Thus, the CaFe2O4 structure of the Dy3+-doped SrY2O4 nanophosphors is verified via FTIR analysis.
C symmetric stretching vibrations. The sharp strong peak at 1470 cm−1 be allocated to the bending vibrations of C–H deformation. The medium sharp peak at 858 cm−1 corresponds to O–Y–O deformation, owing to the enlargement of the lattice of SrY2O4 after calcination at 1300 °C. The presence of the O–Y–O vibration peak is seen at 603 cm−1, and Y–O vibration is observed at 490 cm−1.36,37 From Fig. 9, it is clear that the peaks do not shift with a rise in the Dy3+ concentration, but the percentage absorption rises as the concentration is increased, clearly indicating the stability of the structure. Thus, the CaFe2O4 structure of the Dy3+-doped SrY2O4 nanophosphors is verified via FTIR analysis.
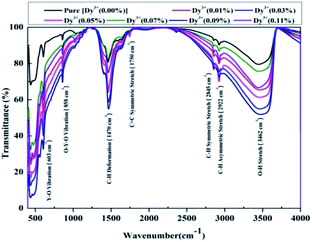 |
| | Fig. 9 FT-IR spectra of SrY2O4 nanophosphors doped with Dy3+ at different concentrations and annealed at 1300 °C. | |
3.5. Raman studies
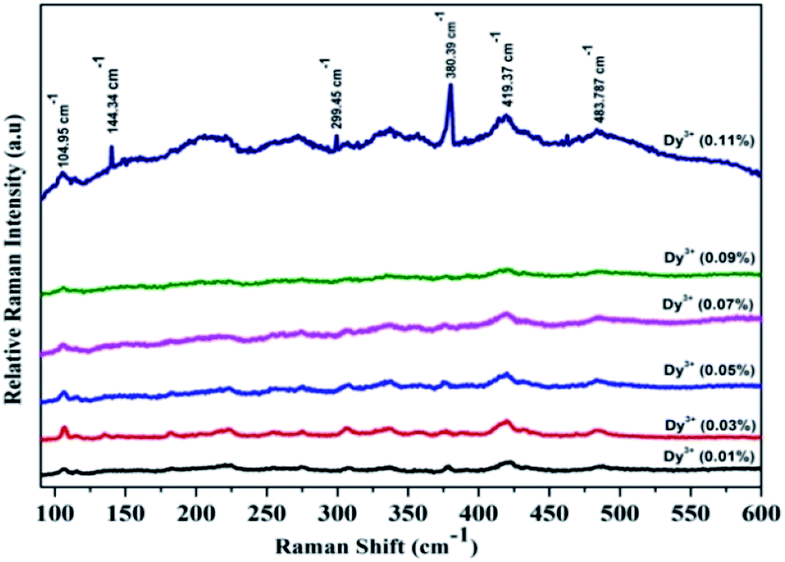
Fig. 10 shows Raman spectra of SrY2O4:Dy3+ at a wavelength of 532 nm in the frequency range of 100 to 600 cm−1. It is observed that for 0.01%, 0.03%, 0.05%, 0.07%, and 0.09% Dy3+, no prominent peaks are found, but for 0.11% Dy3+, noticeable Raman bands are perceived at 104, 144, 299, 380 and 419 cm−1, which are related to the SrY2O4 orthorhombic structure. In Fig. 10, the peak situated at 483 cm−1 can be ascribed to the symmetric stretching of Y–O, whereas the peak at 219 cm−1 is allocated to the symmetric bending of O–Y–O. The peaks at 419 and 380 cm−1 are ascribed to O–Y–O antisymmetric stretching, and the peaks at 144 and 109 cm−1 are ascribed to Y–O anti-symmetric bending.38
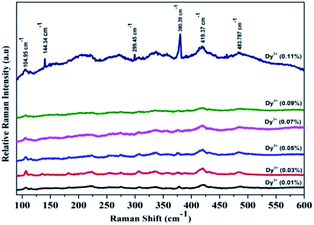 |
| | Fig. 10 Room temperature Raman spectra of SrY2O4:Dy3+ nanophosphors with varied Dy3+ concentrations at an excitation wavelength of 532 nm after being treated at 1300 °C for 3 h. | |
3.6. DSC/TGA analysis
Fig. 11 illustrates the synchronized DSC/TGA curves along with the DTA curves of SrY2O4 doped with Dy3+ at a concentration of 0.11%. Under a nitrogen atmosphere, samples were measured in the temperature range of 28 to 1400 °C at a heating rate of 10 °C min−1.
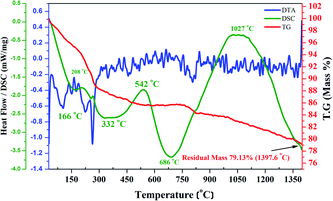 |
| | Fig. 11 Simultaneous DSC/TG analysis of SrY2O4 doped with Dy3+ at a concentration of 0.11% concentration along DTA. | |
The TG study (Fig. 11) shows weight loss of 11.6% between 28 °C and 300 °C, 2.6% in the range of 300–750 °C, 1.8% in the range of 750–825 °C, and insignificant loss beyond 825 °C for 0.11 at% Dy3+-doped SrY2O4. The mass loss up to 300 °C is assigned to dehydration of the sample, while mass loss up to 600 °C is because of the evaporation of organic materials like glycine and some impurities.38 In the DTA curve, there are four exothermic peaks in the locality of 100 °C, 260 °C, 450 °C and 800 °C, which relate to water molecule evaporation, organic molecule decay, and the phase creation of (0.11%)Dy3+:SrY2O4.
To analyse the heat flow against temperature under a nitrogen gas atmosphere related to the transitions in SrY2O4:(0.11%)Dy3+, DSC was performed, and both exothermic and endothermic peaks were found. The peak at around 166 °C signifies mass loss owing to the vaporization of water and glycine. The exothermic peaks at around 332 and 686 °C imply the evaporation of organic compounds. The big and sharp endothermic DSC peaks at about 542 and 1027 °C suggest the phase establishment of SrY2O4:(0.11%)Dy3+. These outcomes indicate that the SrY2O4:(0.11%)Dy3+ nanophosphors are stable with respect to rising temperature, and they may be useful in the areas of lighting and display-related devices.38
3.7. UV-visible diffuse reflectance study
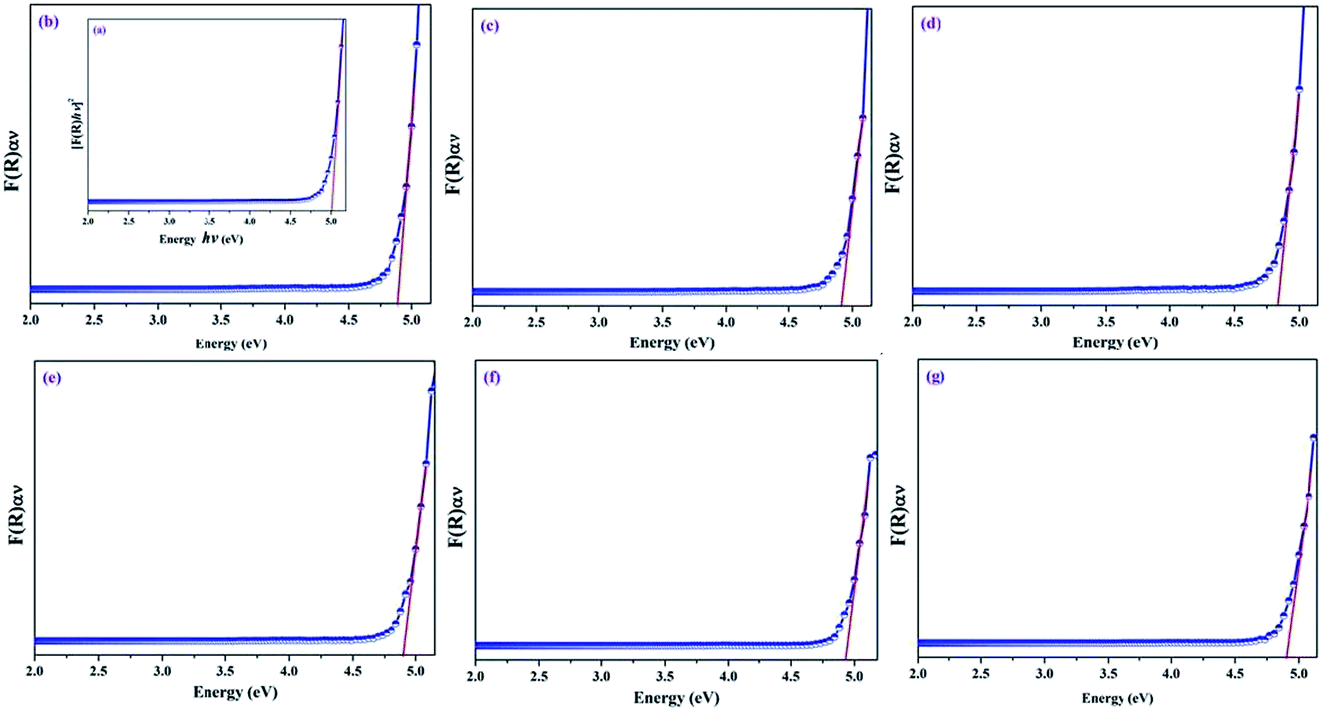
From the UV-vis diffuse reflectance spectroscopic data, the direct energy bandgaps of the un-doped and Dy3+-doped SrY2O4 nanophosphors were evaluated by plotting graphs of [F(R)hν]2 against the energy of the incident photons (hν).39,40 The Kubelka–Munk (K–M) approximation is one suitable method used for the estimation of the direct energy bandgap of pure SrY2O4 and Dy3+-doped nanophosphors and the respective K–M plots are shown in Fig. 12.
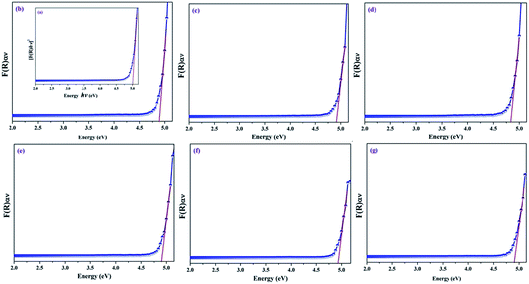 |
| | Fig. 12 Kubelka–Munk approximation plots for the direct band transition of SrY2O4:Dy3+ nanophosphors with varying Dy3+ molar concentrations: (a) un-doped (inset), (b) 0.01, (c) 0.03, (d) 0.05, (e) 0.07, (f) 0.09, and (g) 0.11 at%. | |
According to the K–M approximation function, the correlation between the optical absorption coefficient [F(R)hν]2 and the energy bandgap (hν) is given in eqn (7):
| | |
[F(R)hν]2 = A(hν − Eg)
| (7) |
where
F(
R),
h,
ν,
Eg, and
A are the K–M function, Planck's constant, the frequency, the energy band gap and a proportionality constant, respectively.
41,42
The energy bandgap is projected by extrapolating the rectilinear region of the plot of [F(R)hν]2 versus hν to the photon energy axis, as shown in Fig. 12. The corresponding energy bandgap values are estimated for pure SrY2O4 and SrY2O4:(0.01–0.11%)Dy3+ nanophosphors, as listed in Table 3.
Table 3 The energy band gaps for various concentrations of Dy3+-doped SrY2O4 nanophosphors annealed at a temperature of 1300 °C
| Nanophosphor |
Direct energy band gap (eV) |
| Sr0.00Y2O4:Dy0.003+ |
5.04 |
| Sr0.99Y2O4:Dy0.013+ |
4.89 |
| Sr0.97Y2O4:Dy0.033+ |
4.91 |
| Sr0.95Y2O4:Dy0.053+ |
4.83 |
| Sr0.93Y2O4:Dy0.073+ |
4.90 |
| Sr0.91Y2O4:Dy0.093+ |
4.93 |
| Sr0.89Y2O4:Dy0.113+ |
4.89 |
A study of Table 3 specifies that un-doped SrY2O4 has a direct energy band gap of 5.04 eV, but the occurrence of dopant ions reduces the energy bandgap; this is due to the substitution of Sr2+ by Dy3+ in the crystalline arrangement, which is able to generate additional energy levels. The creation of a charge transfer band in between the valence band (VB) and conduction band (CB) of un-doped SrY2O4 is accountable for the reduction in the energy bandgaps of the doped samples. In addition, the reduction of the energy bandgap is attributed to an increase in the superficial defect concentrations of the doped samples.43
3.8. Photocatalytic activity
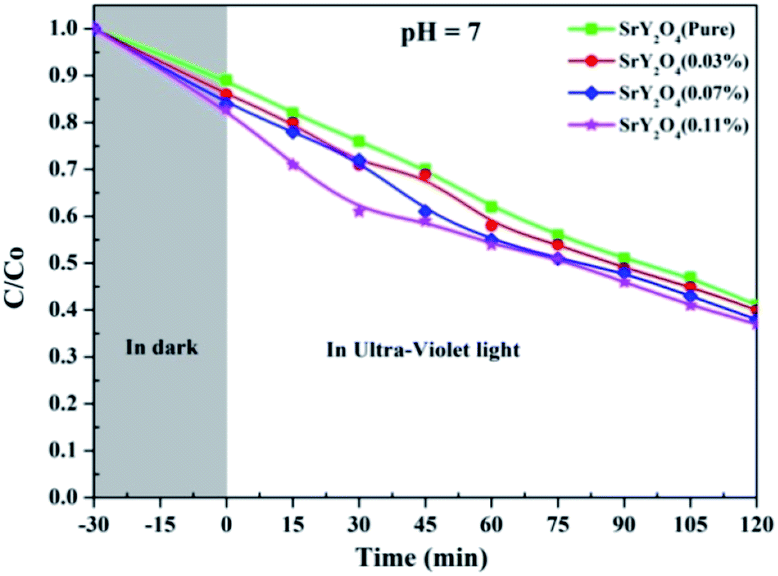
The photocatalytic performances of un-doped and Dy3+ (0.03, 0.07 and 0.11 at%)-doped SrY2O4 nanophosphors were analysed via the decolourization of Rh-B in aqueous solution. Graphs of C/C0 versus the UV light irradiation time for the decolourization of Rh-B at pH 7 were obtained, with the reaction was performed in the dark for 30 min followed by UV irradiation for 120 min (Fig. 13). The self-catalysis of Rh-B was ruled out, since only a small quantity of Rh-B decolorized in the absence of the photocatalyst; this verifies that the decolourization is due to photocatalysis. The Rh-B photo-decolourization efficiency gradually declines as the Dy3+ dopant concentration rises.
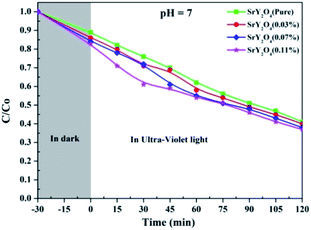 |
| | Fig. 13 The relative concentration variations against irradiation time for SrY2O4 nanophosphors doped with different molar concentrations of Dy3+. | |
Photo-degradation arises as a result of Dy3+ stimulating charge separation, charge-carrier recombination and the amount of interfacial charge transfer; it can act as a mediator and affect quantum productivity.44,45 Dy3+-doped SrY2O4 nanophosphors are treated with UV light; electrons present in the VB are transmitted to the CB, leading to the creation of some holes in the VB and commencing a sequence of reactions to create hydroperoxyl and hydroxyl radicals.
These hydroxyl radicals are strong oxidants that destroy dangerous impurities.46 In the said method, the undesirable recombination of electrons and holes can arise too quickly, reducing the photocatalytic activity. Dy3+ might take electrons from the CB of SrY2O4 to form Dy2+, which results in the relocation of an electron to dissolved O2 to create a superoxide radical,47 which prevents the recombination of light-generated electrons and holes. Therefore, Dy3+ on the surfaces of SrY2O4 nanophosphors could act as an electron hunter.
The use of photocatalysts and also the control of photocatalytic properties is of serious interest during the extended usage of photocatalysts, since the photocatalytic activity usually declines as an outcome of photo-corrosion due to frequent use.48
4. Conclusions
Dy3+-doped SrY2O4 nanophosphors were synthesized through an easy and low-cost SCM. Powder XRD data highlight the monophasic orthorhombic CaFe2O4 structure with a Pnam space group. FESEM micrographs show the spherical nature, with quite identical size and a closely crowded morphology. The Debye–Scherrer and W–H methods are used to calculate the particle sizes. The strain induced is in the range of 0.00109 to 0.00158. PL emission spectra reveal broad intense blue and yellow emission peaks at an excitation wavelength of 354 nm. In addition, the samples showed admirable CIE chromaticity co-ordinates (x, y), an outcome showing relative suitability for display and W-LED uses. The thermal stability was verified via DSC/TGA analysis for display applications. UV-vis DRS studies show that the energy band gap decreases upon Dy3+ doping. Photocatalytic activity studies highlight almost 50% Rh-B dye degradation under UV light treatment. Altogether, these results indicate that SrY2O4 is a likely contender for the improvement of blue and yellow nanophosphors in w-LEDs, and it could provide a suitable approach for developing efficient photocatalysts to destroy contaminants, particularly using UV-light.
Conflicts of interest
There are no conflicts to declare.
Acknowledgements
The authors acknowledge Dr Vikas Dubeye, Dept. of Physics, Bhilai Institute of Technology, Raipur, Chhattisgarh, India for providing the instrumental apparatus of a Shimadzu RF-5301-PC fluorescence spectrophotometer to measure the photoluminescence excitation and emission spectroscopy data.
References
- P. Haritha, I. R. Martín, C. S. Dwaraka Viswanath, N. Vijaya, K. Venkata Krishnaiah, C. K. Jayasankar, D. Haranath, V. Lavín and V. Venkatramu, Opt. Mat., 2017, 70, 16 CrossRef CAS.
- P. Babu, K. H. Jang, E. S. Kim, L. Shi and H. J. Seo, J. Korean Phys. Soc., 2009, 54, 1488 CrossRef CAS.
- S. K. Gupta, M. Mohapatra, V. Natarajan and S. V. Godbole, Int. J. Appl. Ceram. Technol., 2012, 10, 593 CrossRef.
- S. K. Gupta, M. Kumar, V. Natarajan and S. V. Godbole, Opt. Mater., 2013, 35, 2320 CrossRef CAS.
- Y. Huang, H. You, G. Jia, Y. Song, Y. Zheng, M. Yang, K. Liu and N. Guo, J. Phys. Chem. C, 2010, 114, 18051 CrossRef CAS.
- H. Qiu, G. Chen, L. Sun, S. Hao, G. Han and C. Yang, J. Mater. Chem., 2011, 21, 17202 RSC.
- C. Zhang, P. Ma, C. Li, G. Li, S. Huang, D. Yang, M. Shang, X. Kang and J. Lin, J. Mater. Chem., 2011, 21, 717 RSC.
- Y. Lei, M. Pang, W. Fan, J. Feng, S. Song, S. Dang and H. Zhang, Dalton Trans., 2011, 40, 142 RSC.
- X. Zhai, S. Liu, X. Liu, F. Wang, D. Zhang, G. Qin and W. Qin, J. Mater. Chem. C, 2013, 1, 1525 RSC.
- H. Liu, W. Lu, H. Wang, L. Rao, Z. Yi, S. Zeng and J. Hao, Nanoscale, 2013, 5, 6023 RSC.
- F. Wang and X. Liu, Chem. Soc. Rev., 2009, 38, 976 RSC.
- K. Nini, N. P. Singh, L. P. Singh and S. S. Krishna, Nanoscale Res. Lett., 2015, 10, 347 CrossRef PubMed.
- H. Guan, Y. Song, P. Ma, M. Chang, J. Chen, Y. Wang, B. Yuan and H. Zou, RSC Adv., 2016, 6, 53444 RSC.
- P. Haritha, I. R. Martín, K. Linganna, V. Monteseguro, P. Babu, S. F. Le_on-Luis, C. K. Jayasankar, U. R. Rodríguez-Mendoza, V. Lavín and V. Venkatramu, J. Appl. Physiol., 2014, 116, 174308 CrossRef.
- M. Shang, C. Li and J. Lin, Chem. Soc. Rev., 2014, 43, 1372 RSC.
- B. Liu, L. Kong and C. Shi, J. Lumin., 2007, 122–123, 121 CrossRef CAS.
- X. Huang, S. Han, W. Huang and X. Liu, Chem. Soc. Rev., 2013, 42, 173 RSC.
- X. Liu, R. Deng, Y. Zhang, Y. Wang, H. Chang, L. Huang and X. Liu, Chem. Soc. Rev., 2015, 44, 1479 RSC.
- F. Wang and X. Liu, Chem. Soc. Rev., 2009, 38, 976 RSC.
- F. Auzel, Chem. Rev., 2004, 104, 139 CrossRef CAS PubMed.
- Q. Zhang, C. F. Wang, L. T. Ling and S. Chen, J. Mater. Chem. C, 2014, 22, 4358 RSC.
- R. Rajeswari, C. K. Jayasankar, D. Ramachari and S. Surendra Babu, Ceram. Int., 2013, 39, 7523 CrossRef CAS.
- Y. Shimizu, K. Sakano, Y. Noguchi and T. Moriguchi, US Pat., 59998925, 1999.
- Y. Hu, W. Zhuang, H. Ye, D. Wang, S. Zhang and X. Huang, J. Alloys Compd., 2005, 390, 226 CrossRef CAS.
- X. He, M. Guan, N. Lian, J. Sun and T. Shang, J. Alloys Compd., 2010, 492, 452 CrossRef CAS.
- C. A. Parker, A New Sensitive Chemical Actinometer. I., Proc. R. Soc. London, Ser. A, 1953, 220, 104 Search PubMed.
- C. G. Hatchard and C. A. Parker, Proc. R. Soc. London, Ser. A, 1956, 235, 518 CAS.
- S. A. Khayyat, M. S. Akhtar and A. Umar, Mater. Lett., 2012, 81, 239 CrossRef CAS.
- K. Momma and F. Izumi, J. Appl. Crystallogr., 2008, 41, 653 CrossRef CAS.
- L. Robindro Singh, R. S. Ningthoujam, V. Sudarsan, I. Srivastava, S. Dorendrajit Singh, G. K. Dey and S. K. Kulshreshtha, Nanotechnology, 2008, 19, 055201 CrossRef CAS PubMed.
- V. D. Mote, Y. Purushotham and B. N. Dole, Journal of Theoretical and Applied Physics, 2012, 6, 6 CrossRef.
- Maheshwary, B. P. Singh, J. Singh and R. A. Singh, RSC Adv., 2014, 4, 32605 CAS.
- B. P. Singh, A. K. Parchur, R. S. Ningthoujam, A. A. Ansari, P. Singh and S. B. Rai, Dalton Trans., 2014, 43, 4770 RSC.
- E. Pavitra, G. Seeta Rama Raju, J.-h. Oh and J. Su Yu, New J. Chem., 2014, 38, 3413 RSC.
- V. Dubey, J. Kaur, S. Agrawal, N. S. Suryanarayana and K. V. R. Murthy, Optik, 2013, 124, 5585 CrossRef CAS.
- V. Dubey, J. Kaur and S. Agrawal, Mater. Sci. Semicond. Process., 2015, 31, 27 CrossRef CAS.
- E. Pavitra, G. Seeta Rama Raju, Y. H. Ko and J. Su Yu, Phys. Chem. Chem. Phys., 2012, 14, 11296 RSC.
- Maheshwary, B. P. Singh and R. A. Singh, New J. Chem., 2015, 39, 4494 RSC.
- B. Murphy, Sol. Energy Mater. Sol. Cells, 2007, 91, 1326 CrossRef.
- S. P. Ghorpade, R. Hari Krishna, R. M. Melavanki, V. Dubey and N. R. Patil, Optik, 2020, 208, 164533 CrossRef CAS.
- Z. Jiao, T. Chen, J. Xiong, T. Wang, G. Lu, J. Ye and Y. Bi, Sci. Rep., 2013, 3, 1 Search PubMed.
- T. Selvalakshmi, S. Sellaiyan, A. Uedonob and A. Chandra Bose, RSC Adv., 2014, 4, 34257 RSC.
- A. G. Bispo Jr, D. A. Ceccato, S. A. M. Lima and A. M. Pires, RSC Adv., 2017, 7, 53752 RSC.
- Y. Zong, Z. Li, X. Wang, J. Ma and Y. Men, Ceram. Int., 2014, 40, 10375 CrossRef CAS.
- S. Liu and Y. Chen, Catal. Commun., 2009, 10, 894 CrossRef CAS.
- Z. Zhang, W. Wang, E. Gao, M. Shang and J. Xu, J. Hazard. Mater., 2011, 196, 255 CrossRef CAS PubMed.
- A. S. Weber, A. M. Grady and R. T. Koodali, Catal. Sci. Technol., 2012, 2, 683 RSC.
- P. Wang, J. Wang, X. Wang, H. Yu, J. Yu, M. Lei and Y. Wang, Appl. Catal. B Environ., 2013, 132–133, 452 CrossRef CAS.
|
| This journal is © The Royal Society of Chemistry 2020 |
Click here to see how this site uses Cookies. View our privacy policy here. 
 Open Access Article
 This Open Access Article is licensed under a Creative Commons Attribution-Non Commercial 3.0 Unported Licence
 ade,
Nagaraju Kottamb,
Raveendra Melavankice and
N. R. Patil
ade,
Nagaraju Kottamb,
Raveendra Melavankice and
N. R. Patil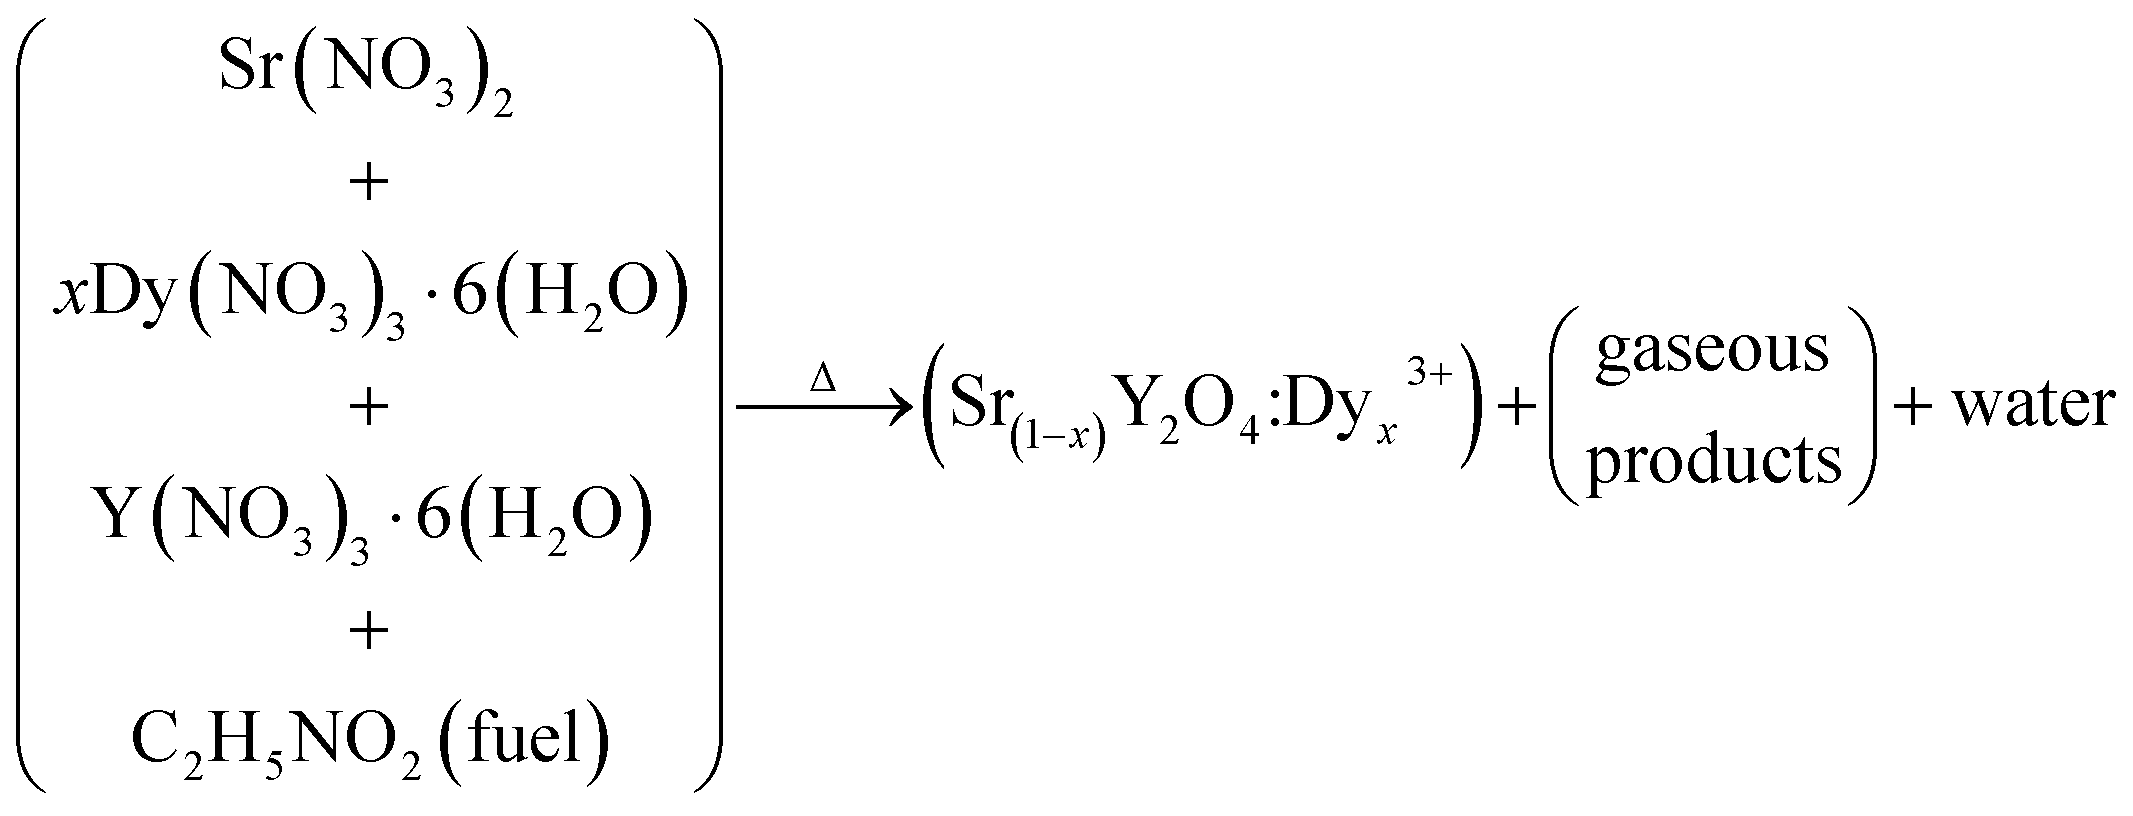

 of the line with the y-axis; crystallite size (D) values were calculated and they average 64 nm, as tabulated in Table 1.