DOI:
10.1039/D0RA02668A
(Paper)
RSC Adv., 2020,
10, 20358-20367
A highly hydrophilic benzenesulfonic-grafted graphene oxide-based hybrid membrane for ethanol dehydration†
Received
23rd March 2020
, Accepted 29th April 2020
First published on 27th May 2020
Abstract
A new type of hybrid membrane was prepared by blending sodium alginate (SA) with benzenesulfonic-grafted graphene oxide (BS@GO), which showed higher hydrophilicity and more defects or edges than GO to create channels for the transfer of water molecules. BS@GO was synthesized by reacting aryl diazonium salts with graphene oxide (GO). The BS@GO sheets were aligned parallelly to the membrane surface and affected the interactions between the SA chains. BS@GO could improve the hydrophilicity and pervaporation properties of SA-based hybrid membranes. Also, compared to GO fillers, BS@GO fillers could supply higher water permeance to improve the pervaporation flux and separation factor. For the pervaporation of 90 wt% aqueous ethanol at 343 K, the optimum hybrid membrane with 1.5 wt% BS@GO in the SA matrix showed the maximum permeate flux of 703 ± 89 g m−2 h−1 (1.4 times higher than that of an SA membrane), and the highest separation factor was 5480 ± 94 (5.6 times higher than that of the SA membrane). Moreover, the hybrid membrane exhibited good stability and separation ability during long-term testing.
1. Introduction
Pervaporation is a progressive and high-efficiency separation technology for the dehydration of organic aqueous solutions to replace some traditional separation methods (such as distillation, azeotropic distillation, and adsorption) due to its simple operation, low energy consumption, high sustainability and high selectivity.1–3 Effective separation membranes should possess good selectivity, permeability and stability.4–6 Currently, pervaporation membranes mainly include organic membranes, inorganic membranes and organic–inorganic hybrid membranes. The organic membranes usually consist of polymer materials with excellent treating ability; however, they suffer from easy swelling and mediocre selectivity. Inorganic membranes (zeolite, silica, ceramic, etc.) have good chemical stability and excellent separation performance; however, they are brittle and expensive and show poor workability. Reddy et al. revealed different nano-fillers used in the functionalization of various polymer matrices with enhanced properties.7–14 Inorganic fillers such as carbon nanotubes (CNTs),15,16 graphene oxide (GO),17 cerium oxide (CeO2),18 zirconium oxide (ZrO2),19 titanium dioxide (TiO2),20 graphitic carbon nitride (g-C3N4)21,22 and metal–organic frameworks (MOFs)23 have been introduced into polymer matrices to form hybrid membranes in order to overcome the intrinsic limitations of organic or inorganic polymers as membrane materials.
Graphene oxide (GO) has atomic thickness, high specific surface area and extraordinary physical properties. The unique structure of GO, which is composed of hydrophilic regions (including hydroxyl, carboxyl and epoxy groups) and hydrophobic regions (aromatic rings), can realize the rapid transmission of water molecules; therefore, it has attracted wide attention.24–26 Self-assembly is an effective and popular method to prepare GO-based membranes. The membranes composed of GO sheets showed high flux for ethanol dehydration by pervaporation.27 Membranes were fabricated through the layer-by-layer self-assembly of gelatin and GO and utilized for ethanol dehydration by pervaporation.28 The double-crosslinking strategy was used to adjust the interlayer spacing of GO-based pervaporation membranes to improve their performance in isopropanol dehydration.29
However, self-assembled GO membranes reveal poor stability in high-concentration aqueous solutions. Organic–inorganic hybrid membranes show excellent stability and pervaporation properties for dehydration. Cha-Umpong et al. fabricated GO-based composite membranes to desalinate concentrated inland brine by pervaporation and investigated the transport of water molecules and hydrated cations through them.30,31 Cao et al. prepared reduced GO (rGO) to blend with a sodium alginate (SA) matrix. The rGO-based SA hybrid membrane showed increased separation factors and unusual changes in its permeation fluxes.32 Both cation-functionalized GO (lignin-decorated GO) and zwitterionic GO (PSBMA@GO)-based SA matrix hybrid membranes expressed much more promising pervaporation performance compared with bare SA polymer membrane.20,33 Carboxyl graphene (CG) obtained by the carboxylation reaction of GO was incorporated in the PVA matrix via high-power ultrasonic treatment and showed high separation performance for ethanol/water and methanol/MTBE mixtures.34
Benzenesulfonic group-modified GO with large electronegativity showed stronger hydrophilic and ethanol repellence than pristine GO (provided only by –COOH, –OH and epoxy groups).33,35 The benzenesulfonic groups on the modified GO surface could bind abundant water molecules to form a hydration layer, which preferentially accelerated the transport of water molecules and repelled ethanol molecules in the feed solution.33 At the same time, the interlayer spacing of the inner GO sheets increased along with the connection of –SO3H groups and large-volume benzene rings. The stability and dispersibility were enhanced for the same reasons.36 Furthermore, the establishment of covalent bonds between the benzenesulfonic groups and grafted GO could produce more defects and edges on the GO sheets, which endowed the channels with high selectivity and fast transport for water molecules.21 Therefore, the hybrid membranes prepared by blending benzenesulfonic-grafted GO with hydrophilic polymers show potential to improve the performance of pervaporation separation.
In this paper, benzenesulfonic-grafted GO (BS@GO) was prepared by modifying GO with 4-aminobenzenesulfonic acid. The physicochemical structure and hydrophilicity of BS@GO sheets and SA–BS@GO hybrid membranes were characterized. The performance of the hybrid membranes in pervaporation dehydration was evaluated with ethanol aqueous solutions. The influences of the BS@GO content, operating temperature and feed solution concentration on the separation performance were studied. The mechanism of SA–BS@GO hybrid membranes for improving pervaporation performance was discussed as well.
2. Experimental
2.1 Materials
Graphene oxide (GO, membrane diameter 0.5–5 m) was purchased from XFNANO Ltd (Nanjing, China). Sodium alginate (SA, CP), 4-aminobenzenesulfonic acid (AR), hydrochloric acid (GR), and absolute ethanol (AR) were purchased from Shanghai Aladdin Biochemical Technology Co., Ltd (Shanghai, China). Anhydrous calcium chloride (AR), sodium nitrite (AR) and sodium hydroxide (AR) were supplied by Sinopharm Chemical Reagent Co., Ltd (Shanghai, China). Nylon micro-filtration membranes (pore size 0.2 μm) were purchased from Tianjin Jinteng Experiment Equipment Co., Ltd (Tianjin, China).
2.2 Synthesis of BS@GO
BS@GO was synthesized by reaction of a synthetic aryl diazonium salt with graphene oxide, as shown in Fig. S1.†37 First, 4-aminobenzenesulfonic acid (1 g), HCl solution (12 mL, volume of ice water![[thin space (1/6-em)]](https://www.rsc.org/images/entities/char_2009.gif) :concentrated HCl = 5:1) and NaNO2 (0.4 g) were sequentially added to NaOH (20 mL, 2.0 wt%) solution with stirring. The reaction was maintained at 273 K for 15 min to form an aryl diazonium salt. The product was then added to a GO suspension (200 mL, 1 mg mL−1) and stirred for 4 h in an ice bath, then washed with water and centrifuged until the pH of the solution was near neutral. The freeze-drying process afforded BS@GO.
:concentrated HCl = 5:1) and NaNO2 (0.4 g) were sequentially added to NaOH (20 mL, 2.0 wt%) solution with stirring. The reaction was maintained at 273 K for 15 min to form an aryl diazonium salt. The product was then added to a GO suspension (200 mL, 1 mg mL−1) and stirred for 4 h in an ice bath, then washed with water and centrifuged until the pH of the solution was near neutral. The freeze-drying process afforded BS@GO.
2.3 Fabrication of hybrid membranes
A nylon filter with an average pore diameter of 0.2 μm was used as a substrate of the composite membrane. A BS@GO aqueous dispersion was prepared and dispersed by sonication for 1 h. Then, magnetic stirring was carried out at 303 K for 4 h to obtain a uniform SA–BS@GO casting solution. The concentration of SA in the obtained casting solution was 1.5 wt% and the concentration of BS@GO in SA was 0 wt%, 1.0 wt%, 1.5 wt%, 2.0 wt%, or 3.5 wt%. The casting solutions were placed at room temperature for 1 h to remove bubbles from the solution. The cast membrane droplets were coated on a porous nylon membrane substrate and dried at room temperature. The dried membranes were immersed in CaCl2 solution (0.5 M) for 10 min, rinsed several times with deionized water, and then dried at room temperature again. The resulting membranes were named SA–BS@GO-X (X represents the mass ratio of BS@GO to SA). The corresponding homogeneous membranes for the characterization tests were prepared on glass plates instead of nylon filters by a similar preparation procedure.
2.4 Measurement of separation performance
The permeation separation performance of the composite membranes was evaluated by a pervaporation separation technique using water/ethanol mixtures. The pervaporation experiments were carried out on a self-made device in the laboratory. Under the action of the vacuum pump, the absolute pressure on the downstream side of the membrane was controlled under 0.4 kPa. The effective area of the membrane was 9.62 cm2, and the flow rate of the feed liquid was controlled at 25 L h−1. The membrane reached a steady state, and the permeate was collected in a cold trap immersed in liquid nitrogen. The permeate was weighed and the composition was measured by gas chromatography. The main pervaporation data of permeation flux (J, g m−2 h−1) and the separation factor (α) were calculated separately as follows:38| |
 | (1) |
| |
 | (2) |
In eqn (1) and (2), Q (g) is the mass of the permeate (g), t is the time interval (h), and P and F are the mass ratios of water (subscript W) and ethanol (subscript E) of the feed and permeate, respectively.
2.5 Calculation of activation energies by the Arrhenius equation
The relationship between the operating temperature and permeate flux was determined by the Arrhenius equation.39| | |
Ji = J0e−Ea/RT
| (3) |
In eqn (3), Ji (g m−2 h−1) is the rate constant, J0 (g m−2 h−1) is the pre-factor (also called the frequency factor), Ea (kJ mol−1) is the apparent activation energy, R (kJ mol−1 K−1) is the molar gas constant and T (K) is the thermodynamic temperature. Take R = 8.314 × 10⁻³ kJ mol−1 K−1, and take the logarithm of the equation as in eqn (4):| |
 | (4) |
Therefore, by plotting the line graph of lnJi vs. 1000/T, the value of Ea can be obtained.
2.6 Driving force normalized form of permeation flux and selectivity calculation
In order to prove the intrinsic properties of the hybrid membrane, the permeability was further calculated by the equation (P/l)i (gas permeation unit (GPU), 1 GPU = 7.501 × 10⁻¹² m3 (STP) m−2 s−1 Pa−1) and the selectivity (β) as follows:40,41| |
 | (5) |
| |
 | (6) |
In eqn (5) and (6), Ji (g m−2 h−1) is the flux of substance I and γio, χio and Psatio are the activity coefficients, mole fraction and saturated vapor pressure of component i in the feed, respectively. Pio and Pil (Pa) are the partial pressure of the feed side and the permeate side of component i, respectively; they can be considered to be zero under high vacuum conditions. γio and Psatio were calculated by Aspen simulation and the Antoine equation, respectively.
2.7 Characterization
The roughness data of the membrane surfaces were obtained by atomic force microscopy (AFM, Dimension, Germany) in the X–Y direction; the typical scanning range was 90 μm × 90 μm, and the height distribution range of the GO or BS@GO sheets was 10 μm × 10 μm. X-ray photoelectron spectroscopy (XPS, ESCALAB 250Xi, Japan) was used to analyse the elements contained in the samples. The zeta potentials of the samples were measured by a Zetasizer Nano (Nano-ZS90, England). The morphologies of the membranes were observed by a field emission scanning electron microscope (FESEM, SU8020, Japan). X-ray diffraction (XRD, X'Pert PRO MPD, Netherlands) with a scan range between 5° and 60° and a scan speed of 5° min−1 at room temperature was used to study the chemical compositions of GO and BS@GO to determine the crystal structure of the successfully grafted and mixed membrane of 4-aminobenzenesulfonic acid. Raman spectroscopy (Raman, LabRAM HR Evolution) was carried out with an incident laser with a 514 nm wavelength. The chemical structures of GO, BS@GO and the membranes were analysed by Fourier transform infrared spectroscopy (FT-IR, Nicolet 67, America) with a scan range of 4000–500 cm−1. Thermal performance was obtained in a temperature range of 298–873 K (heating rate 10 K min−1) using thermogravimetric analysis (TGA, STA 449F5, Germany) and differential scanning calorimetry (DSC, DSC 214, Germany) with a temperature range of 303–473 K. The hydrophilicity of the membranes was measured by a static contact angle meter with about 5 μL pure water drop (CA, Jinzhitang, China). The pervaporation unit tested the separation properties and the effects of the operating conditions.
3. Results and discussion
3.1 Characterization of BS@GO
The FT-IR spectra of GO and BS@GO are shown in Fig. 1a. The stretching vibration peaks of the C–H bonds in the benzene ring, hydroxyl group (–OH), carboxyl group (–COOH), and carboxylate salt (–COO−) are located at 2919 cm−1, 2853 cm−1, 3364 cm−1, 1727 cm−1 and 1616 cm−1, respectively.42,43 For BS@GO, two new peaks appeared at 1219 cm−1 and 1064 cm−1, which are related to the stretching vibrations of S![[double bond, length as m-dash]](https://www.rsc.org/images/entities/char_e001.gif) O and S–O bonds, respectively; this indicates the successful introduction of benzenesulfonic groups. The addition of benzenesulfonic groups increased the disorder of carbon in the graphite plane (Fig. 1b), and BS@GO exhibited a higher ID/IG value (1.03) than GO (0.94); this indicates that more sp3 hybridized carbon and more structural defects appeared on BS@GO than on GO.44,45 The elemental composition was further investigated by X-ray photoelectron spectroscopy (XPS), as shown in Fig. 1c and S2.† S element was introduced into the GO by benzenesulfonic group functionalization. In Fig. 1c, the peaks of S 2s and S 2p appear in the spectrum of BS@GO. For the S 2p spectral fitting peaks, denoted in Fig. S2,† a main peak at around 168 eV corresponds to sulfonate functional groups, indicating that S was in the form of sulfonic acid.46 These results indicate that BS@GO contained benzenesulfonic groups. This result could be confirmed by the XRD spectra (Fig. 1d). Because of the relatively large molecular size of the benzenesulfonic groups between the sheets, the interlayer spacing of BS@GO calculated using the Debye–Scherrer equation was 0.931 nm, which was larger than that of GO (0.835 nm).
O and S–O bonds, respectively; this indicates the successful introduction of benzenesulfonic groups. The addition of benzenesulfonic groups increased the disorder of carbon in the graphite plane (Fig. 1b), and BS@GO exhibited a higher ID/IG value (1.03) than GO (0.94); this indicates that more sp3 hybridized carbon and more structural defects appeared on BS@GO than on GO.44,45 The elemental composition was further investigated by X-ray photoelectron spectroscopy (XPS), as shown in Fig. 1c and S2.† S element was introduced into the GO by benzenesulfonic group functionalization. In Fig. 1c, the peaks of S 2s and S 2p appear in the spectrum of BS@GO. For the S 2p spectral fitting peaks, denoted in Fig. S2,† a main peak at around 168 eV corresponds to sulfonate functional groups, indicating that S was in the form of sulfonic acid.46 These results indicate that BS@GO contained benzenesulfonic groups. This result could be confirmed by the XRD spectra (Fig. 1d). Because of the relatively large molecular size of the benzenesulfonic groups between the sheets, the interlayer spacing of BS@GO calculated using the Debye–Scherrer equation was 0.931 nm, which was larger than that of GO (0.835 nm).
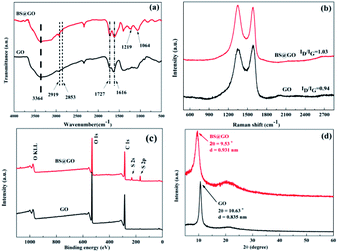 |
| | Fig. 1 (a) FT-IR spectra of GO and BS@GO; (b) Raman spectra of GO and BS@GO; (c) XPS surveys of GO and BS@GO; and (d) XRD patterns of GO and BS@GO. | |
BS@GO showed a higher zeta potential absolute value than GO, as shown in Fig. S3; † thus, BS@GO can be stable in aqueous solution. Therefore, BS@GO showed excellent water dispersion compared to GO, as shown in Fig. S4.† Just as GO had been successfully modified by benzenesulfonic groups, BS@GO showed poorer affinity to ethanol.32,47 The BS@GO precipitated easily while GO tended to remain suspended in ethanol, as shown in Fig. S4.†
3.2 Physiochemical properties of the SA–BS@GO-X membranes
The morphologies of the hybrid membranes SA–BS@GO-1.5 and SA–BS@GO-3.5 were compared with that of SA membrane. From the surface morphology pictures in Fig. 2(a–c), all the membranes were smooth and dense. However, the SA–BS@GO-3.5 membrane showed wrinkles due to its plentiful BS@GO sheets.25 The cross-sectional morphology of SA–BS@GO-1.5 revealed that a dense layer about 5 μm thick was tightly supported by the honeycomb nylon substrate (Fig. 2d). The porous honeycomb nylon substrate endowed the hybrid membranes with sufficient mechanical strength and negligible permeate resistance. The dense layer should act as the active layer during the pervaporation progress. AFM images in the 4 × 4 μm2 scanning area (Fig. S5†) confirmed the SEM results, with inconspicuous differences in both the surface roughness and morphology between the SA and SA–BS@GO-1.5 membranes. As shown in the XRD patterns in Fig. S6,† neither new bonds of BS@GO nor bond shifts appeared with the different dosages of BS@GO in SA; it can be ascertained that the BS@GO sheets were distributed homogeneously inside the SA matrix, which is identical to results in published papers.25,32
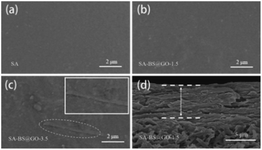 |
| | Fig. 2 Surface morphologies of (a) SA; (b) SA–BS@GO-1.5; (c) SA–BS@GO-3.5 and (d) cross-section morphology of the SA–BS@GO-1.5 membrane. | |
The cross-sectional images captured from the active layer showed differences in the membranes of SA and SA–BS@GO-X, as shown in Fig. 3. The cross-section of SA was relatively smooth and homogeneous, as shown in Fig. 3a. Fig. 3b and c denote that the BS@GO sheets tended to arrange horizontally in the membrane surface of the SA matrix.25 In the SA–BS@GO-1.5 matrix, the filler sheets were arranged in an orderly manner parallel to the membrane surface (the yellow dashed lines mark the parallel direction of the BS@GO sheets in Fig. 3b). Fig. 3c revealed that the filler sheets may suffer from overlapping and curving (called agglomeration) at the SA–BS@GO-3.5 matrix. When agglomeration occurs, the advantages of the filler sheets cannot be fully exploited.25
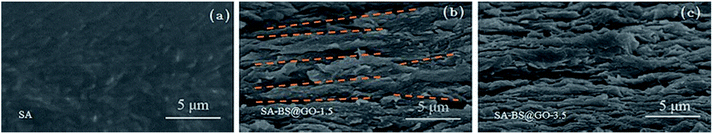 |
| | Fig. 3 Cross-section images of the matrices of (a) SA; (b) SA–BS@GO-1.5; (c) SA–BS@GO-3.5. | |
The chemical structures of the pure SA and SA–BS@GO-X hybrid membranes were studied by FT-IR, as shown in Fig. 4. For all of the membranes, similar characteristic peaks of the stretching vibration of the –OH group (i region), symmetric stretching vibration of the –COO− group (ii region), and asymmetric stretching vibration of the –COO− group (iii region) could be designated at ∼3400 cm−1, ∼1610 cm−1, and ∼1425 cm−1, respectively (Fig. 4a). The peaks at 1100 cm−1 and 822 cm−1 can be attributed to C–O–C of aliphatic ether and cyclic ether from the SA matrix and were identical among the different membranes. Meanwhile, in region (i), the band shifted from 3390 cm−1 (pure SA membrane) to 3406 cm−1 (SA−BS@GO-1.5 membrane) and then to 3400 cm−1 (SA–BS@GO-3.5 membrane). Also, in regions (ii) and (iii), red shifts were observed from 1611 cm−1 and 1426 cm−1 (pure SA membrane) to 1603 cm−1 and 1424 cm−1 (SA–BS@GO-1.5 and SA–BS@GO-3.5 membranes), respectively. It can be deduced that H-bonds were formed between the –COO− groups of SA and the –phSO3H groups of the BS@GO sheets in the hybrid membranes, as shown in Fig. S7.† The H-bonds between the hydroxyl groups inside the SA matrix were weakened, and the weakened effect was decreased by the agglomeration of excessive BS@GO sheets. These results were reinforced by the Tg and DSC data (Fig. 5).
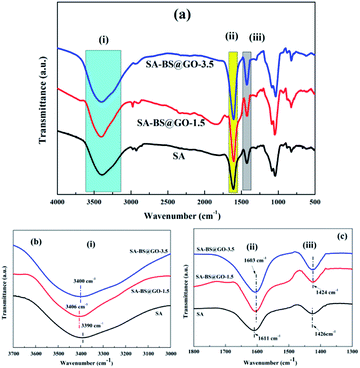 |
| | Fig. 4 FT-IR spectra of the SA and SA–BS@GO-X hybrid membranes: (a) whole spectra; (b) spectra of region (i); (c) spectra of regions (ii) and (iii). | |
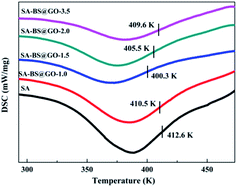 |
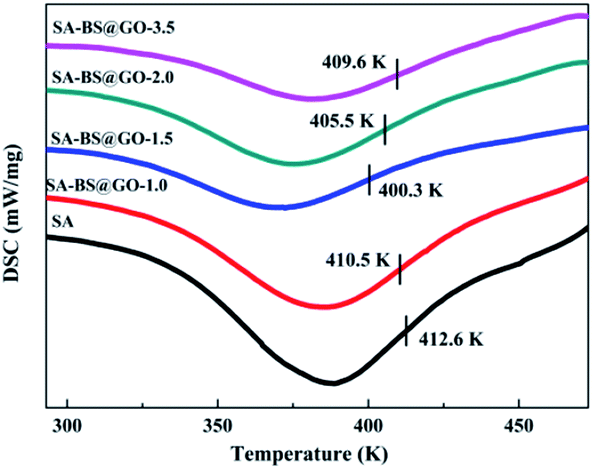
| | Fig. 5 DSC curves of the SA and SA–BS@GO-X hybrid membranes. | |
As shown in Fig. 5, as the H-bonds weakened with increasing dosage from 0 to 1.0 wt% and 1.5 wt% inside the SA matrix, the glass transition temperature (Tg) of the hybrid polymers decreased from 412.6 K to 410.5 K and 400.3 K, then enhanced again to 405.5 K and 409.6 K when the mass contents of BS@GO were 2.0 wt% and 3.5 wt%, respectively. The stronger the H-bonds between SA chains, the higher the Tg revealed by the membrane. Therefore, the filler of BS@GO sheets could mobilize the SA matrix at no more than 1.5 wt% in the hybrid membranes. However, large amounts of filler (more than 1.5 wt%) agglomerated to obstruct the chain mobility.48
3.3 Comparing the SA-based hybrid membranes with GO fillers
As reported in the literature, GO can improve the pervaporation properties of SA-based hybrid membranes by improving not only the permeation fluxes but also the separation factors.32,49 A control membrane with a GO doping amount of 1.5 wt% was accordingly fabricated for comparison and labelled SA–GO-1.5.
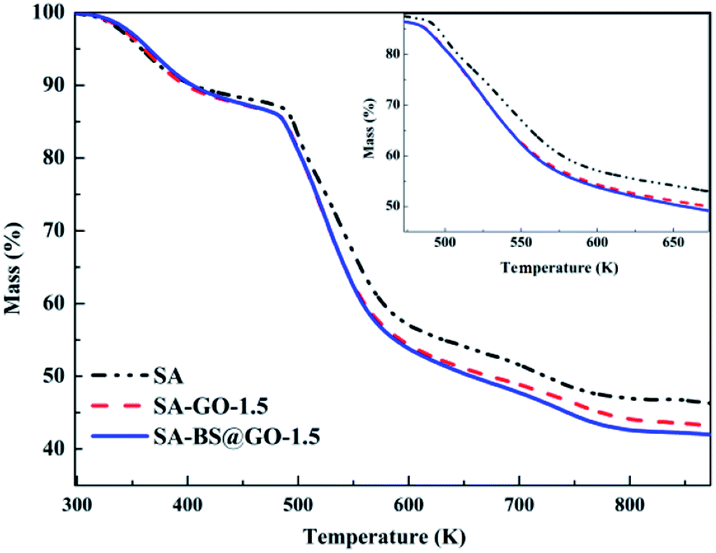
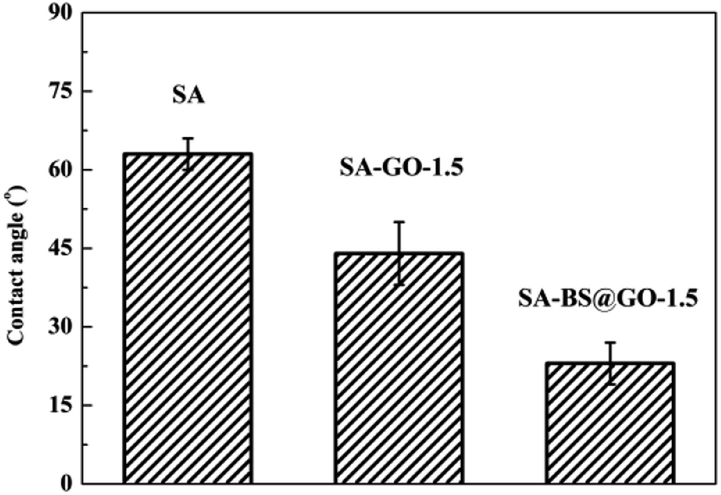
The thermal stabilities of the SA, SA–GO-1.5 and SA–BS@GO-1.5 hybrid membranes were evaluated by TGA under a nitrogen atmosphere. The TGA results are shown in Fig. 6. The DTG results are shown in Fig. S8,† and the parameters are shown in Table S1.† From the thermogravimetric results, the decomposition process of the hybrid membrane involves three stages.48,50,51 The first stage (under 473 K) is the evaporation of trace water within the polymer. The functional groups on the SA chains with the oxygen-containing functional groups in GO or BS@GO (e.g. –SO3H, –OH, –COOH and epoxy groups) mainly decomposed in the second stage (473–673 K). The third stage from 673 K to 873 K was due to the pyrolysis of the SA polymer backbone. The different hybrid membranes exhibited nearly the same thermal stability and thermal decomposition behaviour as the SA membrane. This testing temperature was much higher than the actual separation operating temperature (≤343 K), ensuring sufficient thermal stability of the membranes. The weight loss rate increased in the order of SA, SA–GO-1.5, SA–GO@BS-1.5 in the second stage of 473–673 K, which can be explained by the maximum functional groups on GO@BS and the minimum functional groups in pure SA. SA and the added sheets are both hydrophilic substances. The contact angle order of SA–BS@GO-1.5 < SA–GO-1.5 < SA can be seen in Fig. 7. Therefore, it can be confirmed that BS@GO filler can improve the hydrophilic properties of SA-based membranes more than GO.
 |
| | Fig. 6 TGA curves of the different membrane samples. | |
 |
| | Fig. 7 Contact angles of the SA, SA–GO-1.5 and SA–BS@GO-1.5 membranes. | |
SA and the added sheets are both hydrophilic substances. The contact angle order of SA–BS@GO-1.5 < SA–GO-1.5 < SA can be seen in Fig. 7. Therefore, it can be confirmed that BS@GO filler can improve the hydrophilic properties of SA-based membranes more than GO.
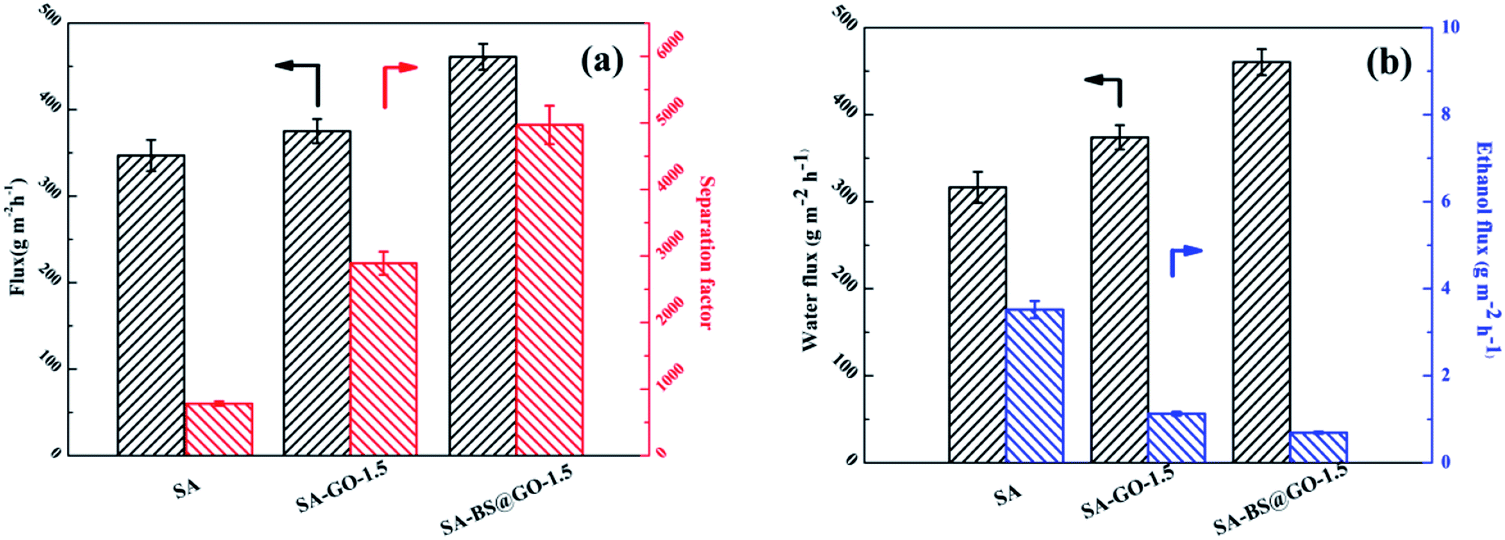
The pervaporation properties (90 wt% ethanol/water mixed solution feed, 323 K) of the SA, SA–GO-1.5 and SA–BS@GO-1.5 membranes are shown in Fig. 8. Both the flux and separation were promoted in the order of SA, SA–GO-1.5, SA–BS@GO-1.5 (Fig. 8a). In the literature, GO plays a similar role to BS@GO in SA-based hybrid membranes during dehydration by pervaporation with its transport pathways consisting of hydrophobic aromatic rings and hydrophilic oxygenated groups.25,32,49 Benefiting from the high hydrophilicity and ethanol repellence endowed by the benzenesulfonic groups of BS@GO, the water flux increased and the ethanol flux decreased more obviously than with GO (Fig. 8b).
 |
| | Fig. 8 Pervaporation properties of the SA, SA–GO-1.5 and SA–BS@GO-1.5 membranes: (a) total flux and separation factor; (b) water flux and ethanol flux. | |
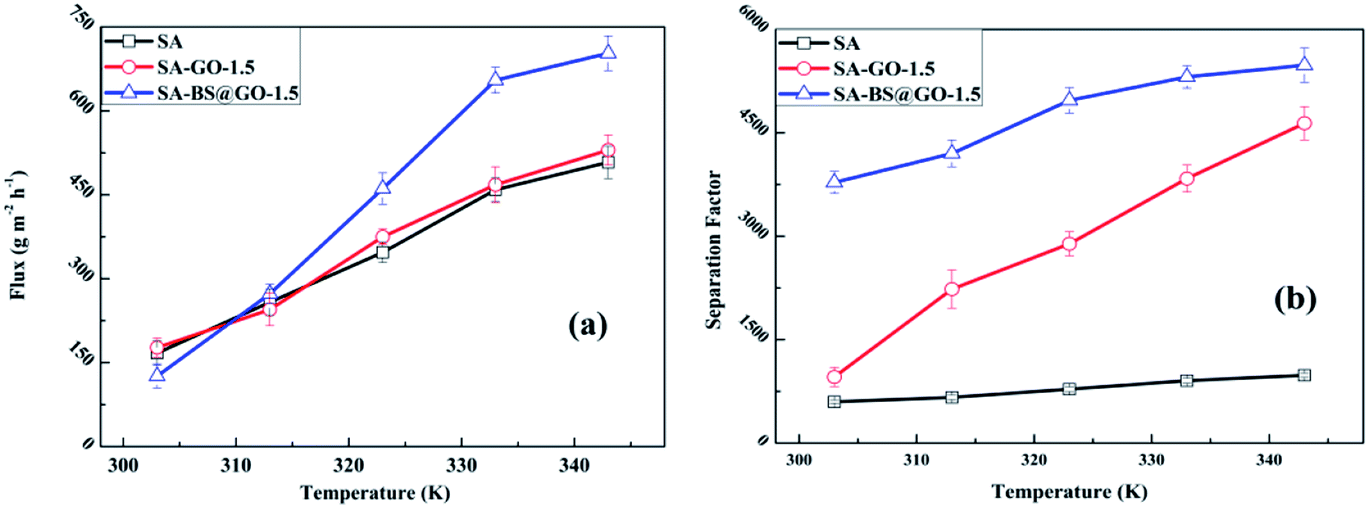
In Fig. 9, the SA, SA–GO-1.5 and SA–BS@GO-1.5 membranes show gradually increasing fluxes and separation factors as the temperature increases from 303 K to 343 K. As the pervaporation of the three membranes was operated in the same conditions of temperature and feed content, the pervaporation characteristics can be explained by the permeance (GPU) and selectivity (Fig. S9†) as well as by the normalized driving force and membrane thickness calculated by eqn (5) and (6).
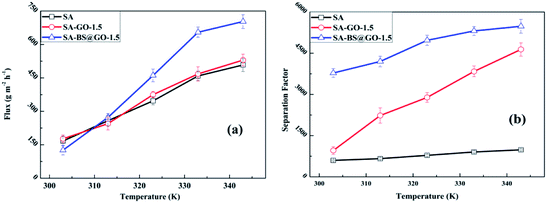 |
| | Fig. 9 Pervaporation results at different operation temperatures: (a) flux and (b) separation factor. | |
In the range of 303–343 K, the water permeance value of the SA–BS@GO-1.5 membrane was obviously larger than that of the SA–GO-1.5 membrane, while the water permeance value of the SA–GO-1.5 membrane was slightly larger than that of the SA membrane. On the other hand, the ethanol permeance value of the SA membrane was significantly higher than that of the SA–GO-1.5 membrane, while the SA–BS@GO-1.5 membrane showed a lower value than the SA–GO-1.5 membrane in the operation temperature range. Therefore, it was determined that the GO filler hindered permeation of ethanol, while the benzenesulfonic structures on BS@GO accelerated the water transmittance. Thus, the flux of the SA–GO-1.5 membrane was slightly higher than that of the SA membrane and remarkably smaller than that of the SA–BS@GO-1.5 membrane, especially at higher temperature. The separation factor of the SA–GO-1.5 membrane was larger than that of the SA membrane, and this gap gradually enlarged as the temperature rose. At the same time, the SA–BS@GO-1.5 membrane showed the highest separation factor in the operation temperature range.
3.4 Properties of the SA–BS@GO-X membranes
The effects of the BS@GO content in the hybrid membranes were determined by studying their hydrophilicity and pervaporation.
Fig. 10 shows that the hydrophilic BS@GO fillers could decrease the contact angle of the SA–BS@GO-X hybrid matrix when the content was no more than 1.5 wt%; however, excessive (more than 1.5 wt%) fillers had the opposite effect. Therefore, appropriate hydrophilic BS@GO fillers can enhance the water affinity of the hybrid membranes, but agglomeration may be counterproductive. The addition of BS@GO was beneficial to the enrichment of water molecules on the surface of the separation membrane.52
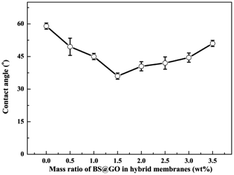 |
| | Fig. 10 Contact angles of the SA–BS@GO-X membranes with different mass ratios. | |
The dehydration results by pervaporation of the SA–BS@GO-X membranes are displayed in Fig. 11. The pervaporation was performed with 90 wt% ethanol/water mixed solution feed at 323 K. The sample SA–BS@GO-1.5 with moderate BS@GO doping content showed the highest factor and flux. The ethanol flux decreased monotonically from 3.5 g m−2 h−1 to 0.6 g m−2 h−1 as the BS@GO doping increased from 0 to 3.5 wt%. This was due to the synergy of ethanol repellence (Fig. S4†) and the hindering effect of BS@GO. The water flux increased from 316.5 g m−2 h−1 to 460.1 g m−2 h−1 due to the improved hydrophilicity of the BS@GO filler and promoted the mobility of the SA matrix (from the Tg results, Fig. 5). More BS@GO could decrease the water flux to 153 g m−2 h−1 (SA–BS@GO-3.5). Therefore, the separation factor increased from 781 (SA) to 4969 (SA–BS@GO-1.5) sharply, then decreased to 2240 (SA–BS@GO-3.5).
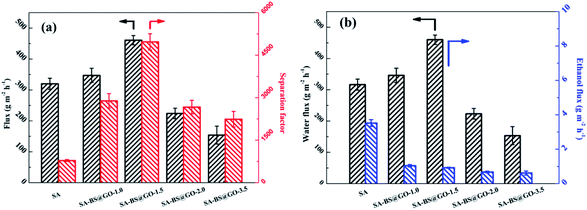 |
| | Fig. 11 Pervaporation results of the SA–BS@GO-X membranes: (a) total flux and separation factor; (b) water flux and ethanol flux. | |
3.5 Effects of the operation conditions on the pervaporation performance
The optimized membrane of SA–BS@GO-1.5 was used to study the effects of the operation conditions on the pervaporation performance.
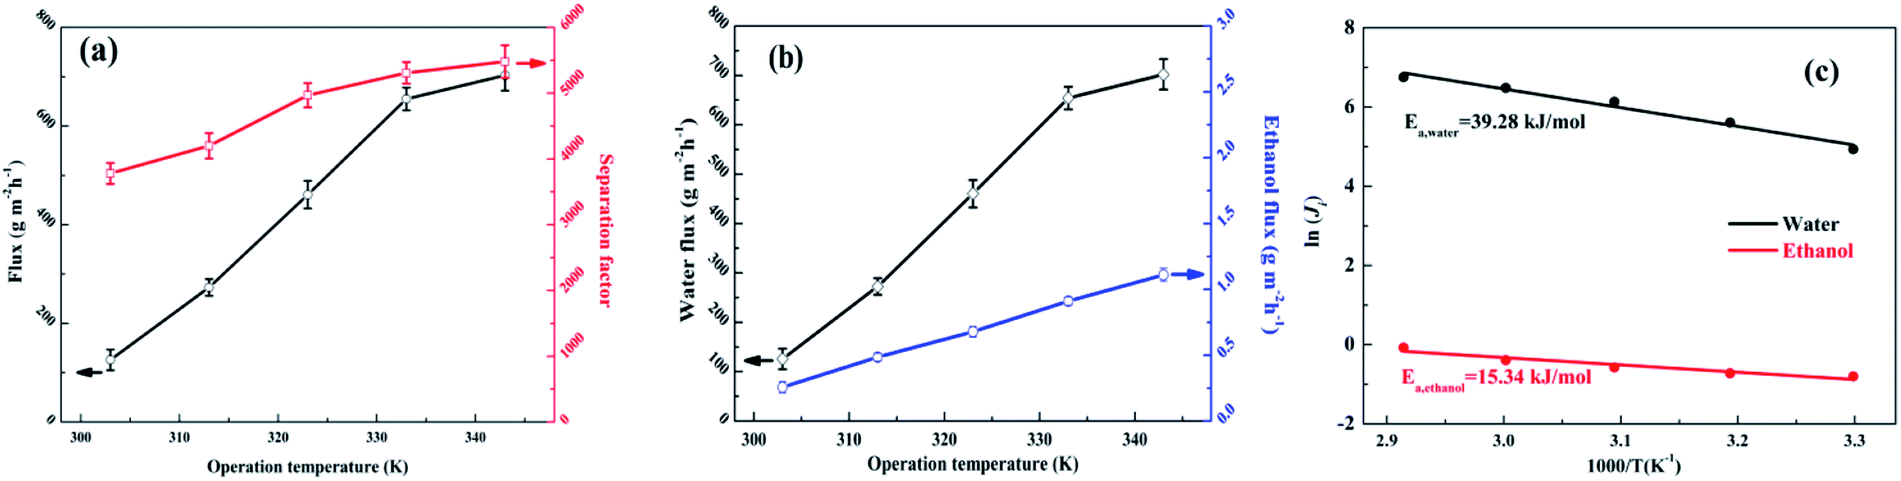
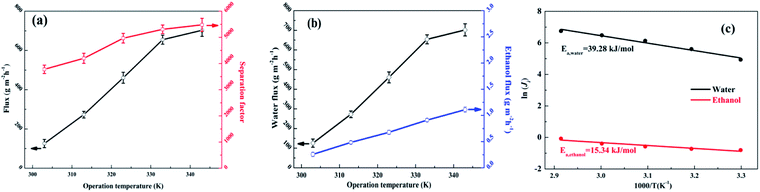
The effects of the operation temperature (303–343 K) were investigated with a feed of 90 wt% ethanol/water mixed solution and are shown in Fig. 12(a and b). The water flux, ethanol flux, total flux and separation factor increased with increasing temperature. The increments of the fluxes with higher operation temperature were attributed to the improved driving force (higher partial pressure on the upstream side while the downstream side remains under vacuum), accelerated polymer chain mobility and enhanced thermodynamic movement of the permeate molecules.32,50,53 As shown in Fig. S9,† for the SA–BS@GO-1.5 membrane, the ethanol permeance showed low absolute values and decreased obviously with increasing temperature, while the water permeance fluctuated in a relatively small range with very high absolute values. This suggests that the driving force is the dominant parameter for the permeation flux.25 Meanwhile, the membranes showed slight swelling in 90 wt% ethanol–water, as in the literature; therefore, membrane swelling was not the primary cause of the permeance.25 The selectivity (β) showed a rapidly rising trend with increasing temperature, which indicates that the ethanol molecules encountered higher transport resistance under high temperature.25
 |
| | Fig. 12 Effects of operation temperature on the pervaporation performance of the SA–BS@GO-1.5 membrane: (a) total flux and separation factor; (b) water flux and ethanol flux; (c) Arrhenius plots for the permeation flux. | |
The apparent activation energy (Ea) is described by the Arrhenius equation in eqn (3). The Ea value of water (39.28 kJ mol−1) was larger than that of ethanol (15.34 kJ mol−1), as shown in Fig. 12c. The positive Ea value indicates that the transmembrane process was endothermic, and the permeation processes of both water and ethanol were dominated by diffusion.48 It can be seen that water was more sensitive towards temperature variation. Therefore, it can be ascertained that a higher temperature resulted in a higher separation factor.32
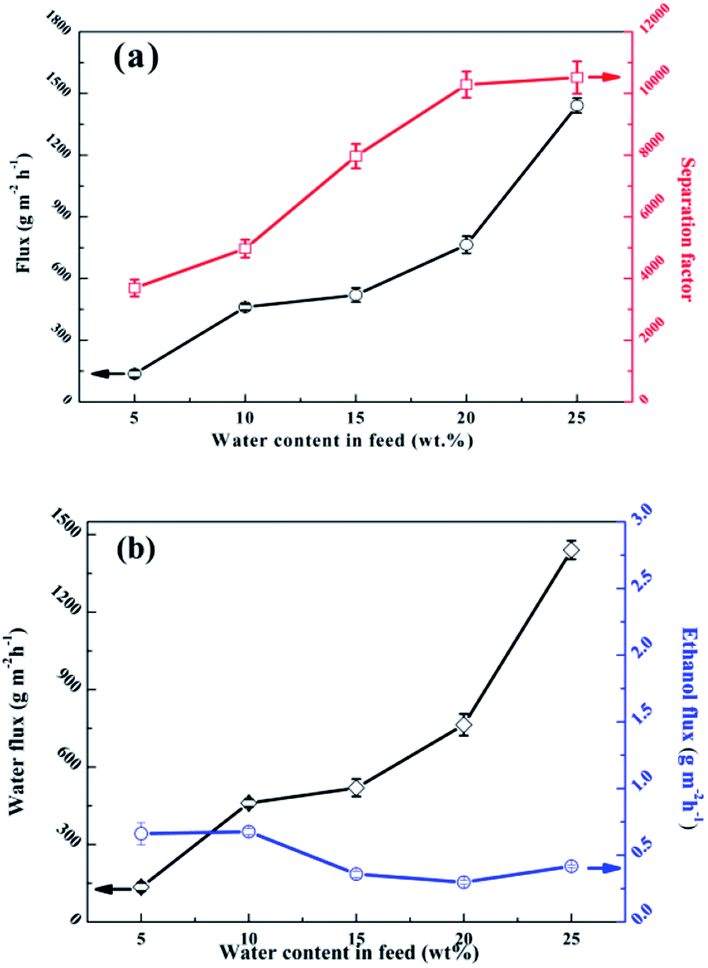
Fig. 13 shows the effects of the feed composition at 323 K on the separation performance. The study found that the total flux (Fig. 13a) and water flux (Fig. 13b) increased while the ethanol flux (Fig. 13b) decreased in the water concentration range from 5 wt% to 25 wt%. An obvious increase in the water concentration in the feed caused increasing water pressure; therefore, the driving force of the water increased and the driving force of the ethanol receded. Moreover, a higher water concentration in the feed liquid can cause slight swelling of the polymer membrane, which facilitates the penetration of both the water and ethanol molecules.54 The separation factor should be elevated significantly with the combined effect of a remarkable increase in water flux and a slight decrease in ethanol flux due to partial pressure and membrane expansion.
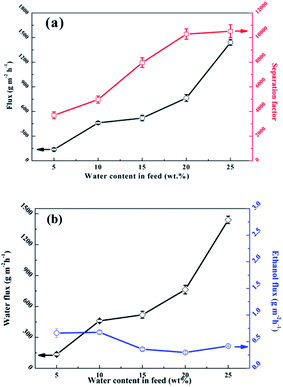 |
| | Fig. 13 Effects of the feed composition on the pervaporation performance of the SA–BS@GO-1.5 membrane: (a) total flux and separation factor; (b) water flux and ethanol flux. | |
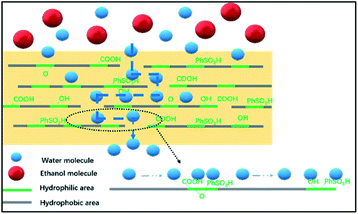
3.6 Transport mechanism in the hybrid membrane
The transport mechanism in the hybrid membranes is proposed and schematically diagrammed in Fig. 14. The BS@GO sheets with moderate contents were aligned parallel to the membrane surface in the SA matrix. The BS@GO sheets showed excellent hydrophilicity, benefitting from the benzenesulfonic groups. Furthermore, the BS@GO fillers could weaken the H-bonds between the SA chains to diminish the water molecule transport resistance in the SA matrix. During the pervaporation process: (1) the hydrophilic membrane should absorb more water molecules than ethanol molecules; (2) water molecules should be transported through the SA matrix and the low-friction “highways” in the hydrophobic regions of the BS@GO sheet edges and defects, as in GO filler-based membranes;32,49 (3) the diffusion of ethanol with a larger kinetic diameter should be restricted by the basal plane (graphene-like area).
 |
| | Fig. 14 An illustration of the transport pathways inside the BS@GO membranes. | |
3.7 Long-term operation stability
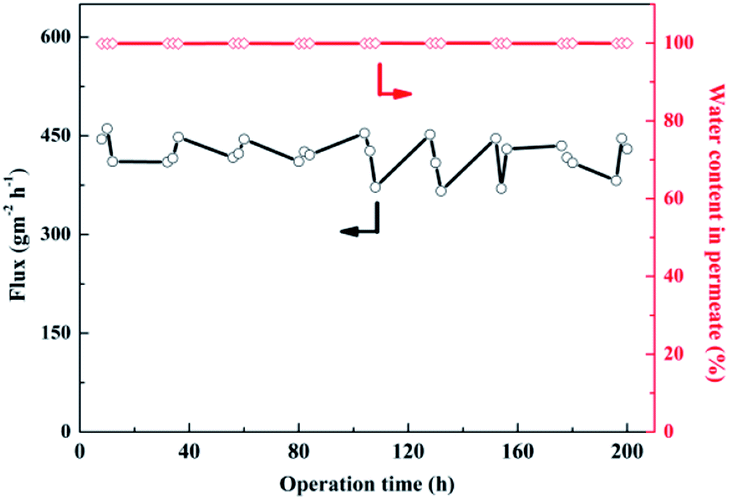
Long-term operation of the SA–BS@GO-1.5 membrane was performed to observe its stability. The SA–BS@GO-1.5 membrane was operated continuously for 200 hours in the pervaporation dehydration process using a 90 wt% ethanol/water feed solution at 323 K. As Fig. 15 shows, because the hybrid membrane had excellent mechanical and thermal properties, the permeate flux of the polymer membrane floated slightly but finally stabilized at about 430 g m−2 h−1, and the water content in the permeate was generally greater than 99.7 wt%. As shown in Fig. 15, the hybrid membrane was expected to be used in practical applications.
 |
| | Fig. 15 Long-term operation evaluation of the SA–BS@GO-1.5 membrane. | |
3.8 Comparison of the pervaporation performance of recently reported membranes
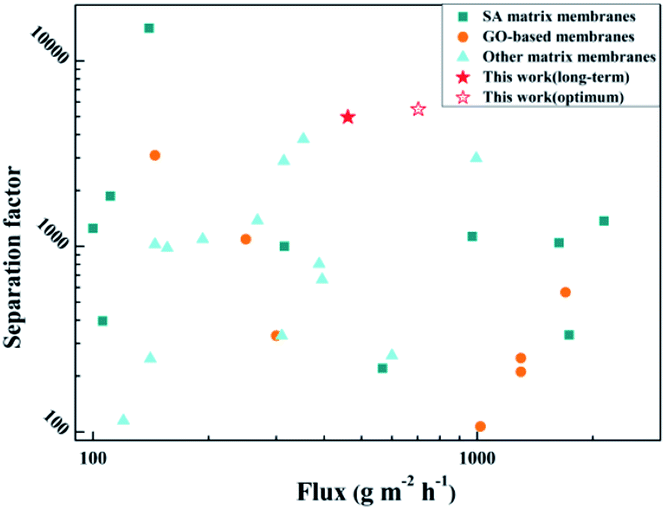
The separation performance of the polymer membrane in this study was compared with that of recently reported separation membranes, as shown in Fig. 16 and Table S2 (detailed experimental data†), including SA-based, GO-based, and PVA-based membranes. It can be seen that the hybrid membranes prepared in this work exhibit higher permeation fluxes and separation factors due to the construction of fast transport channels of solvent molecules in the SA matrix and the preference for water molecules. For the membrane in this study, the flux was higher than those of about half of the reported membranes, and the separation factor was higher than those of most of the reported membranes. The SA–BS@GO-1.5 membrane shows excellent comprehensive properties.
 |
| | Fig. 16 Comparison of the membrane in this study with recently reported membranes in the literature. | |
4. Conclusions
In this study, GO modified with benzenesulfonic groups (BS@GO) was prepared to construct hybrid membranes with SA to dehydrate ethanol aqueous solutions by pervaporation. The modified BS@GO showed higher hydrophilicity than GO. The SA chains in the hybrid membranes showed higher mobility than those in the SA membrane by the H-bond effect. By means of its ability to block the permeate of ethanol arising from the GO structure and the hydrophilicity originating from benzenesulfonic groups, the hybrid membrane with BS@GO as a filler (SA–BS@GO) showed better properties than the hybrid membrane with GO as a filler (SA–GO) with respect to hydrophilicity, pervaporation fluxes and separation. Overabundant content of BS@GO should be avoided to prevent agglomeration. The optimum BS@GO mass content was 1.5 wt% in the SA matrix. The optimal hybrid membrane, SA–BS@GO-1.5, showed the highest pervaporation flux of 703 ± 89 g m−2 h−1 (1.4 times that of the SA membrane) and a separation factor of 5480 (5.6 times that of the SA membrane). The hybrid membrane exhibited excellent long-term separation operation stability. This study provides a versatile and simple method for preparing dense, highly water-selective separation membranes.
Conflicts of interest
There are no conflicts to declare.
Acknowledgements
The authors appreciate the financial support by the National Natural Science Foundation of China (21476055) and the Fundamental Research Funds for the Central Universities (JZ2019HGBZ0169).
References
- M. S. Jyothi, K. R. Reddy, K. Soontarapa, S. Naveen, A. V. Raghu, R. V. Kulkarni, D. P. Suhas, N. P. Shetti, M. N. Nadagouda and T. M. Aminabhavi, J. Environ. Manage., 2019, 242, 415–429 CrossRef CAS PubMed.
- S. Richter, Environ. Sci. Pollut. Res., 2006, 13, 145 CrossRef.
- D. Hua, R. K. Rai, Y. Zhang and T. S. Chung, Chem. Eng. Sci., 2017, 161, 341–349 CrossRef CAS.
- R. Castro-Munoz, F. Galiano, V. Fila, E. Drioli and A. Figoli, Rev. Chem. Eng., 2019, 35, 565–590 CAS.
- D. Achari, P. Rachipudi, S. Naik, R. Karuppannan and M. Kariduraganavar, J. Ind. Eng. Chem., 2019, 78, 383–395 CrossRef CAS.
- P. Liu, M. M. Chen, Y. Q. Ma, C. Hu, Q. G. Zhang, A. M. Zhu and Q. L. Liu, Chem. Eng. Sci., 2019, 206, 489–498 CrossRef CAS.
- M. Hassan, K. R. Reddy, E. Haque, A. I. Minett and V. G. Gomes, J. Colloid Interface Sci., 2013, 410, 43–51 CrossRef CAS PubMed.
- D. R. Son, A. V. Raghu, K. R. Reddy and H. M. Jeong, J. Polym. Sci., Part B: Polym. Phys., 2016, 55, 1099–1110 CAS.
- K. R. Reddy, K. P. Lee, A. I. Gopalan and H. D. Kang, React. Funct. Polym., 2007, 67, 943–954 CrossRef CAS.
- S. J. Han, H. I. Lee, H. M. Jeong, B. K. Kim, A. V. Raghu and K. R. Reddy, J. Polym. Sci., Part B: Polym. Phys., 2014, 53, 1193–1204 CAS.
- K. R. Reddy, B. C. Sin, K. S. Ryu, J. Noh and Y. Lee, Synth. Met., 2009, 159, 1934–1939 CrossRef CAS.
- S. H. Choi, D. H. Kim, A. V. Raghu, K. R. Reddy, H. I. Lee, K. S. Yoon, H. M. Jeong and B. K. Kim, J. Polym. Sci., Part B: Polym. Phys., 2012, 51, 197–207 CAS.
- M. U. Khan, K. R. Reddy, T. Snguanwongchai, E. Haque and V. G. Gomes, Colloid Polym. Sci., 2016, 294, 1599–1610 CrossRef CAS.
- Y. R. Lee, S. C. Kim, H. I. Lee, H. M. Jeong, A. V. Raghu, K. R. Reddy and B. K. Kim, Macromol. Res., 2011, 19, 66–71 CrossRef CAS.
- F. B. Peng, C. L. Hu and Z. Y. Jiang, J. Membr. Sci., 2007, 297, 236–242 CrossRef CAS.
- A. F. Ismail, P. S. Goh, S. M. Sanip and M. Aziz, Sep. Purif. Technol., 2009, 70, 12–26 CrossRef CAS.
- N. X. Wang, S. L. Ji, G. J. Zhang, J. Li and L. Wang, Chem. Eng. J., 2012, 213, 318–329 CrossRef CAS.
- T. Tavangar, M. Karimi, M. Rezakazemi, K. R. Reddy and T. M. Aminabhavi, Chem. Eng. J., 2020, 385, 123787 CrossRef.
- C. V. Reddy, I. N. Reddy, B. Akkinepally, V. V. N. Harish, K. R. Reddy and S. Jaesool, Ceram. Int., 2019, 45, 15298–15306 CrossRef CAS.
- S. P. Dharupaneedi, S. K. Nataraj, M. Nadagouda, K. R. Reddy, S. S. Shukla and T. M. Aminabhavi, Sep. Purif. Technol., 2019, 210, 850–866 CrossRef CAS.
- K. T. Cao, Z. Y. Jiang, X. S. Zhang, Y. M. Zhang, J. Zhao, R. S. Xing, S. Yang, C. Y. Gao and F. S. Pan, J. Membr. Sci., 2015, 490, 72–83 CrossRef CAS.
- K. R. Reddy, C. V. Reddy, M. N. Nadagouda, N. P. Shetti, S. Jaesool and T. M. Aminabhavi, J. Environ. Manage., 2019, 238, 25–40 CrossRef CAS PubMed.
- Q. Q. Li, Q. Liu, J. Zhao, Y. Y. Hua, J. J. Sun, J. G. Duan and W. Q. Jin, J. Membr. Sci., 2017, 544, 68–78 CrossRef CAS.
- X. K. Cai, T. Luo, B. Liu and H. M. Cheng, Chem. Soc. Rev., 2018, 47, 6224–6266 RSC.
- K. C. Guan, F. Liang, H. P. Zhu, J. Zhao and W. Q. Jin, ACS Appl. Mater. Interfaces, 2018, 10, 13903–13913 CrossRef CAS PubMed.
- C. Xue, W. B. Cai, X. H. Chen, Z. Shi and J. D. Li, RSC Adv., 2019, 9, 15457–15465 RSC.
- T. M. Yeh, Z. Wang, D. Mahajan, B. S. Hsiao and B. Chu, J. Mater. Chem. A, 2013, 1, 12998–13003 RSC.
- J. Zhao, Y. W. Zhu, F. S. Pan, G. W. He, C. H. Fang, K. T. Cao, R. S. Xing and Z. Y. Jiang, J. Membr. Sci., 2015, 487, 162–172 CrossRef CAS.
- X. Zhang, M. X. Zhang, H. Ding, H. Yang, X. H. Ma, X. R. Xu, Z. L. Xu and C. Y. Tang, ACS Omega, 2019, 4, 15043–15050 CrossRef CAS PubMed.
- W. Cha-Umpong, G. X. Dong, A. Razmjou and V. Chen, J. Membr. Sci., 2019, 588, 117210 CrossRef CAS.
- W. Cha-Umpong, E. Hosseini, A. Razmjou, M. Zakertabrizi, A. H. Korayem and V. Chen, J. Membr. Sci., 2020, 598, 117687 CrossRef CAS.
- K. T. Cao, Z. Y. Jiang, J. Zhao, C. H. Zhao, C. Y. Gao, F. S. Pan, B. Y. Wang, X. Z. Cao and J. Yang, J. Membr. Sci., 2014, 469, 272–283 CrossRef CAS.
- J. Zhao, Y. W. Zhu, G. W. He, R. S. Xing, F. S. Pan, Z. Y. Jiang, P. Zhang, X. Z. Cao and Y. Wang, ACS Appl. Mater. Interfaces, 2016, 8, 2097–2103 CrossRef CAS PubMed.
- G. L. Han, Z. Chen, L. F. Cai, Y. H. Zhang, J. F. Tian, H. H. Ma and S. M. Fang, J.Appl. Polym. Sci., 2020, 137, 48526 CrossRef CAS.
- Y. S. Ye, M. Y. Cheng, X. L. Xie, J. Rick, Y. J. Huang, F. C. Chang and B. J. Hwang, J. Power Sources, 2013, 239, 424–432 CrossRef CAS.
- J. Wang, M. M. Chen, C. Y. Wang, J. Z. Wang and J. M. Zheng, J. Power Sources, 2011, 196, 550–558 CrossRef CAS.
- Ravikumar and S. Keith, Chem. Commun., 2012, 48, 5584–5586 RSC.
- F. B. Peng, L. Y. Lu, C. L. Hu, H. Wu and Z. Y. Jiang, J. Membr. Sci., 2005, 259, 65–73 CrossRef CAS.
- K. Huang, G. P. Liu, Y. Y. Lou, Z. Y. Dong, J. Shen and W. Q. Jin, Angew. Chem. Int. Edit., 2014, 53, 6929–6932 CrossRef CAS PubMed.
- Y. K. Ong, G. M. Shi, N. L. Le, Y. P. Tang, J. Zuo, S. P. Nunes and T. S. Chung, Prog. Polym. Sci., 2016, 57, 1–31 CrossRef CAS.
- S. V. Kononova, D. A. Sapegin, E. V. Kruchinia, G. N. Gubanova, K. A. Romashkova, A. L. Didenko, V. E. Smirnova, E. N. Popova, N. N. Saprykina, E. N. Vlasova and V. M. Svetlichnyi, J. Appl. Polym. Sci., 2019, 136, 48197 CrossRef.
- Y. Shen and B. L. Chen, Environ. Sci. Technol., 2015, 49, 7364–7372 CrossRef CAS PubMed.
- J. Gao, F. Liu, Y. L. Liu, N. Ma, Z. Q. Wang and X. Zhang, Chem. Mater., 2010, 22, 2213–2218 CrossRef CAS.
- G. X. Zhao, L. Jiang, Y. D. He, J. X. Li, H. L. Dong and X. K. Wang, Adv. Mater., 2011, 23, 3959–3963 CrossRef CAS PubMed.
- W. Y. Huang, X. L. Ouyang and L. Lee, J. ACS Nano., 2012, 6, 10178–10185 CrossRef CAS PubMed.
- Y. Xie, M. H. Edward, C. S.-N. Lindsay and A. P. Brian, Environ. Sci. Technol., 2016, 50, 1821–1827 CrossRef CAS.
- Z. Q. Jiang, X. S. Zhao and A. Manthiram, Int. J. Hydrog. Energ., 2013, 38, 5875–5884 CrossRef CAS.
- B. X. Gao, Z. Y. Jiang, G. H. Liu, R. S. Xing, H. Wu, F. S. Pan, B. Y. Wang and X. Z. Cao, J. Membr. Sci., 2016, 520, 951–963 CrossRef CAS.
- J. Zhao, Y. W. Zhu, G. W. He, R. S. Xing, F. S. Pan, Z. Y. Jiang, P. Zhang, X. Z. Cao and B. Y. Wang, ACS Appl. Mater. Interfaces, 2016, 8, 2097–2103 CrossRef CAS PubMed.
- Y. M. Song, Z. Y. Jiang, B. X. Cao, H. J. Wang, M. D. Wang, Z. He, X. Y. Cao and F. S. Pan, Chem. Eng. Sci., 2018, 185, 231–242 CrossRef CAS.
- B. Munavalli, A. Torvi and M. Kariduraganavar, Polymer, 2018, 142, 293–309 CrossRef CAS.
- S. P. Dharupaneedi, R. V. Anjanapura, J. M. Han and T. M. Aminabhavi, Ind. Eng. Chem. Res., 2014, 53, 14474–14484 CrossRef CAS.
- M. R. Wang, H. Wu, X. T. Jin, C. Yang, X. Y. He, F. S. Pan, Z. Y. Jiang, C. Y. Wang, M. M. Chen, P. Zhang and X. Z. Cao, Chem. Eng. Sci., 2018, 178, 273–283 CrossRef CAS.
- J. Zhao, F. S. Pan, P. Li, C. H. Zhao, Z. Y. Jiang, P. Zhang and X. Z. Cao, ACS Appl. Mater. Interfaces, 2013, 5, 13275–13283 CrossRef CAS PubMed.
Footnote |
| † Electronic supplementary information (ESI) available. See DOI: 10.1039/d0ra02668a |
|
| This journal is © The Royal Society of Chemistry 2020 |
Click here to see how this site uses Cookies. View our privacy policy here. 
 Open Access Article
 This Open Access Article is licensed under a Creative Commons Attribution-Non Commercial 3.0 Unported Licence
 ,
Yingying Lu,
Lulu Yao
,
Yingying Lu,
Lulu Yao