 Open Access Article
Preparation of high-performance toluene adsorbents by sugarcane bagasse carbonization combined with surface modification†
Yu Wang a,
Wangsheng Chenb,
Bo Zhao
 *a,
Huaqin Wanga,
Linbo Qin
 a and
Jun Han
 *ab
*ab
aHubei Key Laboratory for Efficient Utilization and Agglomeration of Metallurgic Mineral Resources, Wuhan University of Science and Technology, Wuhan, 430081, P. R. China. E-mail: hanjun@wust.edu.cn; zhaobo87@wust.edu.cn
bHubei Provincial Industrial Safety Engineering Technology Research Center, Wuhan University of Science and Technology, Wuhan, 430081, P. R. China
First published on 23rd June 2020
Abstract
A series of activated carbons were prepared by carbonizing sugarcane bagasse combined with surface modification, which showed an excellent performance of adsorbing toluene (522 mg g−1 at 30 °C). The results demonstrated that the enhancement of the activated temperature was benefit to promote the porosity and specific surface area (BET) of ACs. Thus, AC-800 showed optimal adsorption and its toluene adsorption performance was better than that of most ACs in the literature. Five consecutive adsorption–desorption cycles presented that AC-800's toluene adsorptive capacity was as high as 522 mg g−1 (30 °C), and toluene adsorptive capacity was only decreased by 4.5%. According to the fraction of N-containing functional groups and the binding energy of toluene on N-containing functional groups, pyridinic-N (N-6) was believed to contribute more to toluene adsorption. Moreover, the Bangham model was considered as the best model of describing toluene adsorption on AC-800. Therefore, both surface adsorption and pore diffusion were the two mechanisms of toluene adsorption, and the diffusion of toluene molecules in the pores was considered as the key factor that affected the adsorption rate.
1. Introduction
Recently, increasing pollutants are being generated and emitted into the atmosphere because of rapid industrialization and urbanization in China, which has led to the deterioration of air quality. Thus, smog-like weather is being frequently experienced in most cities. In recent years, there have been many efforts by Chinese government to reduce the emission of the pollutants and improve air quality.1 In general, the emission of the conventional pollutants such as SO2, NOx and dust were significantly decreased. For example, the emitted SO2, NOx and dust in 2014 was 19.74, 20.78 and 17.40 million tons, which was decreased to 8.75, 12.58 and 7.96 million tons in 2017. Unfortunately, volatile organic compounds (VOCs) emission has still increased. It has been reported that the anthropogenic VOC emission in 2015 was 31.12 million tons, and the estimated VOC emission in 2020 will be 41.74 million tons.2 Moreover, parts of VOCs are toxic and carcinogenic, which harm both human health and deteriorate the ecological environment.3 VOCs are also regarded as one of the precursors of ozone or secondary organic aerosols.4 The Chinese government required that VOC emission in 2020 should be <28.00 million tons. Thus, the reduction or elimination of VOC emission has been a hot wave. Currently, VOC control technologies include adsorption,5 photocatalytic degradation,6 condensation,7 catalytic oxidation,8 membrane separation,9 combustion10 and biological degradation.11 Among the above VOCs treatment methods, adsorption is considered as the most potential choice because of its low operation cost, high selectivity and stability, and high removal efficiency.3In general, VOCs' adsorption efficiency or selectivity significantly depends on the specific surface area (BET), pore size distribution, pore volume and surface functional groups.12 Activated carbon (AC) has been frequently used as an absorbent due to its large BET, rich porosity and high adsorption performance.13,14 In particular, the textural properties of AC could be controlled through preparation parameters. The BET of AC always increased with the enhancement of carbonization temperature, and the high carbonization temperature promoted the formation of micropores.15,16 The preparation methods of AC are primarily divided into pyrolysis and hydrothermal methods. In recent years, researchers are focusing on modified AC due to the requirement for the directional regulation of pore structure. Yang et al. agreed that the adsorption capacity of AC had a close relation with the porosity and BET due to the capillary condensation of VOCs.17 Lillo-Ródenas et al. considered that toluene and benzene were first adsorbed in the micropores.18 Moreover, the surface functional groups such as carbonyl, amino and N-functionalities in the AC surface may promote the adsorption capacity of benzene and toluene17,19 while the oxygen-containing functional groups had a negative effect on benzene and toluene adsorption.20
In this work, sugarcane bagasse, as a sustainable carbohydrate-rich biomass, has been selected for producing AC as the raw material. In recent years, people have used biomass materials to prepare ACs, including rice straw, walnut hulls, and corn cobs. Compared with other raw materials, the carbon content in bagasse is as high as >80%, and it has a porous fibrous structure; therefore, it is more suitable to prepare AC with a richer pore structure.21–23 In addition, due to the rapid development of the sugar industry, the annual output of bagasse is huge without effective use. To be prepared as AC, it can both make full use of the biomass energy inside and reduce the environmental pressure. In N-doped activated carbon, N is introduced to make the prepared sample surface carry N-containing functional groups, which could change the interaction between surface electrons and toluene and thereby promote adsorption ability. Certain studies reported that nitrogen-doped activated carbon can change its surface functional groups and promote electronic interaction between activated carbon and toluene. Commonly, N-doping materials include diethylenetriamine (DEA), triethylenetetramine (TETA), tetraethylenepentamine (TEPA), melamine and pyrrole.
In this paper, a series of N-doped AC derived from sugarcane bagasse (SB) were prepared. Moreover, toluene was used as a typical VOC, and its adsorption performance and mechanism in our AC were discussed in detail.
2. Experimental
2.1 AC preparation procedure
Waste agricultural biomass (sugarcane bagasse) was carbonized to prepare AC, which was purchased from Sugarcane Industry Research Institute (Guangxi, China). The obtained raw material was first pre-treated by washing, drying, and cutting. Thus, the sample of 0.6 × 0.8 mm was prepared. Other chemicals such as commercial activated carbon (named AC-commercial), urea, potassium hydroxide, toluene and hydrochloric acid were provided by Sinopharm Chemical Reagent Co., Ltd.First, the pre-treated sugarcane bagasse (SB) sample was mixed with urea at a urea/SB weight ratio of 15 wt%. Then, the distilled water was added to dissolve urea into the solution. After agitation for 12 h, the solution was dried 105 °C until water was removed. Thereafter, the dried sample was carbonized under 600 °C with nitrogen protection. After carbonization for 30 min, heating was stopped and sample was cooled by nitrogen gas to 30 °C. The carbonized SB was then collected and washed through distilled water until pH was 7.0. Finally, N-doped sample was activated with KOH (KOH/sample weight ratio was 2.0), and the activated temperature was 500, 600, 700 and 800 °C. The prepared ACs was named as AC-x, where x meant the activation temperature (°C).
2.2 Adsorption test
The adsorption tests were carried out in a quartz tube reactor, and the inner diameter and the length of the reactor were 6 mm and 35 cm, respectively. The scheme of the experimental setup is shown in Fig. S1.† The reactor was heated by electricity. Moreover, the temperatures were recorded and controlled using a thermocouple. The carrying gas was the mixture of O2 and N2, and O2/N2 ratio was maintained at 1/4 using a flowmeter. During the adsorption test, the flow rate of carrying gas was ∼100 ml min−1, and the reaction temperature was 30 °C. Toluene was used as a VOC in the tests and feed by a syringe pump. The initial concentration of toluene was maintained at 1000 ppm. Before the experiment, 50 mg of AC was loaded into the reactor whose height was ∼2 cm. Toluene concentrations at both inlet and outlet were on-line recorded using a gas chromatograph (GC-7820, Agilent). The breakthrough curves were plotted by the toluene concentration in the effluent gas versus the reaction time, and the breakthrough time was defined as the time that the toluene concentration in the effluent gas was 10% of the initial toluene concentration. Moreover, the adsorption capacity was estimated using eqn (1).24
 | (1) |
2.3 Characterization
The texture properties (pore size distribution, BET and pore volume) of the sample were characterized using a ASAP 2020 surface analyzer (Micromeritics ASAP 2020). The crystal phase was identified by an X-ray diffraction analyzer (XRD; Rigaku RINT2000), and the morphology of the samples was discovered by scanning electron microscopy (SEM; ZEISS Merlin) and transmission electron microscopy (TEM; FEI Tecnai G2 F30). X-ray photoelectron spectroscopy (XPS, Thermo Scientific Escalab 250Xi) and diffuse reflectance infrared Fourier transform spectroscopy (FT-IR, BRUKER TENSOR II) spectra were obtained to identify the surface functionalities. Moreover, the ultimate analysis was analyzed by an Elementar instrument (Elementar vario MICRO).3. Results and discussion
3.1 Texture properties
N2 isothermal adsorption and pore size distribution are presented in Fig. S2† and Table 1. It was demonstrated that the nitrogen adsorption–desorption isotherm for all ACs was type I, and no obvious hysteresis loop was observed. Hence, it can be said that micropores are predominant. Note that AC-500 establishes its adsorption constancy at a very low relative pressure (<0.1); however, for the other samples up to P/P0 ≈ 0.6, which indicates that in the heat-treated samples there exist some larger pores such as supermicropores or small mesopores. Table 1 also provided detailed information of the textural properties. The BET of AC shown in Fig. S2a† sharply increased from 568 to 1123 m2 g−1 when the activated temperature increased from 500 to 600 °C. The further increase of the activated temperature had a slight promotion for BET, and the BET of AC-700 and AC-800 was 1269 and 1381 m2 g−1, respectively. These results may be explained by the treatment temperature being far higher to the activation temperature of KOH; therefore, the porous structure does not significantly change after heat post-treatment at higher temperatures. Due to the high energy consumption and safety risk of activation process, although further increase of activation temperature may slightly increase the specific surface area and pore volume, it is not necessary to investigate from the perspective of economy and safety in practical applications. On the basis of N2 sorption, it can be inferred that heat treatment at different temperatures can control the porous structure of as-prepared ACs under study.| Sample | SBETa, m2 g−1 | Smicb, m2 g−1 | V0c, cm3 g−1 | Vtb, cm3 g−1 | Dpd, nm | N content, % |
|---|---|---|---|---|---|---|
| a Surface area was calculated using the BET method at P/P0 = 0.05–0.30.b Micropore volume evaluated by the t-plot method.c Total pore volume at P/P0 = 0.995.d Calculated by the BJH method. | ||||||
| AC-500 | 568 | 508 | 0.295 | 0.260 | 0.520 | 2.75 |
| AC-600 | 1123 | 1120 | 0.574 | 0.528 | 0.547 | 1.98 |
| AC-700 | 1269 | 1128 | 0.658 | 0.581 | 0.565 | 1.08 |
| AC-800 | 1381 | 1205 | 0.722 | 0.581 | 0.573 | 0.58 |
Moreover, the high activated temperature was beneficial for the total pore volume and micropore volume. In particular, the ratio of micropore volume to the total pore volume decreased from 0.88 to 0.80 when the activated temperature increased from 500 to 800 °C. The pore size distributions (PSDs) had similar tendency, as shown in Fig. S2b.† The PSDs focused on a narrow micropore diameter of <1 nm, especially 0.5–0.7 nm. Gil et al. believed that the micropore played a predominant role in toluene adsorption when toluene concentration was low.25 Moreover, the presence of mesopores was in a favor of the diffusion of VOC molecules and promoted adsorption capacity.26
3.2 Surface functional groups
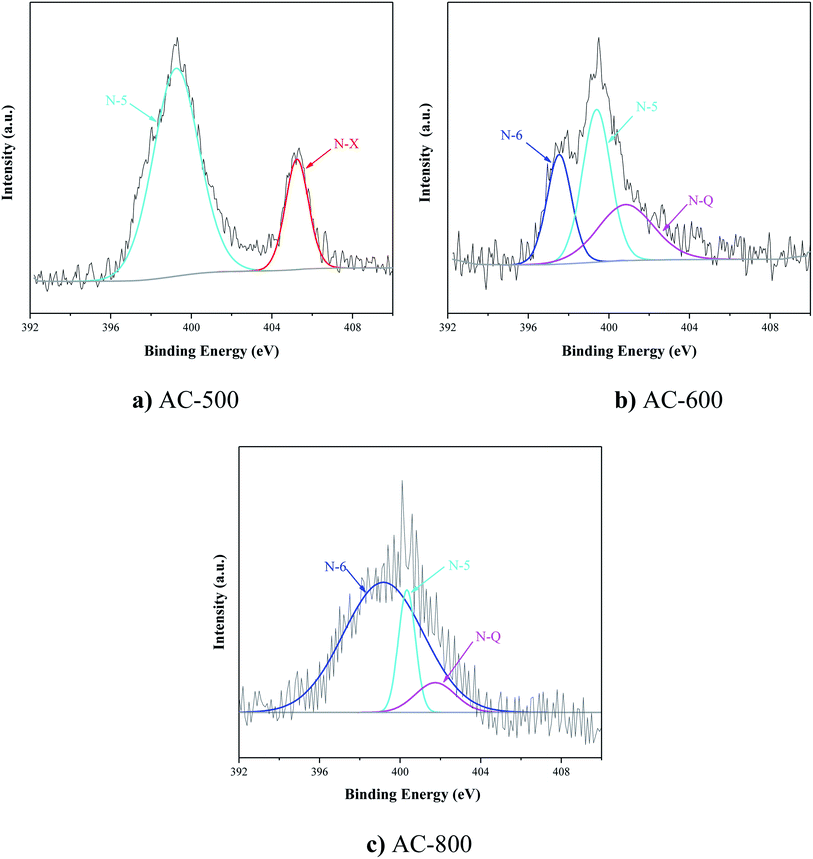
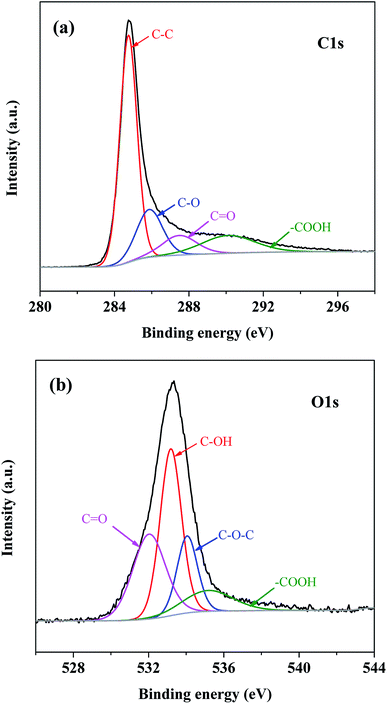
Fig. S3† and 1 show the surface functional groups identified by FTIR and XPS. In Fig. S3,† there was a broad peak at 3419 cm−1 assigned to C–H; its intensity increased with the enhancement of activated temperature. However, the high activated temperature had a negative effect on C–C and C–O groups located at 1560 and 1092 cm−1. Yang et al. reported that the removal of surface oxygen-containing functional groups could promote the adsorption capacity of VOCs. The existence of oxygen groups decreased the free electron density at the carbon basal plane and suppressed the interaction between toluene and π-electron adsorbents.27Moreover, the peaks of N 1s spectra at 398.1, 400.3, and 401.6 were regarded as pyridinic-N (N-6), pyrrolic-/pyridonic-N (N-5), and quaternary-N (N-Q). Fig. 1 and Table 1 reported that the increase of the activated temperature could accelerate the decomposition of N-containing functional groups and the formation of N-6 (Fig. 1b and c). The fraction of N-6 was not observed in Fig. 1a, and N-6 was the main component of N-containing functional groups in AC-800. Tehrani et al. reported there was an interaction between the π electron density of AC and N-containing functional groups; moreover, N-containing functional groups had an affinity for toluene, which was favorable for toluene adsorption.34 According to the fraction of N-containing functional groups and the binding energy of toluene on N-containing functional groups,13 pyridinic-N (N-6) contributed more to toluene adsorption for AC-800. Moreover, XPS spectra proved that there were O![[double bond, length as m-dash]](https://www.rsc.org/images/entities/char_e001.gif) C–OH, C–O, C
C–OH, C–O, C![[double bond, length as m-dash]](https://www.rsc.org/images/entities/char_e001.gif) O, C–OH, O–C
O, C–OH, O–C![[double bond, length as m-dash]](https://www.rsc.org/images/entities/char_e001.gif) O, and C–O–C oxygen containing functionalities on the AC-800 surface (Fig. 2).
O, and C–O–C oxygen containing functionalities on the AC-800 surface (Fig. 2).
3.3 Adsorption test
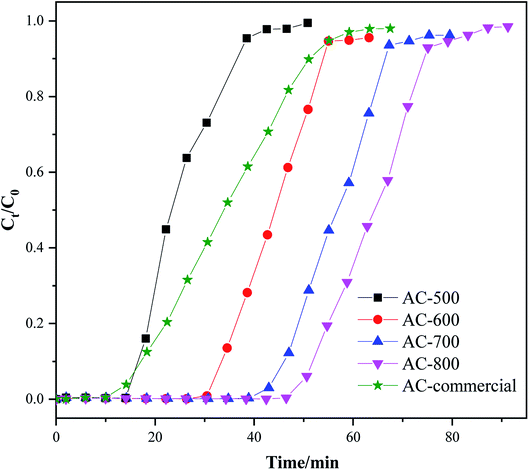
Fig. 3 shows the breakthrough curve of toluene. It shows that the breakthrough time of AC-x increased from 38 to 75 min when the activated temperature increased from 500 to 800 °C. Moreover, the adsorption capacity of toluene for AC-500, AC-600, AC-700, and AC-800 and a commercial AC derived from coconut shell was 205, 362, 462, 522, and 282 mg g−1, respectively. The above results agreed with the textural properties and surface functionalities. As described in Fig. S2† and Table 1, the enhancement of the activated temperature would increase the BET and total pore volume. Moreover, the ratio of micropore volume to the total pore volume decreased. In addition, the oxygen-containing functional groups easily decomposed under the high activated temperature. Thus, the above phenomena favored toluene adsorption. Table 2 compares the toluene adsorptive capacity of our prepared AC-800 with that of other ACs in the literature. Though AC prepared by Gil,25 Lillo-Ródenas,18 and Lei28 had higher toluene adsorptive capacity, the preparation of AC from the vegetable-tanned leather and petroleum waste would produce additional pollutants or increase the cost due to the addition of Cu. Moreover, the toluene adsorptive capacity of other ACs in Table 2 was lower than that of AC-800 prepared in our work.| Sorbent | Parameters | SBET, m2 g−1 | Adsorption capacity, mg g−1 | Breakthrough time, min | Reference | |
|---|---|---|---|---|---|---|
| 1 | Commercial AC | 10.0 g m−3, 50 ml min−1, 298 K | 934 | 41 | 100 | 29 |
| 2 | AC/MgO | 10.0 g m−3, 50 ml min−1, 298 K | 794 | 56 | 110 | 29 |
| 3 | AC/ZnO | 10.0 g m−3, 50 ml min−1, 298 K | 847 | 68 | 130 | 29 |
| 4 | AC/CuO | 10.0 g m−3, 50 ml min−1, 298 K | 769 | 46 | 130 | 29 |
| 5 | AC/ZrO2 | 10.0 g m−3, 50 ml min−1, 298 K | 837 | 127 | 120 | 29 |
| 6 | AC derived from vegetable-tanned leather | 100 ppm, 250 ml min−1, 293 ± 2 K | 2719 | 700 | 2500 | 25 |
| 7 | AC derived from sewage sludge | 100 ppm, 250 ml min−1, 293 ± 2 K | 990 | 350 | 1250 | 30 |
| 8 | Activated biochar derived from rice husk | 300 ppm, 30 ml min−1, 293 K | 1818 | 264 | 2784 | 24 |
| 9 | Biochar | 50 ml min−1, 293 K | 388 | 5.58–91.2 | 31 | |
| 10 | AC derived from anthracite | 200 ppm, 90 ml min−1, 298 K | 2746 | 640 | 630 | 18 |
| 11 | Commercial AC | 150 ppm, 6 L min−1, room temperature | 1067 | 104 | 204 | 32 |
| 12 | Commercial AC by acid treated | 150 ppm, 6 L min−1, room temperature | 840 | 123 | 240 | 32 |
| 13 | Carbon derived from coconut shell | 80 ppm, 2 L min−1, 303 K | 1137 | 44 | 97 | 33 |
| 14 | Commercial AC | 80 ppm, 2 L min−1, 303 K | 1011 | 32 | 91 | 33 |
| 15 | AC derived from corncob | 3000 mg m−3, 500 ml min−1, 298 K | 1501 | 414 | 70 | 26 |
| 16 | AC modified with Cu | 33![[thin space (1/6-em)]](https://www.rsc.org/images/entities/char_2009.gif) 803 mg m−3, 20 ml min−1, 293 K 803 mg m−3, 20 ml min−1, 293 K |
985.2 | 701.8 | 94 | 28 |
| 17 | AC derived from petroleum waste | 10%, 120 ml min−1, 298 K | 2692 | 659.9 | 65 | 34 |
| 18 | Activated coke | 190 ppm, 1000 ml min−1, 298 K | 534 | 254 | 25 | 35 |
| 19 | AC derived from lignocellulosic waste | 0.2 μl cm−3, batch reactor, 298 K | 1668 | 417 | 36 | |
| 20 | AC derived from lignin | 400 ppm, 30 ml min−1, 298 K | 1513 | 263.4 | 2195 | 37 |
| 21 | AC derived from coconut shell | 250 mg L−1, batch reactor, 303 K | 361 | 357 | 300 | 38 |
| 22 | AC derived from sugarcane bagasse | 1000 ppm, 100 ml min−1, 303 K | 1381 | 522 | 86 | This work |
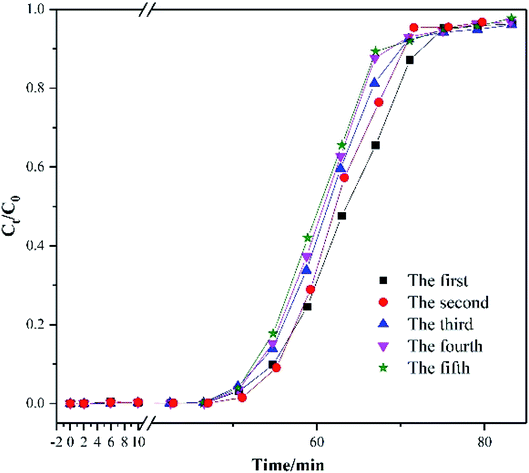
The desorption test was carried out to understand the regeneration temperature. In this experiment, the heating rate was 5 °C min−1. Moreover, toluene concentration of the effluent gas was analyzed by GC-7820 every 10 min. During the regeneration process, 100 ml min−1 nitrogen gas was fed to carry the released toluene. Fig. S4† reported that the peak of toluene concentration occurred at 130 °C. The boiling temperature of toluene was 110.6 °C. Moreover, toluene was adsorbed in the micropores, which would not vaporize unless the regeneration temperature was far higher than its boiling point. Hence, the regeneration temperature was determined as 130 °C in the cycle test. Fig. 4 shows the five consecutive toluene adsorption–desorption cycles of AC-800. The adsorption capacity of the five cycles was 522, 511, 508, 502 and 498 mg g−1, which decreased by 4.5% after five cycles. The primary reduction of the adsorption capacity occurred at the first cycle. Zhang et al. supposed that micropore blockage and incomplete desorption was attributed to the reduction of adsorption capacity.31 Moreover, the breakthrough time was not obviously reduced in the cycle test.
3.4 Morphology
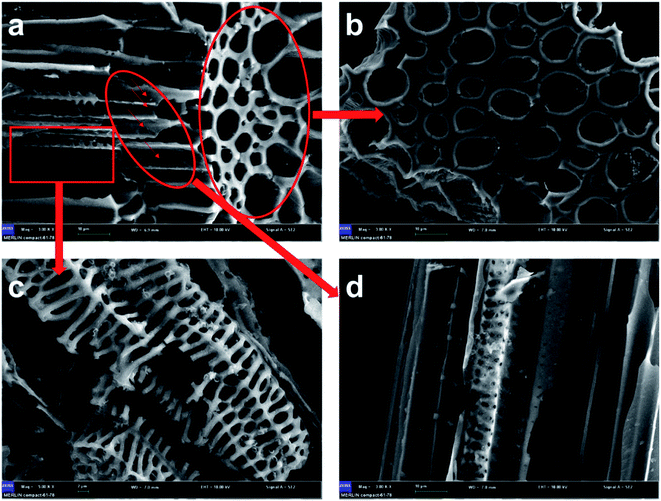
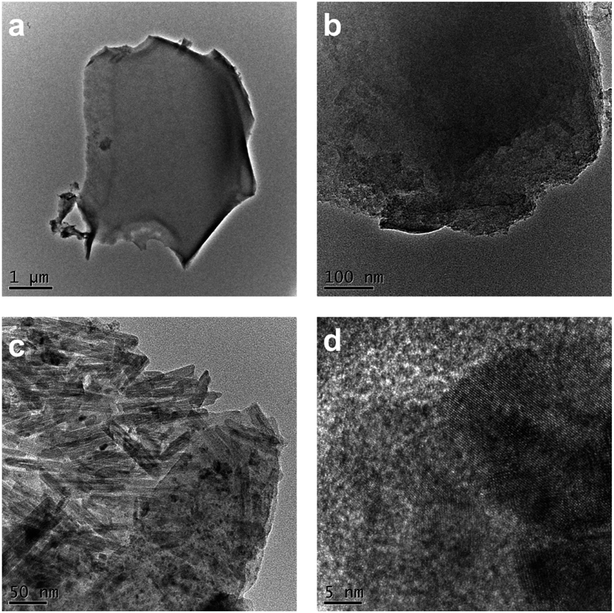
Fig. 5 shows the SEM images of AC-800. It was observed that there were three types of structures presented in AC-800, as shown in Fig. 5a. First, there was the vascular bundle structure along the stems of SB, which meant that the texture of SB was well preserved (Fig. 5b). Second, there was a porous structure resembling a skeleton as shown in the high magnification in Fig. 5c. Furthermore, a considerable amount of worm-like micropores were found in the vascular bundle due to the activation process. These worm-like micropores can be the active sites in adsorption of VOCs, as shown in the high-magnification images (Fig. 5d).Both TEM and HR-TEM images in Fig. 6 demonstrated the micropores were disordered and distributed. From Fig. 6a, the AC-800 existed in the form of bulky nanoparticles with diameters of ∼5 μm. Because of the etching of KOH during the activation process, many cracks appeared on the block and the mesoporous structure was finally generated (Fig. 6b). Notably, the nanorod-like fibers of SB were retained after activation, which can be clearly observed in Fig. 6c. In addition to TEM images, the microstructure of AC-800 was further examined by HR-TEM in higher magnification (Fig. 6d). The gray substrate was considered as the characteristics of graphitic carbon, and the disordered fringe pattern in the sample was attributed to the amorphous carbon.39 The XRD pattern in Fig. S5† proved that there was a broad peak at 23°, corresponding to the amorphous carbon (002), and a broad and weak peak at 43° assigned to the (100) plane of the graphitic carbon.29,40
3.5 Adsorption kinetics
The adsorption behavior was usually described using the kinetic model, and the adsorption mechanism was revealed through kinetic studies.28 In this work, quasi-first-order, quasi-second-order, Elovich and Bangham kinetic models were used to fit toluene adsorption data, and the models are detail described as follows.41,42(1) Pseudo-first order model
| qt = qe(1 − e−k1t) | (2) |
(2) Pseudo-second order model
 | (3) |
(3) Elovich model
 | (4) |
(4) Bangham model
 | (5) |
The parameters of the four models were summarized in Table 3. It was displayed that the correlation coefficients (R2) were <0.99 for all the models except for the Bangham model. Moreover, the theoretical adsorption capacity of the Bangham model was closer to the experimental adsorption capacity. Hence, it can be said that the Bangham model was the best model for describing toluene adsorption in AC-800. Moreover, toluene adsorption had two mechanisms: toluene adsorption at the surface of AC and toluene diffusion in the pores;28 moreover, toluene diffusion in the pores was the key factor affecting the adsorption rate.43
| Sample | Pseudo-first order model | Pseudo-second order model | Elovich | Bangham | ||||||||||
|---|---|---|---|---|---|---|---|---|---|---|---|---|---|---|
| k1/min−1 | R2 | qe/mg g−1 | k2/g mg−1 min−1 | R2 | qe/mg g−1 | α/mg g−1 min−1 | β/mg g−1 | R2 | qe/mg g−1 | k/min−1 | z | R2 | qe/mg g−1 | |
| AC-500 | 0.1343 | 0.948 | 207.1 | 9.89 × 10⁻⁵ | 0.916 | 269.5 | 25.535 | 3.97 × 10⁻³ | 0.967 | 206.6 | 7.57 × 10⁻³ | 1.743 | 0.998 | 208.36 |
| AC-600 | 0.0874 | 0.881 | 368.7 | 5.99 × 10⁻⁶ | 0.723 | 398.4 | 26.871 | 1.10 × 10⁻³ | 0.966 | 368.4 | 3.47 × 10⁻⁴ | 2.347 | 0.994 | 364.4 |
| AC-700 | 0.0737 | 0.869 | 468.9 | 2.69 × 10⁻⁶ | 0.665 | 516.4 | 27.918 | 7.34 × 10⁻⁴ | 0.953 | 470.5 | 1.31 × 10⁻⁴ | 2.477 | 0.994 | 468.8 |
| AC-800 | 0.0695 | 0.838 | 530.6 | 1.06 × 10⁻⁶ | 0.555 | 557.1 | 28.585 | 6.01 × 10⁻⁴ | 0.939 | 535.8 | 3.41 × 10⁻⁵ | 2.760 | 0.991 | 525.3 |
4. Conclusions
In this work, a series of N-doped activated carbons (AC) were prepared by carbonizing sugarcane bagasse modified with urea. Moreover, the adsorption mechanism was discussed on the basis of the experimental results and kinetic study. It was reported that BET and total pore volume increased when the activated temperature varied from 500 to 800 °C; moreover, the ratio of micropore volume to the total pore volume decreased from 0.88 to 0.80. The above results reported that the dynamic toluene adsorption capacity increased from 205 to 522 mg g−1, which was better than that of ACs in the literature. The five consecutive toluene adsorption–desorption cycles proved that AC-800 was an excellent adsorbent due to its high toluene stability and well regeneration. Moreover, the Bangham model was regarded as the best model of describing toluene adsorption on AC-800. Therefore, it was deduced that the toluene adsorption had two mechanisms: surface adsorption and diffusion in the pore; furthermore, the toluene diffusion in the pores was the key factor of affecting adsorption rate.Conflicts of interest
There are no conflicts to declare.Acknowledgements
This work is partly founded by National Natural Science Foundation of China (Grant No. 21906125), Major Special Science and Technology Project of Hubei Province (Grant No. 2019ACA157 & 2019AHB073 & 2019ZYYD060) and Excellent Young Scientific and Technological Innovation Team of Hubei Provincial Department of Education, China (T201902).References
- National Bureau of Statistics, China Statistical Yearbook, China Statistics Press, Beijing, 2018 Search PubMed.
- J. Zhang, X. Chen, X. Liang, Y. Ke, L. Fan and D. Ye, Scenario analyses of the volatile organic compound emission allowance and allocation in the 13th five-year period, Environ. Sci., 2018, 39, 3544–3551 Search PubMed.
- M. Ouzzine, A. J. Romero-Anaya, M. A. Lillo-Ródenas and A. Linares-Solano, Spherical activated carbons for the adsorption of a real multicomponent VOC mixture, Carbon, 2019, 148, 214–223 CrossRef CAS.
- G. R. Wentworth, Y.-a. Aklilu, M. S. Landis and Y.-M. Hsu, Impacts of a large boreal wildfire on ground level atmospheric concentrations of PAHs, VOCs and ozone, Atmos. Environ., 2018, 178, 19–30 CrossRef CAS PubMed.
- K. Rahbar Shamskar, A. Rashidi, P. Aberoomand Azar, M. Yousefi and S. Baniyaghoob, Synthesis of graphene by in situ catalytic chemical vapor deposition of reed as a carbon source for VOC adsorption, Environ. Sci. Pollut. Res., 2019, 26, 3643–3650 CrossRef CAS PubMed.
- W. Zou, B. Gao, Y. S. Ok and L. Dong, Integrated adsorption and photocatalytic degradation of volatile organic compounds (VOCs) using carbon-based nanocomposites: a critical review, Chemosphere, 2019, 218, 845–859 CrossRef CAS PubMed.
- B. Belaissaoui, Y. Le Moullec and E. Favre, Energy efficiency of a hybrid membrane/condensation process for VOC (Volatile Organic Compounds) recovery from air: a generic approach, Energy, 2016, 95, 291–302 CrossRef CAS.
- Y. Wang, D. Yang, S. Li, L. Zhang, G. Zheng and L. Guo, Layered copper manganese oxide for the efficient catalytic CO and VOCs oxidation, Chem. Eng. J., 2019, 357, 258–268 CrossRef CAS.
- S. Yi and Y. Wan, Volatile organic compounds (VOCs) recovery from aqueous solutions via pervaporation with vinyltriethoxysilane-grafted-silicalite-1/polydimethylsiloxane mixed matrix membrane, Chem. Eng. J., 2017, 313, 1639–1646 CrossRef CAS.
- M. Tomatis, M. T. Moreira, H. Xu, W. Deng, J. He and A. M. Parvez, Removal of VOCs from waste gases using various thermal oxidizers: a comparative study based on life cycle assessment and cost analysis in China, J. Clean. Prod., 2019, 233, 808–818 CrossRef CAS.
- S. Zhang, J. You, C. Kennes, Z. Cheng, J. Ye, D. Chen, J. Chen and L. Wang, Current advances of VOCs degradation by bioelectrochemical systems: a review, Chem. Eng. J., 2018, 334, 2625–2637 CrossRef CAS.
- Y. An, Q. Fu, D. Zhang, Y. Wang and Z. Tang, Performance evaluation of activated carbon with different pore sizes and functional groups for VOC adsorption by molecular simulation, Chemosphere, 2019, 227, 9–16 CrossRef CAS PubMed.
- S. Cheng, Y. Qiao, J. Huang, W. Wang, Z. Wang, Y. Yu and M. Xu, Effects of Ca and Na acetates on nitrogen transformation during sewage sludge pyrolysis, Proc. Combust. Inst., 2019, 37, 2715–2722 CrossRef CAS.
- J. Han, L. Zhang, B. Zhao, L. Qin, Y. Wang and F. Xing, The N-doped activated carbon derived from sugarcane bagasse for CO2 adsorption, Ind. Crops Prod., 2019, 128, 290–297 CrossRef CAS.
- X. Zhang, B. Gao, A. E. Creamer, C. Cao and Y. Li, Adsorption of VOCs onto engineered carbon materials: a review, J. Hazard. Mater., 2017, 338, 102–123 CrossRef CAS PubMed.
- J. Huang, Y. Qiao, X. Wei, J. Zhou, Y. Yu and M. Xu, Effect of torrefaction on steam gasification of starchy food waste, Fuel, 2019, 253, 1556–1564 CrossRef CAS.
- C. Yang, G. Miao, Y. Pi, Q. Xia, J. Wu, Z. Li and J. Xiao, Abatement of various types of VOCs by adsorption/catalytic oxidation: a review, Chem. Eng. J., 2019, 370, 1128–1153 CrossRef CAS.
- M. A. Lillo-Ródenas, D. Cazorla-Amorós and A. Linares-Solano, Behaviour of activated carbons with different pore size distributions and surface oxygen groups for benzene and toluene adsorption at low concentrations, Carbon, 2005, 43, 1758–1767 CrossRef.
- T. García, R. Murillo, D. Cazorla-Amorós, A. M. Mastral and A. Linares-Solano, Role of the activated carbon surface chemistry in the adsorption of phenanthrene, Carbon, 2004, 42, 1683–1689 CrossRef.
- L. Li, S. Liu and J. Liu, Surface modification of coconut shell based activated carbon for the improvement of hydrophobic VOC removal, J. Hazard. Mater., 2011, 192, 683–690 CrossRef CAS PubMed.
- L. Chai, L. Zhang, X. Wang, L. Xu, C. Han, T.-T. Li, Y. Hu, J. Qian and S. Huang, Bottom-up synthesis of MOF-derived hollow N-doped carbon materials for enhanced ORR performance, Carbon, 2019, 146, 248–256 CrossRef CAS.
- X. Wang, Z. Ma, L. Chai, L. Xu, Z. Zhu, Y. Hu, J. Qian and S. Huang, MOF derived N-doped carbon coated CoP particle/carbon nanotube composite for efficient oxygen evolution reaction, Carbon, 2019, 141, 643–651 CrossRef CAS.
- J. Qian, X. Wang, L. Chai, L.-F. Liang, T.-T. Li, Y. Hu and S. Huang, Robust Cage-Based Zinc–Organic Frameworks Derived Dual-Doped Carbon Materials for Supercapacitor, Cryst. Growth Des., 2018, 18, 2358–2364 CrossRef CAS.
- Y. Shen and N. Zhang, Facile synthesis of porous carbons from silica-rich rice husk char for volatile organic compounds (VOCs) sorption, Bioresour. Technol., 2019, 282, 294–300 CrossRef CAS PubMed.
- R. R. Gil, B. Ruiz, M. S. Lozano, M. J. Martín and E. Fuente, VOCs removal by adsorption onto activated carbons from biocollagenic wastes of vegetable tanning, Chem. Eng. J., 2014, 245, 80–88 CrossRef CAS.
- J. Zhu, Y. Li, L. Xu and Z. Liu, Removal of toluene from waste gas by adsorption-desorption process using corncob-based activated carbons as adsorbents, Ecotoxicol. Environ. Saf., 2018, 165, 115–125 CrossRef CAS PubMed.
- X. Yang, H. Yi, X. Tang, S. Zhao, Z. Yang, Y. Ma, T. Feng and X. Cui, Behaviors and kinetics of toluene adsorption-desorption on activated carbons with varying pore structure, J. Environ. Sci., 2018, 67, 104–114 CrossRef PubMed.
- B. Lei, B. Liu, H. Zhang, L. Yan, H. Xie and G. Zhou, CuO-modified activated carbon for the improvement of toluene removal in air, J. Environ. Sci., 2020, 88, 122–132 CrossRef PubMed.
- K. Zhou, W. Ma, Z. Zeng, X. Ma, X. Xu, Y. Guo, H. Li and L. Li, Experimental and DFT study on the adsorption of VOCs on activated carbon/metal oxides composites, Chem. Eng. J., 2019, 372, 1122–1133 CrossRef CAS.
- A. Anfruns, M. J. Martin and M. A. Montes-Morán, Removal of odourous VOCs using sludge-based adsorbents, Chem. Eng. J., 2011, 166, 1022–1031 CrossRef CAS.
- X. Zhang, B. Gao, Y. Zheng, X. Hu, A. E. Creamer, M. D. Annable and Y. Li, Biochar for volatile organic compound (VOC) removal: sorption performance and governing mechanisms, Bioresour. Technol., 2017, 245, 606–614 CrossRef CAS PubMed.
- S.-H. Pak, M.-J. Jeon and Y.-W. Jeon, Study of sulfuric acid treatment of activated carbon used to enhance mixed VOC removal, Int. Biodeterior. Biodegrad., 2016, 113, 195–200 CrossRef CAS.
- X. Zhao, X. Zeng, Y. Qin, X. Li, T. Zhu and X. Tang, An experimental and theoretical study of the adsorption removal of toluene and chlorobenzene on coconut shell derived carbon, Chemosphere, 2018, 206, 285–292 CrossRef CAS PubMed.
- N. H. M. Hossein Tehrani, M. S. Alivand, A. Rashidi, K. Rahbar Shamskar, M. Samipoorgiri, M. D. Esrafili, D. Mohammady Maklavany and M. Shafiei-Alavijeh, Preparation and characterization of a new waste-derived mesoporous carbon structure for ultrahigh adsorption of benzene and toluene at ambient conditions, J. Hazard. Mater., 2020, 384, 121317 CrossRef CAS PubMed.
- Z. Qie, Z. Zhang, F. Sun, L. Wang, X. Pi, J. Gao and G. Zhao, Effect of pore hierarchy and pore size on the combined adsorption of SO2 and toluene in activated coke, Fuel, 2019, 257, 116090 CrossRef CAS.
- E. Santos-Clotas, A. Cabrera-Codony, B. Ruiz, E. Fuente and M. J. Martín, Sewage biogas efficient purification by means of lignocellulosic waste-based activated carbons, Bioresour. Technol., 2019, 275, 207–215 CrossRef CAS PubMed.
- N. Zhang and Y. Shen, One-step pyrolysis of lignin and polyvinyl chloride for synthesis of porous carbon and its application for toluene sorption, Bioresour. Technol., 2019, 284, 325–332 CrossRef CAS PubMed.
- J. Mohammed, N. S. Nasri, M. A. Ahmad Zaini, U. D. Hamza and F. N. Ani, Adsorption of benzene and toluene onto KOH activated coconut shell based carbon treated with NH3, Int. Biodeterior. Biodegrad., 2015, 102, 245–255 CrossRef CAS.
- A. Pophali, K.-M. Lee, L. Zhang, Y.-C. Chuang, L. Ehm, M. A. Cuiffo, G. P. Halada, M. Rafailovich, N. Verma and T. Kim, First synthesis of poly(furfuryl) alcohol precursor-based porous carbon beads as an efficient adsorbent for volatile organic compounds, Chem. Eng. J., 2019, 373, 365–374 CrossRef CAS.
- X. Ma, L. Li, R. Chen, C. Wang, K. Zhou and H. Li, Porous carbon materials based on biomass for acetone adsorption: effect of surface chemistry and porous structure, Appl. Surf. Sci., 2018, 459, 657–664 CrossRef CAS.
- L. Tang, L. Li, R. Chen, C. Wang, W. Ma and X. Ma, Adsorption of acetone and isopropanol on organic acid modified activated carbons, J. Environ. Chem. Eng., 2016, 4, 2045–2051 CrossRef CAS.
- X. Zhang, B. Gao, J. Fang, W. Zou, L. Dong, C. Cao, J. Zhang, Y. Li and H. Wang, Chemically activated hydrochar as an effective adsorbent for volatile organic compounds (VOCs), Chemosphere, 2019, 218, 680–686 CrossRef CAS PubMed.
- H. Gong, W. Liu, L. Liu, N. Goyal, P. Xiao, G. Li, Y. Wei and T. Du, In-situ synthesis of an excellent CO2 capture material chabazite, J. Taiwan Inst. Chem. Eng., 2019, 103, 160–166 CrossRef CAS.
Footnote |
| † Electronic supplementary information (ESI) available. See DOI: 10.1039/d0ra02225j |
| This journal is © The Royal Society of Chemistry 2020 |

