DOI:
10.1039/D0RA01821J
(Paper)
RSC Adv., 2020,
10, 22468-22479
Fire and explosion hazards of 1-ethyl-3-methylimidazolium bis(trifluoromethylsulfonyl)imide
Received
26th February 2020
, Accepted 20th May 2020
First published on 11th June 2020
Abstract
Ionic liquids (ILs) have very low volatility and are consequently considered as a green replacement to the organic solvents that have been widely used to date. The fire and explosion hazards of traditional organic solvents primarily depend on the combustibility of their vapors; therefore, ILs have been regarded as nonflammable for a long time because of their low volatility. However, recent studies have shown that ILs are flammable due to their thermal stability and consequently, the fire and explosion hazards of ILs limit their practical applications. The compound 1-ethyl-3-methylimidazolium bis(trifluoromethylsulfonyl)imide (abbreviated as [EMIM][Tf2N]) has been considered a potential candidate solvent for surfactant systems, but studies about the fire and explosion hazards of this IL are rare in the literature. In this study, the fire and explosion hazards of [EMIM][Tf2N] were explored in terms of different aspects. The auto-ignition temperature of [EMIM][Tf2N] was found to be 478 °C with an ignition delay time of 12.6 s. It was observed with the TGA/DSC system that the decomposition of [EMIM][Tf2N] was endothermic in a nitrogen atmosphere but exothermic in an air atmosphere. The dynamic TGA curves showed that the apparent activation energies were the same in both nitrogen and air atmospheres, but the dynamic DSC curves showed that the apparent activation energies were different in nitrogen and air atmospheres. The apparent activation energy inferred from the DSC curve in an air atmosphere was found to be the same as the apparent activation energy estimated by the Semenov theory of thermal ignition. Analysis of the gaseous decomposition products of [EMIM][Tf2N] by the TGA-FTIR system indicated that the exothermal effect in the air atmosphere was caused by the auto-ignition of acetylene (which is one of the gaseous decomposition products) and not by decomposition itself.
Introduction
The fire and explosion hazards of a liquid are usually divided into two categories: flammability and reactivity. Flash point (FP) is used to evaluate the flammability hazards of liquid solvents in most countries. For example, according to Taiwan's local regulations, liquids with FP below 65 °C are classified as flammable liquids. The FP of a liquid is defined as the temperature determined by testing at which the liquid emits enough vapor to form a combustible mixture with air.1 In order to evaluate the reactivity hazard of a chemical substance, one needs to know the onset temperature of its decomposition reaction and the associated thermal effects.2 For example, guidance on the application of the classification, labelling and packaging (CLP) criteria in Europe states that if a substance contains chemical groups related to explosive properties but its exothermic decomposition energy is less than 500 J g−1 and the onset of exothermic decomposition is below 500 °C, then, it should not be considered as an explosive substance.3
Because ionic liquids (ILs) have thermal stability and extremely low volatility, they are considered potential green alternatives to replace the currently widely used organic solvents. It is obviously difficult for a liquid with low volatility to emit sufficient vapors to form a combustible mixture with air; therefore, it is considered safer than a liquid with high volatility. Based on this viewpoint, ILs have been considered non-flammable for a long time.4,5 However, the study by Fox et al. indicated that the fire and explosion hazards of ILs are better understood beyond conventional hazard rating methods.6 Liaw et al. pointed out that the flammability hazards of some ILs will increase when exposed to high temperatures.7 Liu et al. demonstrated that the flammability of imidazolium nitrate is caused by combustible decomposition products.8–11 Fox et al. suggested that a single flammability index, such as FP, cannot thoroughly describe the flammability hazards of ILs and pointed out that the thermal effects have a significant impact on assessing the flammability hazards of ILs. They concluded that it would be more appropriate to describe ILs as having a low or deduced flammability hazard, rather than identifying them as nonflammable materials.12 Liaw et al. showed that the FP of ILs is mainly related to the decomposition of ILs, not the vaporization of ILs.13 Diallo et al. suggested that when assessing the fire hazards of ILs, both the heat of combustion and the heat release rate should be considered; they also pointed out that saying ILs are inherently safe is inappropriate.14 Chen et al. reported the auto-ignition temperature of some ionic liquids according to the ASTM E659 test method.15 Chen et al. reported that the thermal effect of the decomposition of IL 1-methyl-1-propylpyrrolidinium bis(trifluoromethanesulfonyl)imide and 1-decyl-3-methylimidazolium bis(trifluoromethylsulfonyl)imide were completely different in nitrogen and air atmospheres.16,17 Recently, flammability has been considered to be one of the designable characteristics of ionic liquids.18–20
The IL 1-ethyl-3-methylimidazolium bis(trifluoromethylsulfonyl)imide (abbreviated as [EMIM][Tf2N]) is considered a potential candidate solvent for surfactant systems. Therefore, the thermodynamic properties of [EMIM][Tf2N] have been extensively studied in the literature, and it has been reported that the vapor pressure of this IL is very low at room temperature.21–24 As earlier mentioned, the fact of having a low vapor pressure does not mean that this IL is free of fire and explosion hazards, yet the fire and explosion hazards of [EMIM][Tf2N] have been rarely reported in the literature. Therefore this study aimed to investigate the fire and explosion hazards of [EMIM][Tf2N] via auto-ignition temperature (AIT) tests, the simultaneous application of thermogravimetry and differential scanning calorimetry (TGA/DSC), and by thermogravimetric analysis coupled with Fourier transformed infrared spectrometry (TGA-FTIR).
Experimental section
Materials
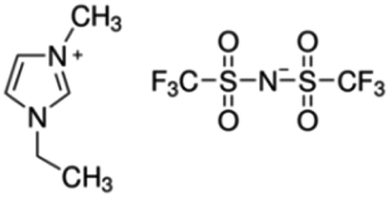
The detailed chemical information of [EMIM][Tf2N], including its formula, CAS number, and molecular structure, are listed in Table 1. The ILs used in all the test runs were commercial materials manufactured by the io-li-tec company with a guaranteed mass purity of at least 99%.
Table 1 Chemical information for [EMIM][Tf2N]
| Chemical name |
Formula |
CAS No. |
Abbreviation |
Structural formula |
| 1-Ethyl-3-methylimidazolium bis(trifluoromethylsulfonyl)imide |
C8H11F6N3O4S2 |
174899-82-2 |
[EMIM][Tf2N] |
 |
Auto-ignition temperature tests
The AIT of [EMIM][Tf2N] was measured by using a K47000 auto-ignition apparatus (Koehler Instrument Company, Inc.). The design of this auto-ignition temperature tester satisfied the requirements of the ASTM E659-78 (2005) standard test method.25 Details of the procedures for conducting the AIT experiments can be found in our earlier works.26–28
Thermogravimetry and differential scanning calorimetry (TGA/DSC)
The thermal stability of [EMIM][Tf2N] was determined by using a TGA/DSC 1 instrument (Mettler Toledo Instruments, Inc.). Approximately 1.0–3.0 mg samples were placed in 70 μL aluminium oxides pans, and then heated from 30 to 600 °C with a heating rate of 10 °C min−1. In order to compare the thermal effects of decomposition in different atmospheres, the tests were carried out under nitrogen and air atmospheres, respectively, with a purge gas flow rate of 50 mL min−1. The aforementioned test procedures met the requirements of the ASTM E537-12 standard test method, except that ASTM E537-12 requires the samples to be heated from 25 °C to 600 °C.29 In this work, all the tests were repeated three times and the onset temperature and thermal effects were reported based on the average of these three repeated measurements.
Thermogravimetric analysis coupled with Fourier transformed infrared spectrometry (TGA-FTIR)
The evolved gases generated by the decomposition of [EMIM][Tf2N] were continuously analyzed by the TGA/SDTA851 system (Mettler Toledo Instruments, Inc.) connected with a Thermo Nicolet iS™ 10 FTIR instrument (Thermo Fisher Scientific Inc.). All the TGA/SDTA851 test settings, such as heating rate and purge gas flow rate, were the same as those described in the TGA/DSC experiments. The FTIR spectrometer was set to transmission mode with a wave number resolution of 0.5 cm−1.
Results and discussion
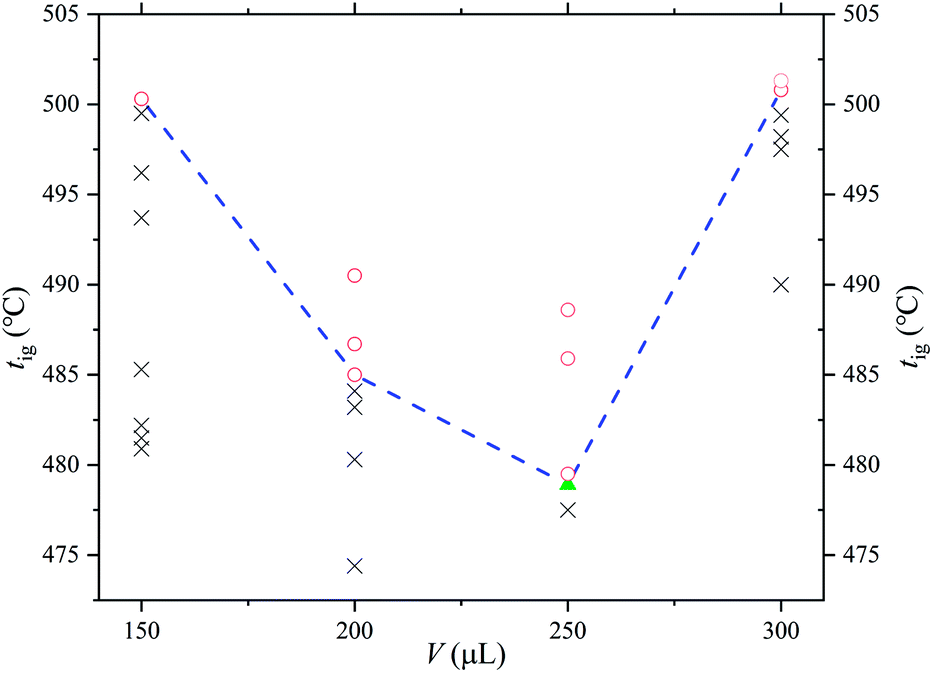
The combustion plot of [EMIM][Tf2N] is shown in Fig. 1, where the x-axis is the sample quantities added into the ignition container and the y-axis is the preheated temperature of the ignition container. The flammable condition is indicated by a circle in Fig. 1, which means that a hot flame could be observed within 10 min after the sample was introduced into the ignition container. In the flammable case, the temperature of the ignition container and the ignition delay time were recorded. If the test sample did not ignite within 10 min or produced only a cold flame within 10 min, the condition was considered non-flammable and is indicated by a cross in the figure. After that, the preheating temperature of the ignition container was intentionally changed to find the lowest temperature that could generate a hot flame under the specified sample amount. It should be noted that this lowest preheating temperature depended on the amount of sample introduced into the ignition container. By definition, the lowest of these lowest preheating temperatures was the AIT of [EMIM][Tf2N]. In the figure, a triangle mark is used to indicate the situation of AIT. The AIT measurement of [EMIM][Tf2N] was 478 ± 23.9 °C and the corresponding ignition delay time was 12.6 s.
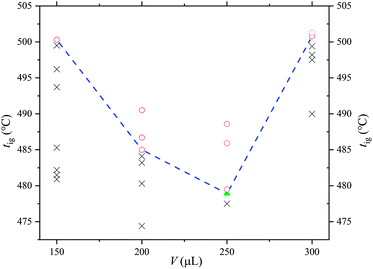 |
| | Fig. 1 Combustion plot of [EMIM][Tf2N]. Ignition temperature (tig) is the temperature of the ignition container and the sample volume (V) is the amount of sample introduced into the ignition container: circle, flammable case; cross, nonflammable case; triangle, the case of AIT. | |
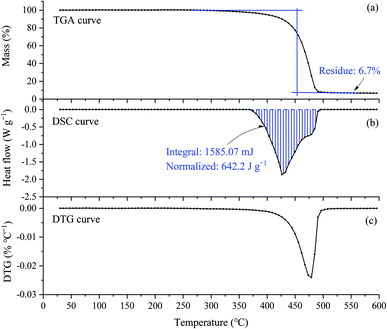
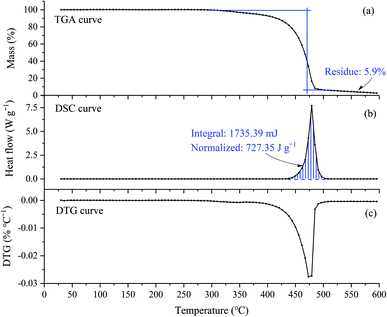
The onset temperatures (T0), estimated onset temperatures (Te), and the endset temperatures (Tend) are important characteristics in both TGA and DSC curves. However, the numerical values obtained from TGA and DSC curves are slightly different because the sensitivity in measuring sample weight loss and heat released are different. The heat effect (ΔH) of the sample can be obtained from the DSC curve, and the TGA curve also gives the weight percentage of the residue in the heating process. Table 2 summarizes the above characteristics of [EMIM][Tf2N] in the nitrogen and air atmospheres. As mentioned earlier, all the test runs for this study were repeated 3 times, so the values in Table 2 are the average of three replicates, and the associated uncertainty for each value is based on twice the standard deviation of the three repeated tests. Fig. 2 and 3 show the experimental results in the nitrogen and air atmospheres, respectively. However, for simplicity, only one of the three TGA/DSC curves is shown in these figures.
Table 2 Thermal data of [EMIM][Tf2N] in different gas atmospheres from the TGA/DSC curvesa
| Atmosphere |
DSC curve |
TGA curve |
| T0 (°C) |
Te (°C) |
Tend (°C) |
ΔH (J g−1) |
T0 (°C) |
Te (°C) |
Tend (°C) |
Residue (%) |
| T0: onset temperature; Te: estimated onset temperature; Tend: endset temperature; ΔH: heat effects. |
| Nitrogen |
366 ± 12.5 |
398 ± 7.9 |
489 ± 1.4 |
642 ± 25 |
305 ± 4.7 |
449 ± 1.4 |
485 ± 1.8 |
7 ± 2.6 |
| Air |
436 ± 6.2 |
466 ± 1.8 |
486 ± 3.6 |
−762 ± 53 |
310 ± 38.4 |
452 ± 9.6 |
482 ± 6.4 |
6 ± 1.5 |
 |
| | Fig. 2 TGA/DSC/DTG curves of [EMIM][Tf2N] in the nitrogen atmosphere. Sample weight was 2.468 mg. Plot (a) is the TGA curve, plot (b) is the DSC curve and plot (c) is the DTG curve. In all plots, the x-axis is the temperature (°C) of the reference crucible. The y-axes of the TGA, DSC, and DTG curves are the percentage of sample remaining in the test crucible (%), the heat flux compensation (J per sec) per gram of sample, and the time differential of the sample weight (1 per min). | |
 |
| | Fig. 3 TGA/DSC/DTG curves of [EMIM][Tf2N] in air atmosphere. Sample weight was 2.386 mg. Plot (a) is the TGA curve, plot (b) is the DSC curve, and plot (c) is the DTG curve. The x-axis in all plots is the temperature (°C) of the reference crucible, and the y-axes are the sample percentage (%) remaining in the test crucible, the heat flux compensated (J per sec) per gram of sample, and the differential of the sample weight for the TGA, DSC, and DTG curves, respectively. | |
As shown in Fig. 2(a), in the nitrogen atmosphere, [EMIM][Tf2N] started to lose weight near 300 °C, and the rate of weight loss became fast at about 450 °C. Finally, the weight loss stopped near 490 °C, leaving 6.7% of the residue. The DSC curve, Fig. 2(b), shows that [EMIM][Tf2N] started to absorb heat near 360 °C, and stopped absorbing heat around 490 °C. It can also be clearly seen from this figure that the decomposition process was endothermic with a heat of 642.2 J per g per sample. Clearly, the DTG curve in Fig. 2(c) is a unimodal curve, indicating that only one decomposition mechanism occurred during this heating process.
In the air atmosphere, the main characteristics of both the TGA and DTG curves, as shown in Fig. 3(a) and (c), were very similar to those curves in the nitrogen atmosphere, but as shown in Fig. 3(b), the DSC curve was exothermic in the air atmosphere, but was endothermic in the nitrogen atmosphere. From Fig. 3(b), the DSC curve started to appear exothermic at about 440 °C and stopped at about 490 °C. The heat emitted was 727.35 J per g per sample. This exothermic behavior can be explained in two different ways: (1) the decomposition mechanism of [EMIM][Tf2N] is different in nitrogen and air atmospheres; (2) the decomposition mechanism is the same, but in air atmosphere, the gaseous decomposition products were ignited by the temperature of the testing crucible.
The rate of sample weight loss is different in different reaction mechanisms, therefore the DTG curve is one of the methods often used to evaluate the possible reaction mechanism because it shows the relationship between the rate of sample weight loss and the temperature. As shown in Fig. 2(c) and 3(c), in nitrogen and air atmospheres, the DTG curves were very similar, which means that the decomposition mechanism of [EMIM][Tf2N] in these two atmospheres was the same. Therefore, it seems reasonable to say that the heat observed in the air atmosphere was caused by auto-ignition of the gaseous decomposition products of [EMIM][Tf2N]. We further verify this argument in subsequent paragraphs.
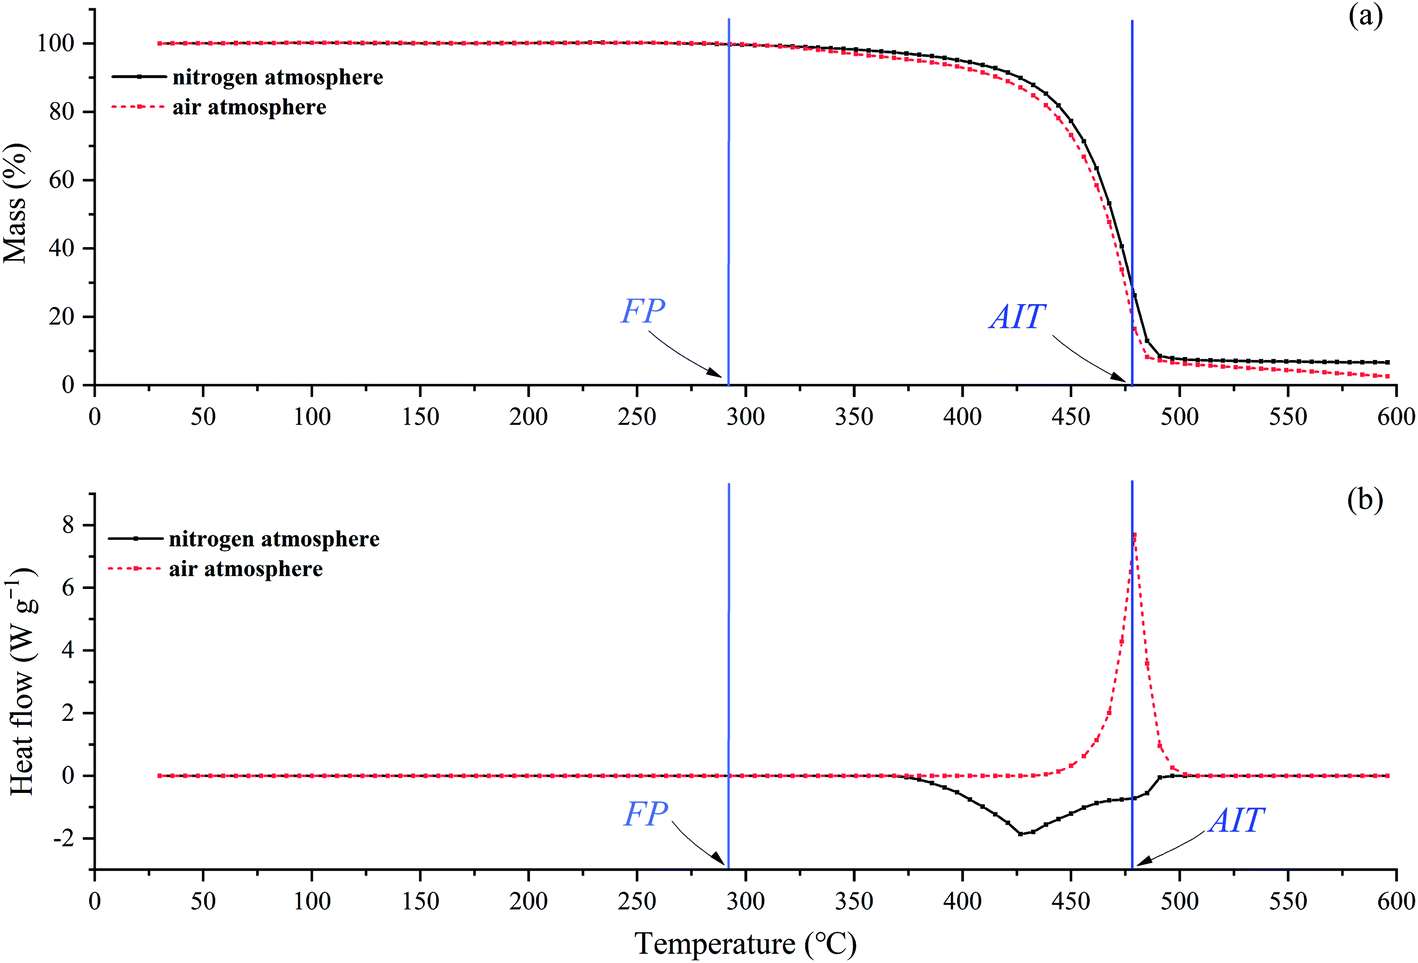
In order to verify whether the observed heat in the air atmosphere is related to the auto-ignition of gaseous decomposition products, Fig. 4 compares the TGA/DSC curves of [EMIM][Tf2N] in the nitrogen and air atmospheres. As shown in Fig. 4(a), the TGA curve in the air atmosphere was almost the same as the TGA curve in the nitrogen atmosphere, which indicates the decomposition mechanism of [EMIM][Tf2N] in these two atmospheres should be the same. The measured FP and AIT of [EMIM][Tf2N] are also indicated in Fig. 4. The measured value of FP for [EMIM][Tf2N] was obtained from Chen's study and the reported temperature was 292.3 °C.30 As can be seen from Fig. 4(a), the FP fell approximately near the onset temperature of the TGA curve, while the AIT was close to the temperature at which the sample stopped losing weight. As can be seen from Fig. 4(b), the DSC curve was very different in the nitrogen and air atmospheres, whereby the former was endothermic and the latter was exothermic. It can also be seen from Fig. 4(b) that in the air atmosphere, the emitted heat was observed at a temperature much higher than the FP and the AIT was near the temperature at which the intensity of the emitted heat was the maximum. It can also be seen from Fig. 4(b) that in the air atmosphere, the temperature at which the exothermic phenomenon was observed was much higher than the FP, and the AIT was close to the temperature at which the heat dissipation rate was the maximum.
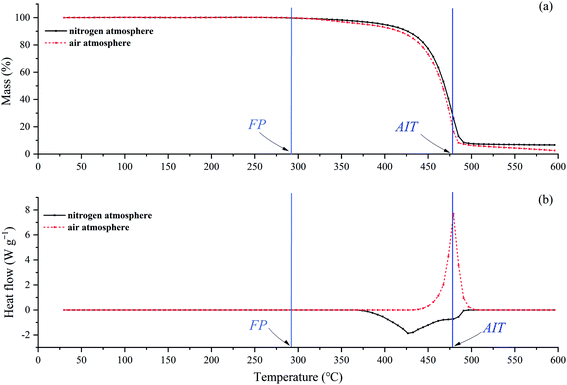 |
| | Fig. 4 TGA/DSC curves of [EMIM][Tf2N] in nitrogen and air atmospheres compared with its flash point and auto-ignition temperature. Plot (a) is the TGA curve and plot (b) is the DSC curve. Dashed line: in air atmosphere; solid line: in nitrogen atmosphere. Flash point: 292.3 °C; auto-ignition temperature: 478 °C. | |
In summary, in the air atmosphere the exothermic phenomenon was observed at the temperature much higher than the FP, and the exothermic phenomenon occurred at the temperature near the AIT of [EMIM][Tf2N]. It should be noted here that the combustion at the FP is ignited by external sparks, but the combustion at the AIT is ignited by ambient temperature. Without external sparks, no exothermic phenomenon was observed at the FP. For the DSC experiments, the ambient temperature was the temperature of the sample crucible. Therefore, these observations support the exothermic phenomenon observed in the air atmosphere being due to the auto-ignition of the gaseous products generated by the decomposition of [EMIM][Tf2N].
The apparent activation energy (Ea) is one of the most important characteristics of a reaction mechanism, so it is also one of the possible indicators that can be used to distinguish whether the emitted heat observed in the air atmosphere comes from the decomposition of [EMIM][Tf2N] or from combustion of the decomposition products. As we pointed out earlier, [EMIM][Tf2N] had the same thermal decomposition mechanism in nitrogen and air atmospheres, and the heat observed in the air atmosphere should come from the combustion of the decomposition products. Therefore, the Ea obtained from the TGA curve should be consistent in different atmospheres, but the Ea obtained from the DSC curve should be distinct in different atmospheres because in the nitrogen atmosphere it means decomposition while in the air atmosphere it means combustion.
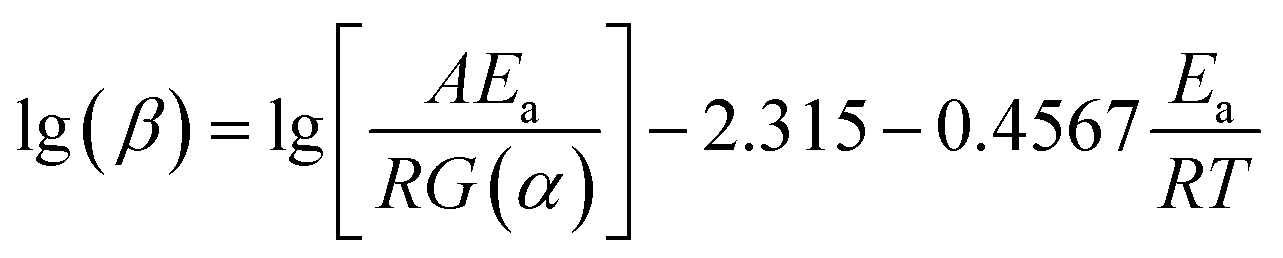
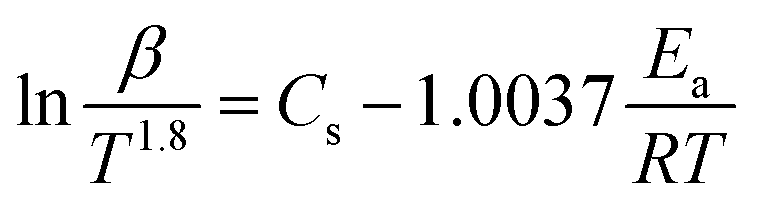
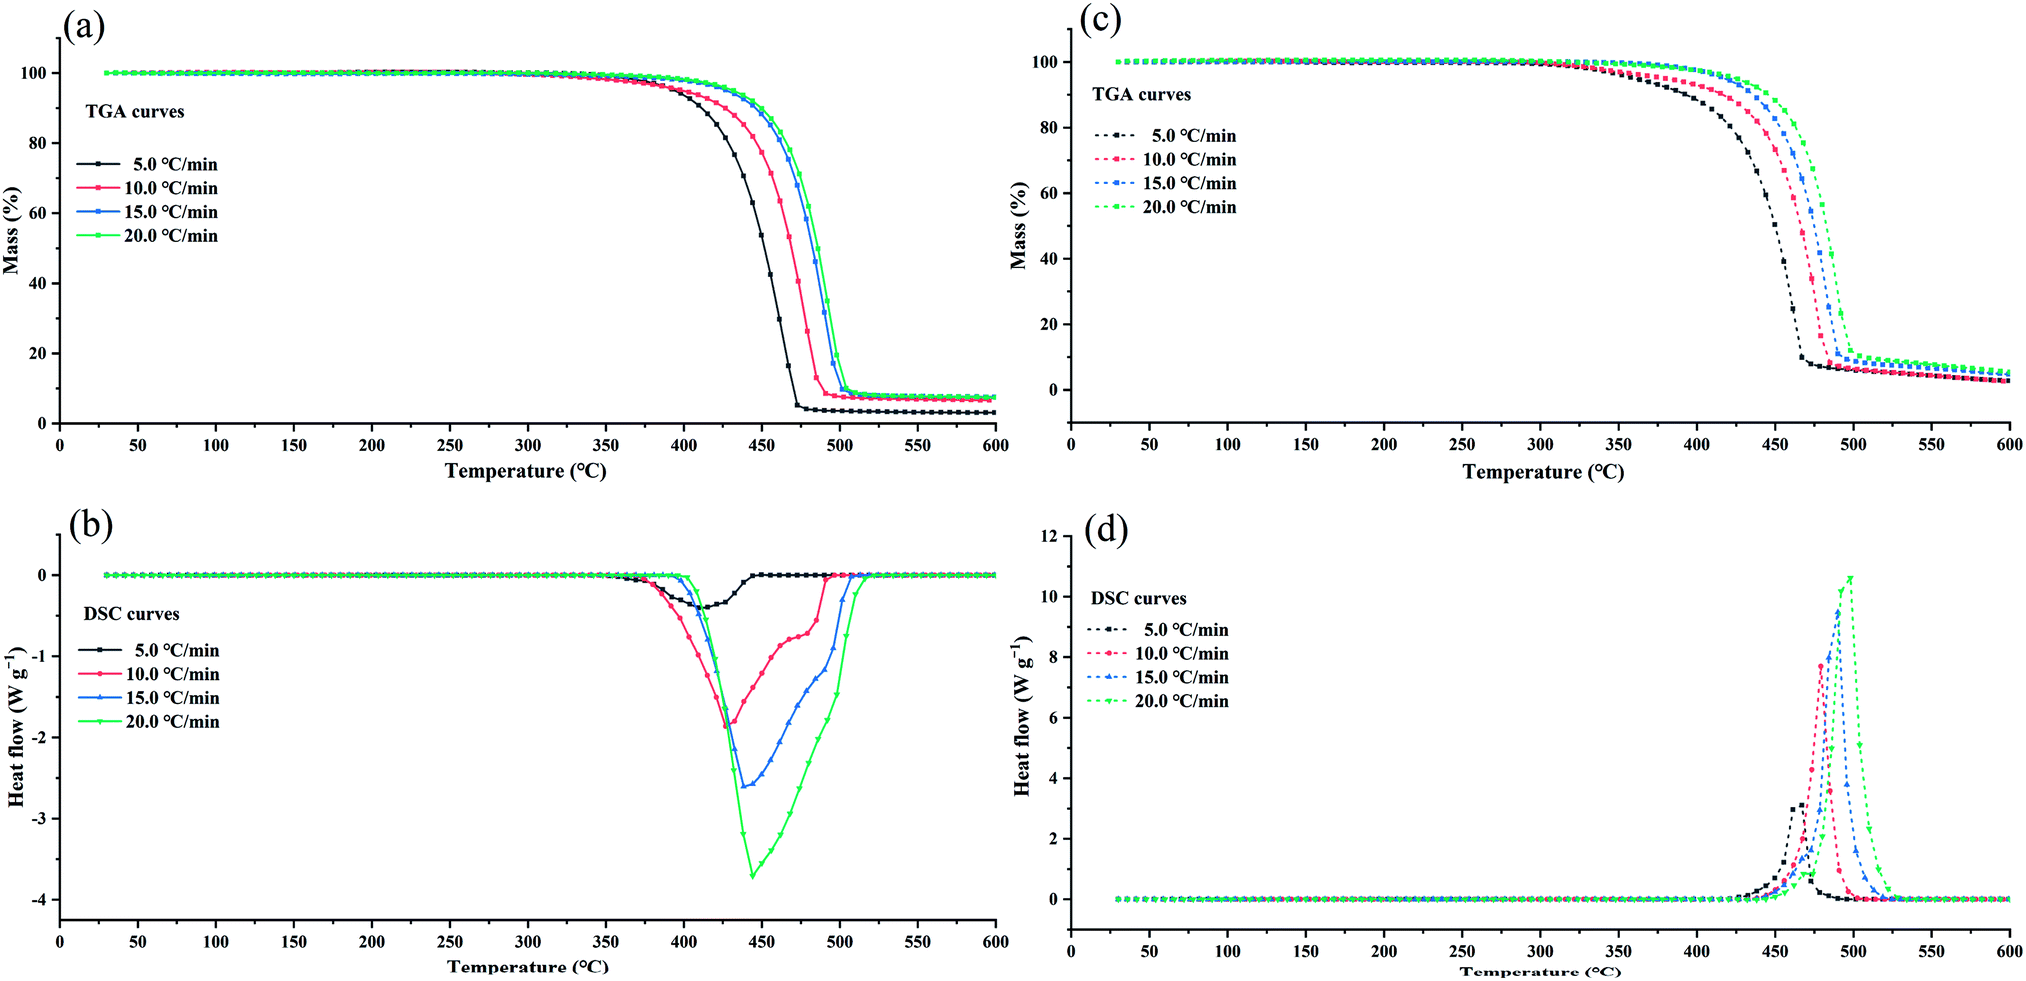
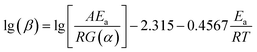
To verify this viewpoint, TGA/DSC experiments at different heating rates (5, 10, 15, and 20 °C min−1) were conducted. In the dynamic test runs, the air/nitrogen flow rates were 50 mL min−1. The dynamic TGA/DSC curves conducted in the nitrogen atmosphere and in the air atmosphere are shown Fig. 5. For the TGA curves, two model-free methods, the Flynn–Wall–Ozawa (FWO) method and the Starink method, were adopted to calculate the Ea of thermal decomposition.31,32 For the DSC curves in the air atmosphere, the ASTM E698 method was used to calculate Ea,33 and the equation can be shown as follows:
| |
 | (1) |
| |
 | (2) |
| |
 | (3) |
where
β is the heating rate,
G(
α) is the integral mechanism function,
A is the pre-exponential factor,
R is the molar gas constant (8.314 J mol
−1 K
−1),
Cs is a constant, and
Tp is the peak temperature.
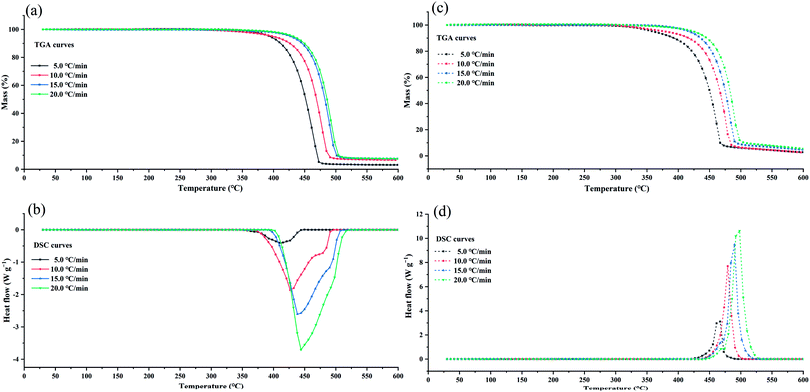 |
| | Fig. 5 TGA/DSC curves for different heating rates of [EMIM][Tf2N] in nitrogen/air atmospheres. Plot (a) is the TGA curves in nitrogen atmosphere, plot (b) is the DSC curves in nitrogen atmosphere, plot (c) is the TGA curves in air atmosphere, plot (d) is the DSC curves in air atmosphere. | |
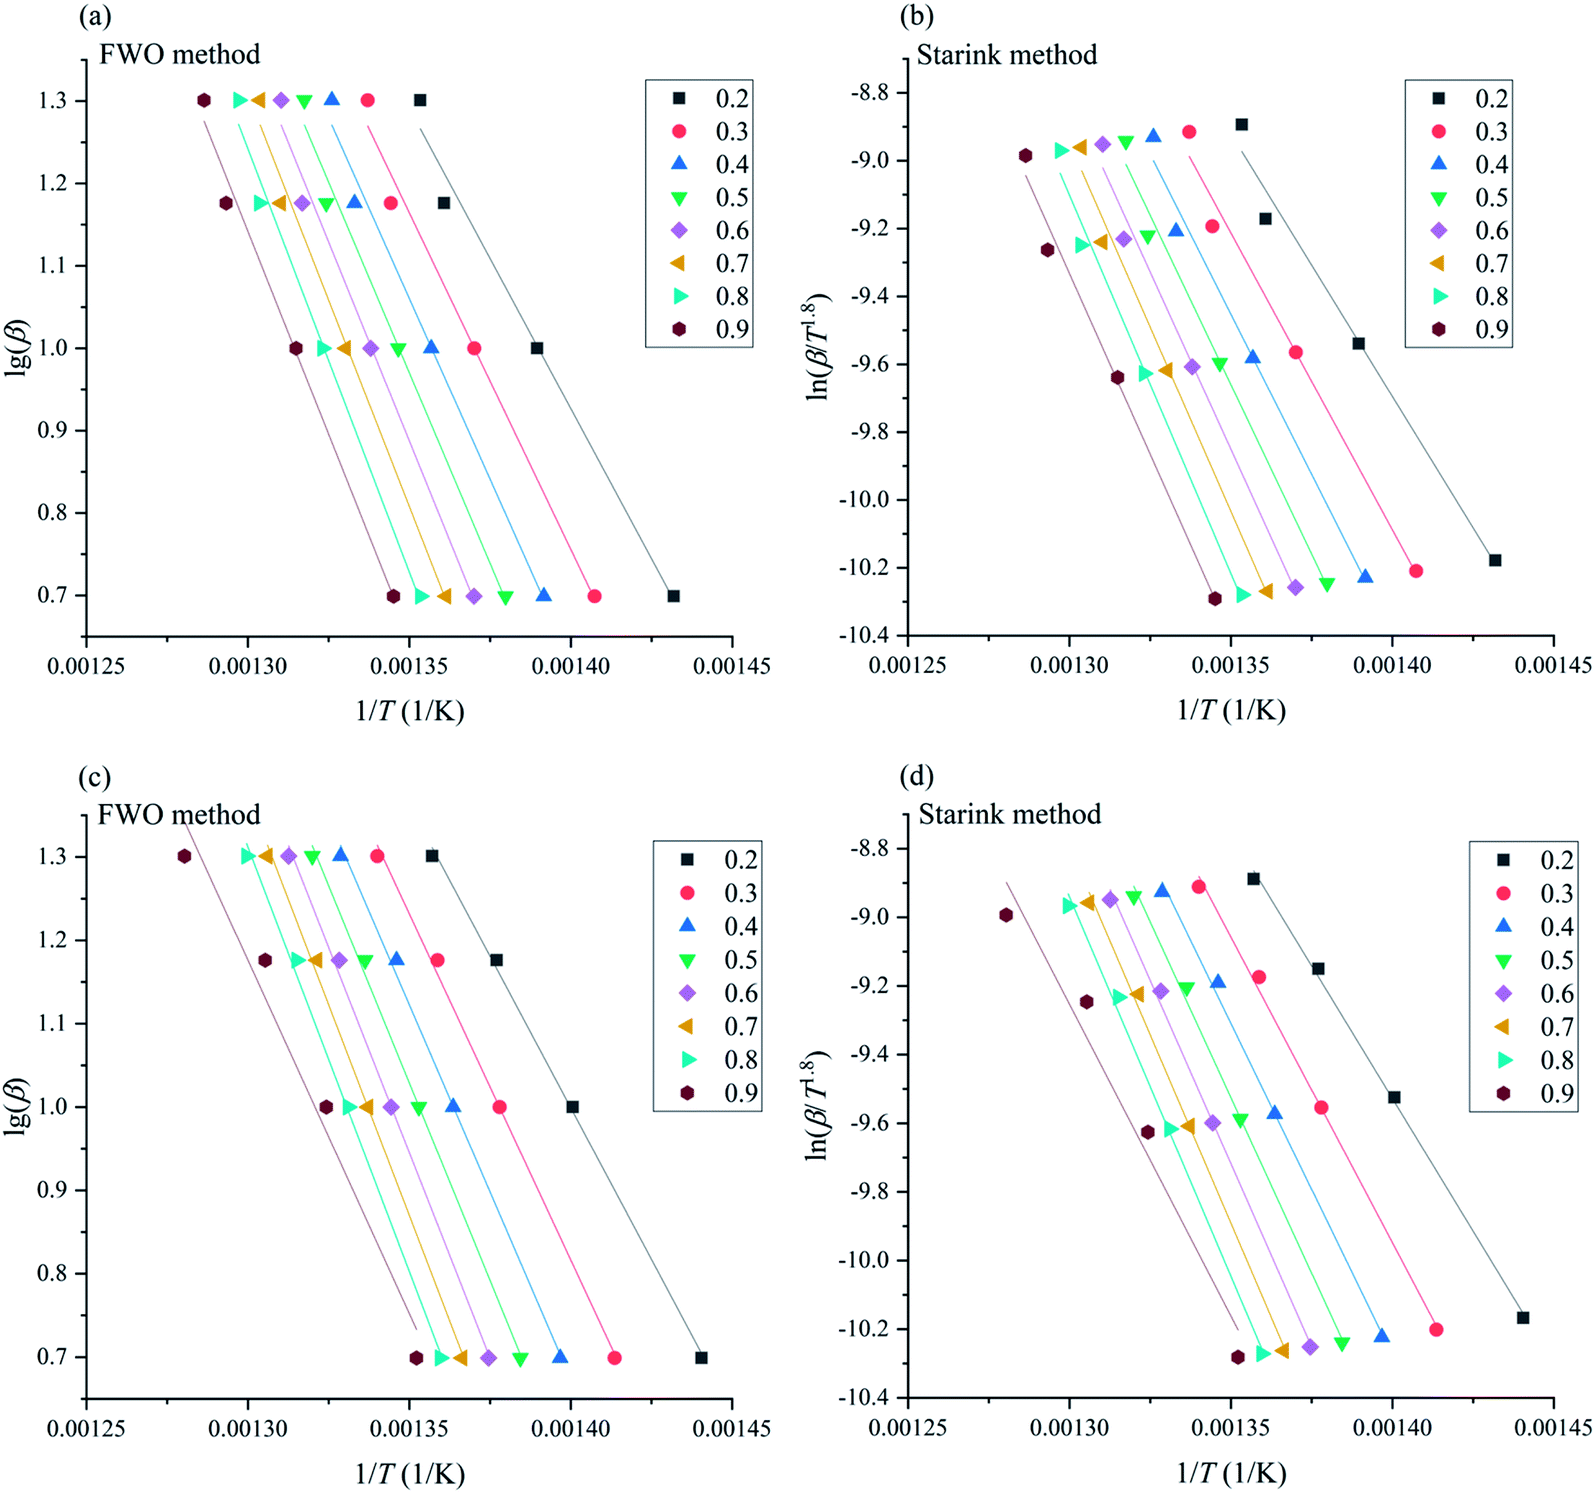
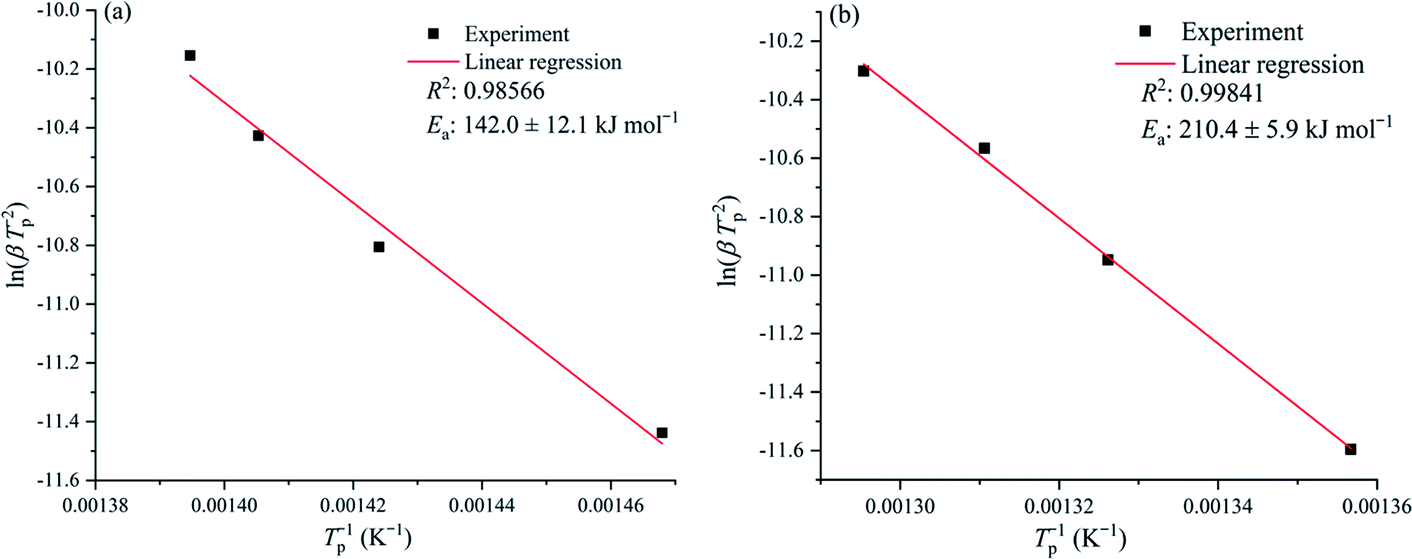
The plotting curves of lg(β) vs. 1/T for the FWO method and ln(β![[thin space (1/6-em)]](https://www.rsc.org/images/entities/char_2009.gif) T−1.8) vs. 1/T for the Starink method are shown in Fig. 6, and the plotted curves of ln(βTp−2) vs. 1/Tp for ASTM E698 method are shown in Fig. 7. It can be seen that there was a good linear relationship between various methods. The Ea values obtained by the TGA curves in the nitrogen atmosphere were 166.7 ± 11.7 and 161.9 ± 12.2 kJ mol−1 for the FWO and Starink methods, respectively. In the air atmosphere, the Ea values were 165.2 ± 6.6 and 163.9 ± 6.0 kJ mol−1 for the FWO and Starink methods, respectively. Clearly, the Ea calculated by the Starink method and the FWO method were consistent in each atmosphere. In addition, the calculated Ea was almost the same in the nitrogen and air atmospheres. The value of Ea obtained by the ASTM E698 method based on the heat release behavior (DSC curves) in the nitrogen atmosphere was 142.0 ± 12.1 kJ mol−1. While considering the experimental uncertainty, this result is consistent with the two model-free methods described above. This result supports the idea that the endothermic peak in the DSC curve was caused by the thermal decomposition of [EMIM][Tf2N]. However, the Ea value obtained by the ASTM E698 method in the air atmosphere was significantly different (i.e., 210.4 ± 5.9 kJ mol−1), which means the exothermic peak in the DSC curves may be caused by the combustion of gaseous decomposition products rather than by thermal decomposition.
T−1.8) vs. 1/T for the Starink method are shown in Fig. 6, and the plotted curves of ln(βTp−2) vs. 1/Tp for ASTM E698 method are shown in Fig. 7. It can be seen that there was a good linear relationship between various methods. The Ea values obtained by the TGA curves in the nitrogen atmosphere were 166.7 ± 11.7 and 161.9 ± 12.2 kJ mol−1 for the FWO and Starink methods, respectively. In the air atmosphere, the Ea values were 165.2 ± 6.6 and 163.9 ± 6.0 kJ mol−1 for the FWO and Starink methods, respectively. Clearly, the Ea calculated by the Starink method and the FWO method were consistent in each atmosphere. In addition, the calculated Ea was almost the same in the nitrogen and air atmospheres. The value of Ea obtained by the ASTM E698 method based on the heat release behavior (DSC curves) in the nitrogen atmosphere was 142.0 ± 12.1 kJ mol−1. While considering the experimental uncertainty, this result is consistent with the two model-free methods described above. This result supports the idea that the endothermic peak in the DSC curve was caused by the thermal decomposition of [EMIM][Tf2N]. However, the Ea value obtained by the ASTM E698 method in the air atmosphere was significantly different (i.e., 210.4 ± 5.9 kJ mol−1), which means the exothermic peak in the DSC curves may be caused by the combustion of gaseous decomposition products rather than by thermal decomposition.
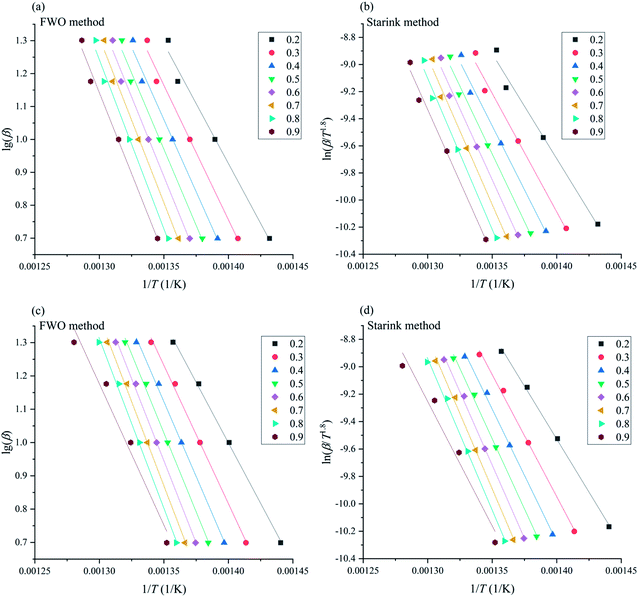 |
| | Fig. 6 Linear curves obtained by FWO and Starink methods. Plots (a) and (b) are the linear curves at different conversion rates obtained by the FWO and Starink methods according to the TGA curves in nitrogen atmosphere, respectively; plots (c) and (d) are the linear curves at different conversion rates obtained by the FWO and Starink methods according to the TGA curves in air atmosphere respectively. | |
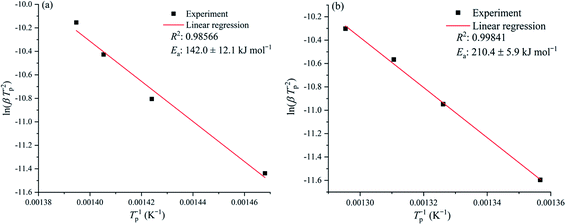 |
| | Fig. 7 Linear curves obtained by the ASTM E698 method based on the DSC curves in (a) nitrogen atmosphere and (b) in air atmosphere. In all, plots the x-axis is the reciprocal of the peak temperature (K−1), and the y-axis is the logarithm of the ratio of the heating rate to the square of the corresponding peak temperature. | |
In order to understand whether the Ea obtained by the ASTM E698 method in the air atmosphere was from combustion, auto-ignition temperature tests for different amounts of samples were performed, and the Semenov theory of thermal ignition was used to resolve the Ea of combustion. The simplified equation of the Semenov theory of thermal ignition is shown as follows:34
| |
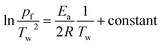 | (4) |
where
Tw is the surrounding temperature, and
pf is the pressure corresponding to the self-ignition condition. As shown in
Fig. 8, the
Ea of combustion was calculated to be 234.7 ± 36.7 kJ mol
−1 with a sound linear relationship. It could be found that the value of
Ea obtained by the Semenov theory of thermal ignition was close to the value calculated according to the ASTM E698 method based on the DSC curves in the air atmosphere (
i.e., 210.4 ± 5.9 kJ mol
−1). Therefore, the exothermic peak in the air atmosphere was caused by combustion of the gaseous decomposition products.
 |
| | Fig. 8 Linear curves obtained by the Semenov theory of thermal ignition based on the data from the auto-ignition temperature tests. Tw is the surrounding temperature provided by the auto-ignition temperature tester, pf is the pressure corresponding to the self-ignition condition. | |
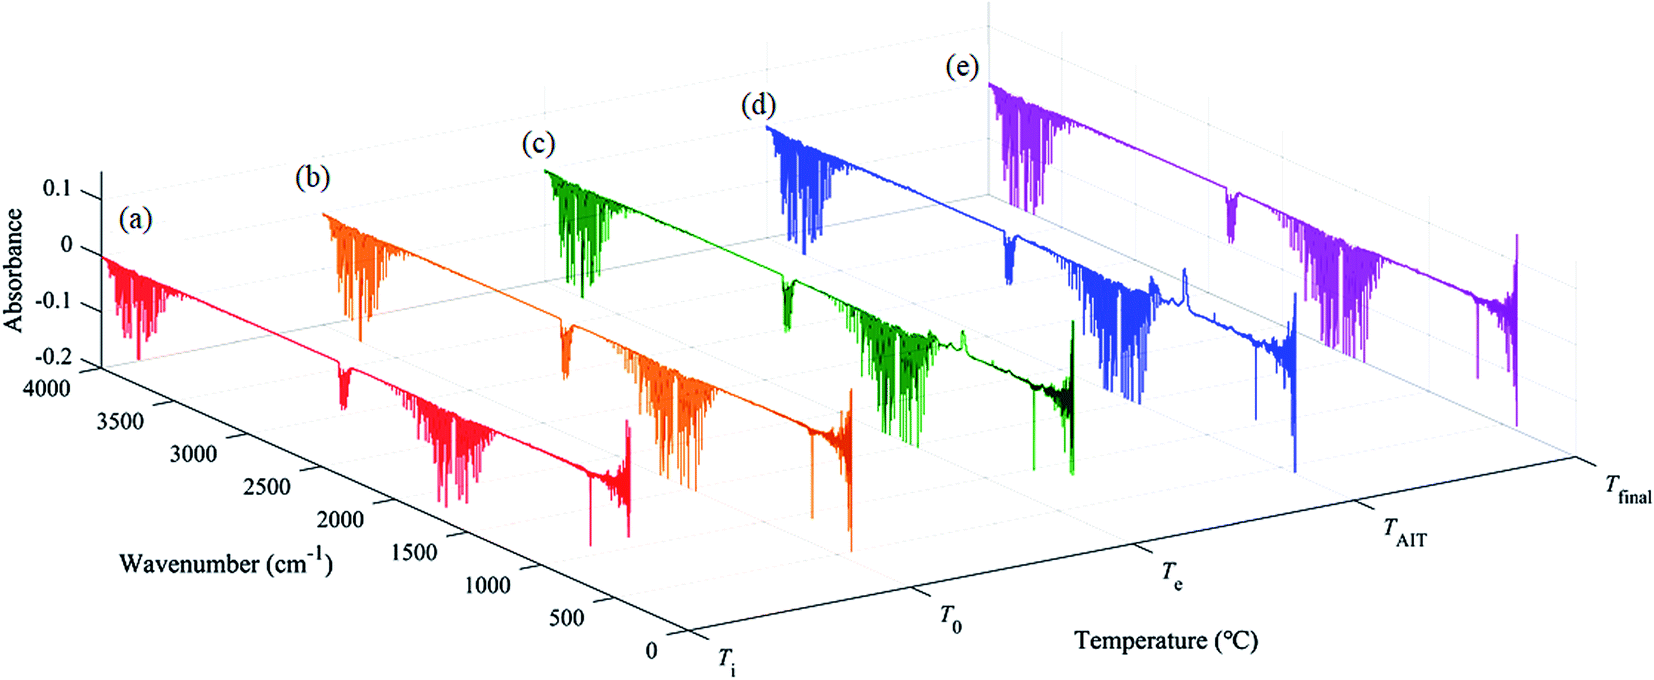
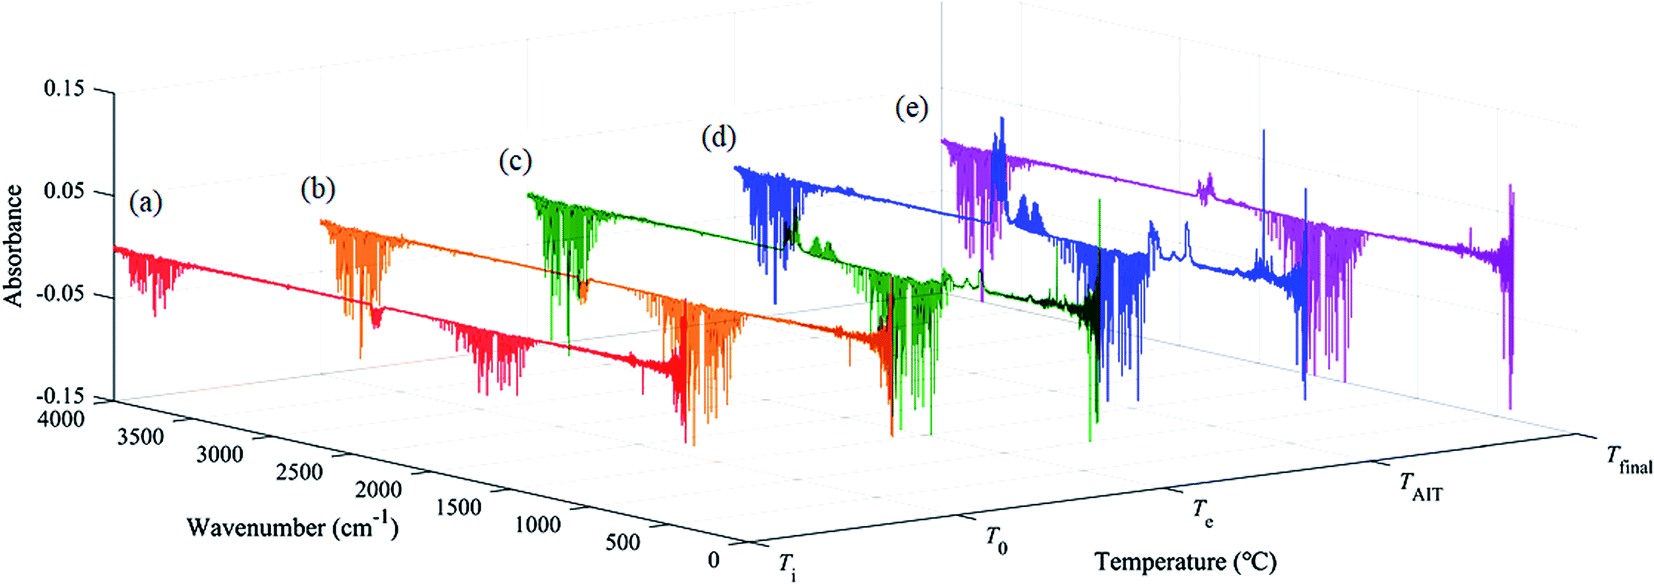
However, there was still some controversy: the measured AIT of [EMIM][Tf2N] was 478 °C, but the exothermal phenomenon begins at a temperature near 440 °C, which is about 40 °C lower than the measured AIT of [EMIM][Tf2N]. This observation indicates that combustion occurred before the temperature reached the measured AIT. Therefore, the evolved gas was collected and identified using the TGA-FTIR system to understand the gaseous products of [EMIM][Tf2N] decomposition. In order to observe the trend of the FTIR spectra during heating, the FTIR spectra were recorded at different temperatures. In each TGA-FTIR test run, the FTIR spectra were recorded at the following temperatures: (a) the beginning of the test run, that is, ambient temperature (Ti); (b) the onset temperature of the TGA curve (T0); (c) the estimated onset temperature of the TGA curve (Te); (d) the auto-ignition temperature of [EMIM][Tf2N] (TAIT), and (e) the temperature right at the termination of the TGA run (Tfinal). Table 3 summarizes the exact values of the above temperatures for both the nitrogen and air atmospheres. However, it should be noted here that the FTIR instrument takes approximately 2 min to complete the spectral scan, and hence the temperature recorded here should be considered as the representative temperature within the scan interval, not the actual temperature at which the scanned spectrum occurs.
Table 3 Temperatures selected to record the FTIR spectra
| Gas atmosphere |
Beginning of test, Ti/°C |
Onset temperature, T0/°C |
Estimated onset temperature, Te/°C |
Auto-ignition temperature TAIT/°C |
End of test, Tfinal/°C |
| Nitrogen |
30 |
315 |
459 |
478 |
600 |
| Air |
30 |
320 |
462 |
478 |
600 |
The FTIR spectra of the evolved gases released by the decomposition of [EMIM][Tf2N] in the nitrogen atmosphere and air atmosphere are shown in Fig. 9 and 10, respectively. In the nitrogen atmosphere, as shown in Fig. 9, some tiny peaks located around the wave numbers 1150 cm−1 and 1300–1400 cm−1 appear at temperature Te. At temperature TAIT, the aforementioned peaks become stronger and peaks located around the wave number 2300 cm−1 also appear. Finally all the peaks disappear at temperature Tfinal. The details of all the aforementioned identified peaks are discussed later. In the air atmosphere, as shown in Fig. 10, the FTIR spectra basically show the same trend as those in the nitrogen atmosphere, but the following difference could be observed: (1) at temperature Te, peaks at the wave number 2300 cm−1 could be observed; (2) at temperature Te, weak double peaks located around the wave number at 2150 cm−1 could be observed, which become clear at temperature TAIT; (3) at temperature TAIT, new peaks located around the wave number 1230 cm−1 are also observed. Therefore, it can be reasonably concluded that the substances observed in the evolved gas are different in the nitrogen atmosphere compared to in the air atmosphere.
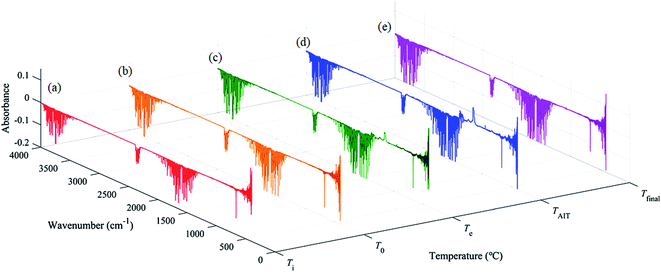 |
| | Fig. 9 FTIR spectra of the evolved gas for [EMIM][Tf2N] heated in nitrogen atmosphere. The wave numbers ranged from 400–4000 cm−1. The FTIR spectra were collected at five different temperatures: (a) ambient temperature (Ti); (b) onset temperature (T0); (c) estimated onset temperature (Te) from TGA curve; (d) auto-ignition temperature (TAIT); (e) temperature at the termination of the test (Tfinal). | |
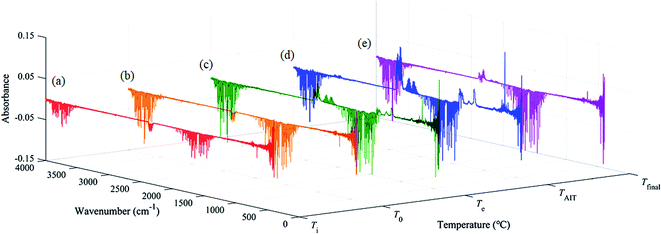 |
| | Fig. 10 FTIR spectra of the evolved gas of [EMIM][Tf2N] in air atmosphere. The wave numbers ranged from 400–4000 cm−1. The FTIR spectra were collected at five different temperatures: (a) ambient temperature (Ti); (b) onset temperature (T0); (c) estimated onset temperature (Te) from TGA curve; (d) auto-ignition temperature (TAIT); (e) temperature at the termination of test (Tfinal). | |
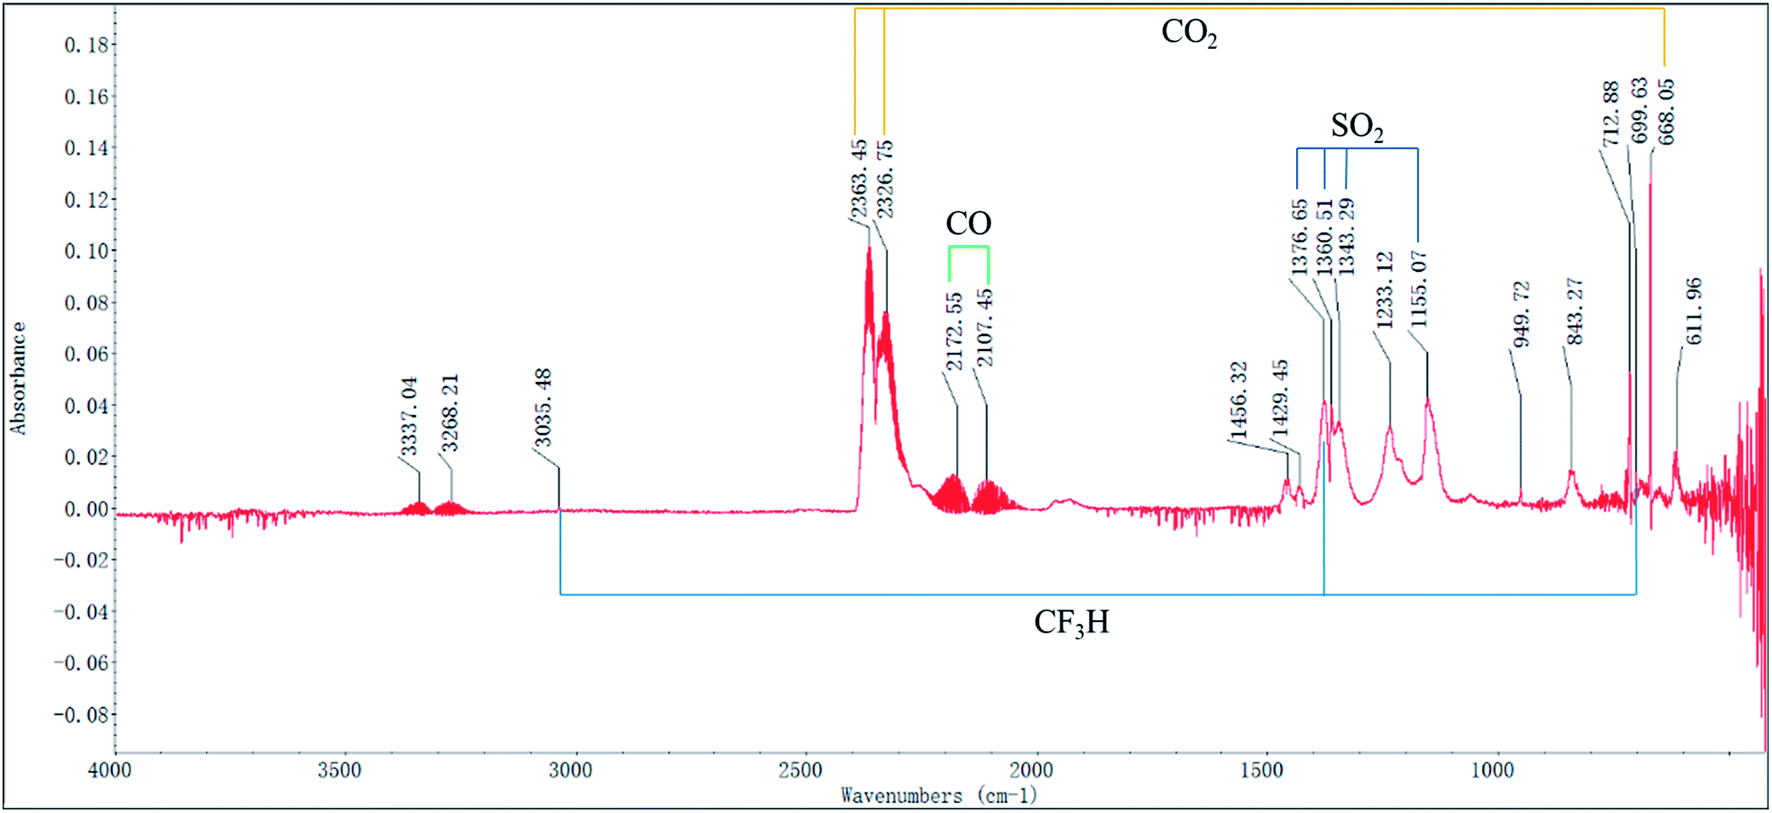
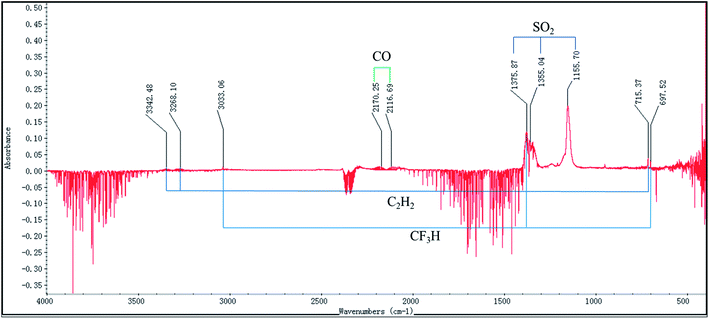
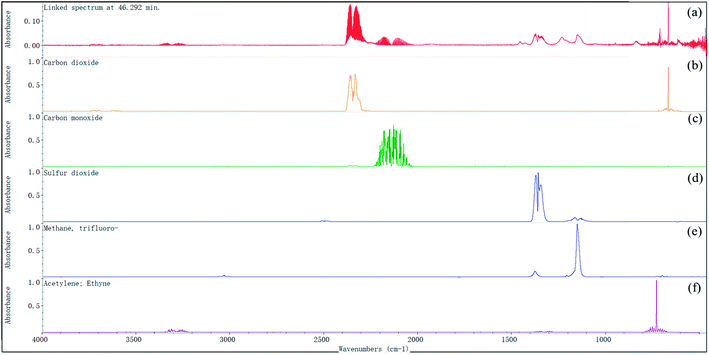
In order to determine the possible substances in the evolved gas, the FTIR spectrum collected at the temperature TAIT was chosen, as higher substance concentrations were observed at this temperature. Fig. 11 shows the corresponding FTIR spectrum in the nitrogen atmosphere, and the wave numbers identified are also included. Based on these identified wave numbers, the substances in the evolved gas may include: carbon dioxide (O![[double bond, length as m-dash]](https://www.rsc.org/images/entities/char_e001.gif) CO asymmetric stretching: 2390–2280 cm−1, bending: 667.0 cm−1), carbon monoxide (C
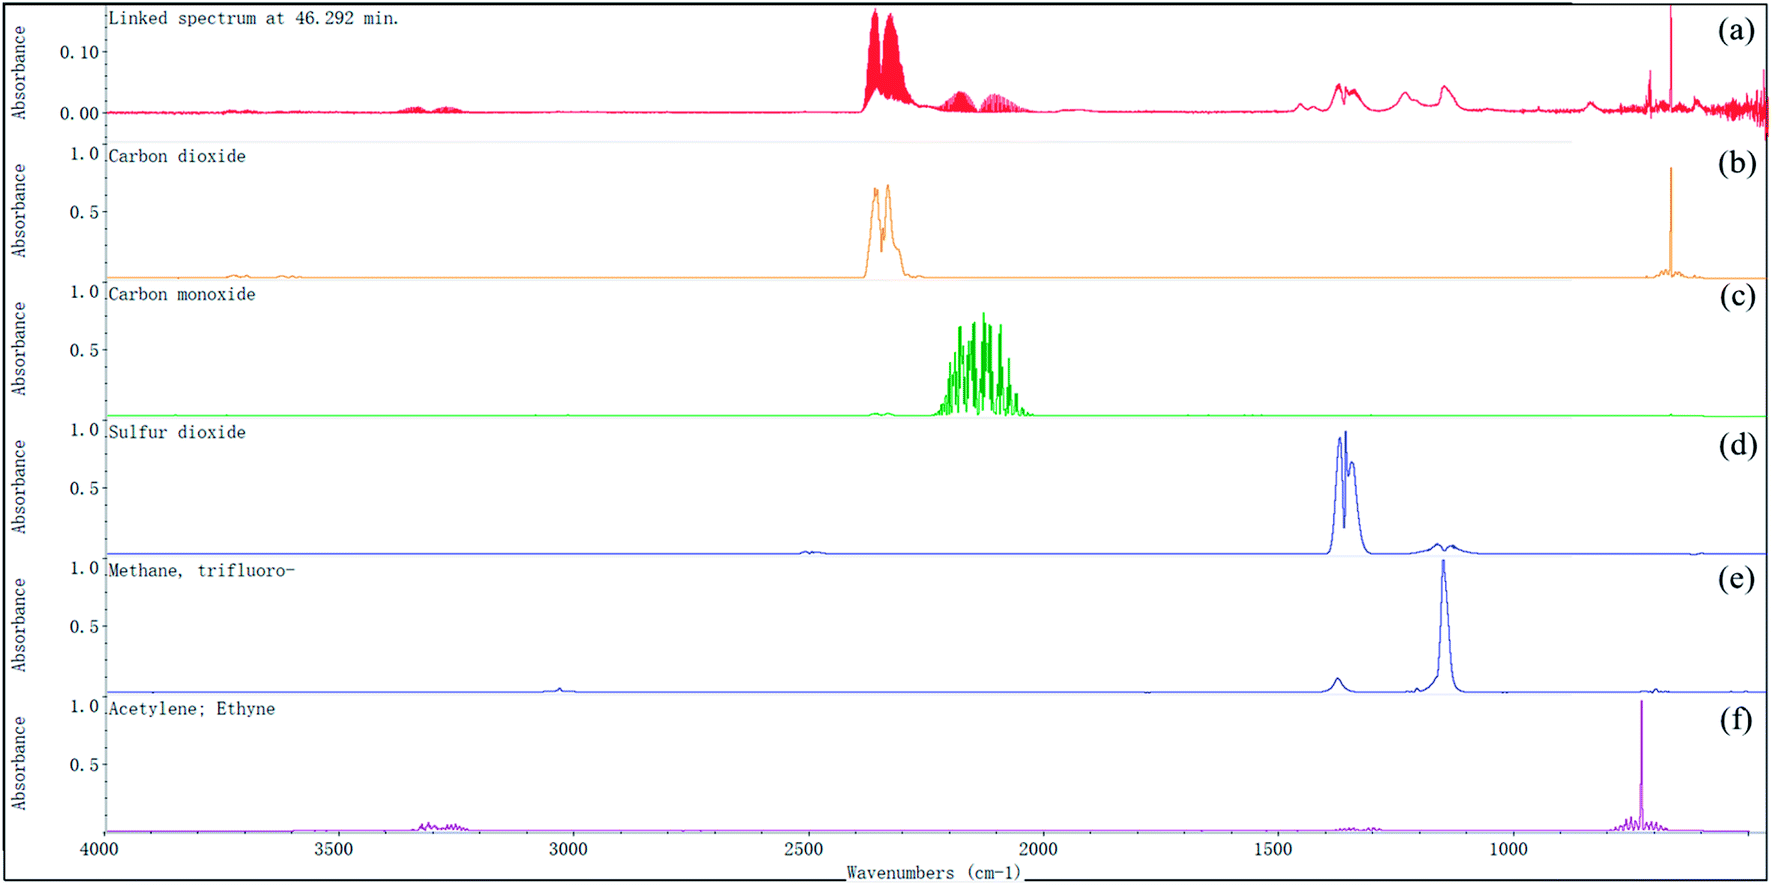
CO asymmetric stretching: 2390–2280 cm−1, bending: 667.0 cm−1), carbon monoxide (C![[triple bond, length as m-dash]](https://www.rsc.org/images/entities/char_e002.gif) O stretching: 2173–2020 cm−1), sulfur dioxide (OSO asymmetric stretching: 1379–1343 cm−1; OSO symmetric stretching: 1155.5 cm−1), trifluoromethane (C–H stretching: 3035.1 cm−1, C–H bending 1376.3 cm−1, CF3 deforming: 699.8 cm−1, CF3 stretching: 1280–1000 cm−1), and acetylene (C–H stretching: 3380–3250 cm−1, C–H bending: 700–600 cm−1). In Fig. 12, the FTIR spectrum of the evolved gas is compared with the standard FTIR spectra of the above substances, which were obtained from the Aldrich Vapor-Phase Library, EPA Vapor-Phase Library, and TGA Vapor-Phase Library provided by the instrument. The sulfur dioxide may be produced by the decomposition of the anion [Tf2N], trifluoromethane may be produced by the attack of anion and its decomposed nucleophilic group on C2–H or by the decomposition of the anion [Tf2N], and acetylene may result from the elimination mechanism.22 It can be observed in Fig. 12 that by considering the combined effect of these identified substances, the FTIR spectrum obtained at temperature TAIT can be reasonably explained.
O stretching: 2173–2020 cm−1), sulfur dioxide (OSO asymmetric stretching: 1379–1343 cm−1; OSO symmetric stretching: 1155.5 cm−1), trifluoromethane (C–H stretching: 3035.1 cm−1, C–H bending 1376.3 cm−1, CF3 deforming: 699.8 cm−1, CF3 stretching: 1280–1000 cm−1), and acetylene (C–H stretching: 3380–3250 cm−1, C–H bending: 700–600 cm−1). In Fig. 12, the FTIR spectrum of the evolved gas is compared with the standard FTIR spectra of the above substances, which were obtained from the Aldrich Vapor-Phase Library, EPA Vapor-Phase Library, and TGA Vapor-Phase Library provided by the instrument. The sulfur dioxide may be produced by the decomposition of the anion [Tf2N], trifluoromethane may be produced by the attack of anion and its decomposed nucleophilic group on C2–H or by the decomposition of the anion [Tf2N], and acetylene may result from the elimination mechanism.22 It can be observed in Fig. 12 that by considering the combined effect of these identified substances, the FTIR spectrum obtained at temperature TAIT can be reasonably explained.
 |
| | Fig. 11 FTIR spectrum of the evolved gas of [EMIM][Tf2N] in nitrogen atmosphere collected at the auto-ignition temperature (TAIT). | |
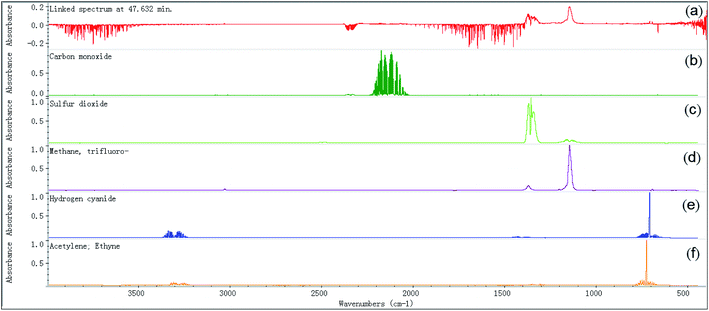 |
| | Fig. 12 Comparison the FTIR spectrum of the evolved gas of [EMIM][Tf2N] in nitrogen atmosphere collected at the auto-ignition temperature (TAIT) with the FTIR spectra of the identified species: (a) the FTIR spectrum of [EMIM][Tf2N] in the evolved gas at temperature TAIT; (b) standard FTIR spectrum of carbon monoxide; (c) standard FTIR spectrum of sulfur dioxide; (d) standard FTIR spectrum of trifluoromethane; (e) standard FTIR spectrum of hydrogen cyanide; (f) standard FTIR spectrum of acetylene. | |
Fig. 13 shows the FTIR spectrum and the identified wave number obtained in the air atmosphere. Based on the identified wave numbers, the substances in the evolved gas may include: carbon dioxide (OCO asymmetric stretching: 2390–2280 cm−1, bending: 668.1 cm−1), carbon monoxide (CO stretching: 2173–2020 cm−1), sulfur dioxide (OSO asymmetric stretching: 1379–1343 cm−1; OSO symmetric stretching: 1155.1 cm−1), trifluoromethane (C–H stretching: 3035.5 cm−1, C–H bending 1376.7 cm−1, CF3 deforming: 699.6 cm−1, CF3 stretching: 1280–1000 cm−1), and acetylene(C–H stretching: 3380–3250 cm−1, C–H bending: 700–600 cm−1). Moreover, it can be observed in Fig. 14 that by considering the combined effect of these identified substances, the FTIR spectrum obtained at temperature TAIT can be reasonably explained.
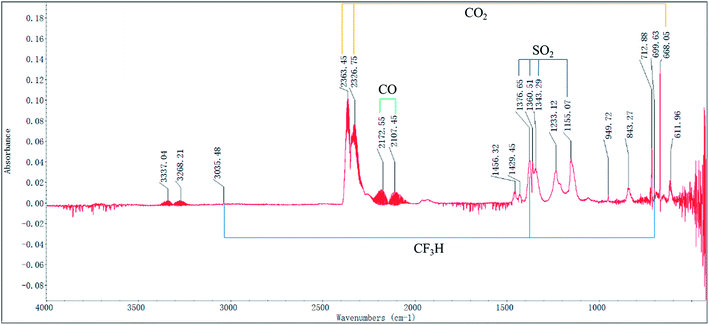 |
| | Fig. 13 FTIR spectrum of the evolved gas of [EMIM][Tf2N] in air atmosphere collected at the auto-ignition temperature (TAIT). | |
 |
| | Fig. 14 Comparison the FTIR spectrum of the evolved gas of [EMIM][Tf2N] in air atmosphere collected at the auto-ignition temperature (TAIT) with the FTIR spectra of the identified species: (a) the FTIR spectrum of [EMIM][Tf2N] in the evolved gas at temperature TAIT; standard FTIR spectrum of (b) carbon dioxide; (c) carbon monoxide; (d) sulfur dioxide; (e) trifluoromethane; (f) acetylene. | |
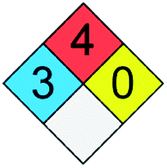
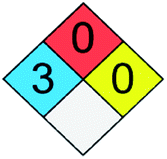
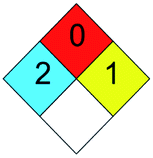
Table 4 summarizes and compares the substances identified in the nitrogen and air atmospheres. In this table, when available, we also include the auto-ignition temperature of each identified substance and the NFPA 704 symbol for later discussion. The auto-ignition temperature data were retrieved form Project 801, Evaluated Process Design Data, Public Release Documentation, Design Institute for Physical Properties (DIPPR).35 As can be seen from Table 4, acetylene was observed in the nitrogen atmosphere, but not in the air atmosphere. In addition, acetylene is flammable and its AIT is 305 °C, which is much lower than the AIT of [EMIM][Tf2N] (478 °C), and this explains why in the air atmosphere the TGA curve of [EMIM][Tf2N] appeared from exothermic effects before its AIT.
Table 4 Summary of the identified substances in different atmospheresa
| Identified species |
Nitrogen atmosphere |
Air atmosphere |
AITb (°C) |
NFPA symbol |
| The circle symbol denotes this species could be identified in the FTIR spectrum of the evolved gas; the cross symbol means the specified species was not identified in the FTIR spectrum of the evolved gas. The auto-ignition temperatures were adopted form Project 801, Evaluated Process Design Data, Public Release Documentation, Design Institute for Physical Properties (DIPPR), American Institute of Chemical Engineers(AIChE), 2015. |
| Carbon monoxide |
O |
O |
608 |
 |
| Carbon dioxide |
X |
O |
|
 |
| Sulfur dioxide |
O |
O |
|
 |
| Trifluoromethane |
O |
O |
|
 |
| Acetylene |
O |
X |
305 |
 |
In the TGA tests, when the temperature increased from T0 to Te, an obvious carbon dioxide peak (wave number: 2390–2280 cm−1; 668 cm−1) appeared in the air atmosphere (see Fig. 10), but such a carbon dioxide peak was not found in the nitrogen atmosphere (see Fig. 9). Moreover, in the air atmosphere, carbon monoxide (wave number: 2173–2120 cm−1) was also observed at temperature Te, and it became more intense at temperature TAIT. These observations also support that ignition occurred in the air atmosphere at temperature Te. It could also be observed in Fig. 10 that an obvious carbon dioxide peak (wave number: 2390–2280 cm−1; 668 cm−1) appeared in the air atmosphere as the temperature increased from T0 to Te, but no obvious carbon dioxide peak was found in the nitrogen atmosphere (see Fig. 9). Moreover, in the air atmosphere, carbon monoxide (wave number: 2173–2120 cm−1) was observed at temperature Te, and then became obvious, as shown in Fig. 10, at temperature TAIT. These observations were also an indication that ignition has occurred in the air atmosphere at temperature Te. In short, a reasonable conclusion can be drawn, that, in the air atmosphere, through auto-ignition, the acetylene produced by the decomposition of [EMIM][Tf2N] is converted to carbon dioxide before temperature Te.
Conclusions
In this work, the flammability characteristics of [EMIM][Tf2N] were examined by auto-ignition temperature tests, as well as in a TGA/DSC system and TGA-FTIR system. Based on the standard test method of ASTM E659-78, the AIT of [EMIM][Tf2N] is 478 °C, and the corresponding ignition delay time is 12.6 seconds. The TGA curves in both the nitrogen and air atmospheres indicated that [EMIM][Tf2N] started to decompose at a temperature of about 300 °C, the sample weight dropped sharply at a temperature of about 430 °C, and the decomposition reaction terminated at a temperature of about 480 °C. However, the thermal effects observed in the DSC curves were quite different in the nitrogen and air atmospheres. An endothermic effect was found in the former case while an exothermic effect was found in the latter case. In the nitrogen atmosphere, the DSC curve showed that the [EMIM][Tf2N] decomposed endothermically at a temperature of about 360 °C. However, the decomposition of [EMIM][Tf2N] was exothermic at a temperature of about 440 °C in the air atmosphere. The following observations were found from the FTIR spectra of the evolved gas collected at the temperature of TAIT: (a) the identified substances were different in the nitrogen and air atmospheres; (b) acetylene was observed in the nitrogen atmosphere, but it was not observed in the air atmosphere; (c) large amounts of carbon dioxide and carbon monoxide were found in the air atmosphere. Based on these observations, it is reasonable to conclude that the gaseous decomposition product acetylene was consumed in the air atmosphere by its auto-ignition.
Generally, the fire and explosion hazards of organic solvents are classified into two categories: flammability and reactivity. One of the main indicators for evaluating the flammability of organic solvents is the flash point, which is related to the combustion of the vapors of organic solvents. Because [EMIM][Tf2N] is a very low volatility liquid, its vapor does not accumulate to the concentration required for combustion. Therefore, the above definition of the flash point of organic solvents does not apply to [EMIM][Tf2N]. As shown in this work, the measured flash point of [EMIM][Tf2N] should be for the combustion of acetylene, which is one of the gaseous decompositions products, not for the vapor of [EMIM][Tf2N] itself. The danger of fire and explosion caused by the reaction of organic solvents is called the reactive hazard of organic solvents. One of the important indicators for assessing the consequences of a reactive hazard is the accompanying heat released by the reaction. The traditional way for assessing the consequences of a reactive hazard was also challenged by the [EMIM][Tf2N]. As shown in this work, the decomposition reaction of [EMIM][Tf2N] itself is endothermic, and the heat released in the air atmosphere was observed to be due to the auto-ignition of the gaseous decomposition product acetylene rather than the decomposition reaction itself. The experimental results in this work also show that the AIT of [EMIM][Tf2N] measured by the standard test method of ASTM E659-78 is much higher than the temperature at which its gaseous decomposition products can be ignited. Therefore, for safety application purposes, care should be taken in using the AIT data of [EMIM][Tf2N].
Conflicts of interest
The authors declare no conflict of interest. The funding sponsors had no role in the design of the study; in the collection, analyses, or interpretation of data; in the writing of the manuscript, and in the decision to publish the results.
Acknowledgements
The authors would like to thank the Ministry of Science and Technology, ROC for financially supporting this study under grant number: MOST 104-2221-E-327-004-MY3 and MOST 108-2221-E-992-057-MY3.
References
- ASTM D 93-16a, Stand. test methods for flash point by Pensky-Martens closed cup tester, West Conshohocken, PA, 2005 Search PubMed.
- D. A. Crowl and J. F. Louvar, Chemical process safety: fundamentals with applications, Prentice-Hall, 3rd edn, 2011 Search PubMed.
- ECHA, Guidance on the Application of the CLP Criteria; Guidance to Regulation (EC) No 1272/2008 on classification, labelling and packaging (CLP) of substances and mixtures. Version 4.1, 2015 Search PubMed.
- Ionic liquids in synthesis, ed. P. Wasserscheid and T. Welton, John Wiley & Sons, 2008 Search PubMed.
- Green industrial applications of ionic liquids, ed. R. D. Rogers, K. R. Seddon and S. Volkov, Springer Science & Business Media, 2012 Search PubMed.
- D. M. Fox, W. H. Awad, J. W. Gilman, P. H. Maupin, C. Hugh and P. C. Trulove, Flammability, thermal stability, and phase change characteristics of several trialkylimidazolium salts, Green Chem., 2003, 5(6), 724–727 RSC.
- H. J. Liaw, Y. R. Liou, P. H. Liu, H. Y. Chen and C. M. Shu, Increased flammability hazard when ionic liquid [C6mim][Cl] is exposed to high temperatures, J. Hazard. Mater., 2019, 367, 407–417 CrossRef CAS PubMed.
- S. H. Liu, W. C. Lin, H. Xia, H. Y. Hou and C. M. Shu, Combustion of 1-butylimidazolium nitrate via DSC, TG, VSP2, FTIR, and GC/MS: an approach for thermal hazard, property and prediction assessment, Process Saf. Environ. Prot., 2018, 116, 603–614 CrossRef CAS.
- S. H. Liu and B. Zhang, Using thermal analysis technology to assess the thermal stability of 1,3-dimethylimidazolium nitrate, Process Saf. Environ. Prot., 2019, 124, 181–186 CrossRef CAS.
- B. Zhang, S. H. Liu, J. Liu, Z. H. Zhang, B. Laiwang and C. M. Shu, Thermal stability and flammability assessment of 1-ethyl-2,3-dimethylimidazolium nitrate, Process Saf. Environ. Prot., 2020, 135, 219–227 CrossRef CAS.
- W. C. Lin, W. L. Yu, S. H. Liu, S. Y. Huang, H. Y. Hou and C. M. Shu, Thermal hazard analysis and combustion characteristics of four imidazolium nitrate ionic liquids, J. Therm. Anal. Calorim., 2018, 133(1), 683–693 CrossRef CAS.
- D. M. Fox, J. W. Gilman, A. B. Morgan, J. R. Shields, P. H. Maupin, R. E. Lyon, H. C. De Long and P. C. Trulove, Flammability and thermal analysis characterization of imidazolium-based ionic liquids, Ind. Eng. Chem. Res., 2008, 47(16), 6327–6332 CrossRef CAS.
- H. J. Liaw, C. C. Chen, Y. C. Chen, J. R. Chen, S. K. Huang and S. N. Liu, Relationship between flash point of ionic liquids and their thermal decomposition, Green Chem., 2012, 14(7), 2001–2008 RSC.
- A. O. Diallo, C. Len, A. B. Morgan and G. Marlair, Revisiting physico-chemical hazards of ionic liquids, Sep. Purif. Technol., 2012, 97, 228–234 CrossRef CAS.
- Y. T. Chen, C. C. Chen, C. H. Su and H. J. Liaw, Auto-ignition characteristics of selected ionic liquids, Procedia Eng., 2014, 84, 285–292 CrossRef CAS.
- C. C. Chen, C. Y. Chen, J. H. Wu and X. Kang, Fire and explosion hazards of ionic liquid 1-methyl-1-propylpyrrolidinium bis(trifluoromethanesulfonyl)imide, J. Loss Prev. Process Ind., 2019, 60, 233–240 CrossRef CAS.
- C. C. Chen, H. J. Liaw and Y. N. Chen, Flammability characteristics of ionic liquid 1-decyl-3-methylimidazolium bis(trifluoromethylsulfonyl)imide, J. Loss Prev. Process Ind., 2017, 49, 620–629 CrossRef CAS.
- M. Smiglak, W. M. Reichert, J. D. Holbrey, J. S. Wilkes, L. Sun, J. S. Thrasher, K. Kirichenko, S. Singh, A. R. Katritzky and R. D. Rogers, Combustible ionic liquids by design: is laboratory safety another ionic liquid myth?, Chem. Commun., 2006, 24, 2554–2556 RSC.
- Z. Wang, Y. Jin, W. Zhang, B. Wang, T. Liu, J. Zhang and Q. Zhang, Synthesis and hypergolic properties of flammable ionic liquids based on the cyano (1 H-1, 2,3-triazole-1-yl) dihydroborate anion, Dalton Trans., 2019, 48(18), 6198–6204 RSC.
- N. Zohari, R. Fareghi-Alamdari and N. Sheibani, Model development and design criteria of hypergolic imidazolium ionic liquids from ignition delay time and viscosity viewpoints, New J. Chem., 2020, 44, 7436–7449 RSC.
- C. Neise, C. Rautenberg, U. Bentrup, M. Beck, M. Ahrenberg, C. Schick, O. Keßler and U. Kragl, Stability studies of ionic liquid [EMIm][NTf2] under short-term thermal exposure, RSC Adv., 2016, 6(54), 48462–48468 RSC.
- Y. Chen, Y. Cao, Y. Shi, Z. Xue and T. Mu, Quantitative research on the vaporization and decomposition of [EMIM][Tf2N] by thermogravimetric analysis-mass spectrometry, Ind. Eng. Chem. Res., 2012, 51(21), 7418–7427 CrossRef CAS.
- A. Heintz, J. K. Lehmann and C. Wertz, Thermodynamic properties of mixtures containing ionic liquids. 3. Liquid–liquid equilibria of binary mixtures of 1-ethyl-3-methylimidazolium bis(trifluoromethylsulfonyl)imide with propan-1-ol, butan-1-ol, and pentan-1-ol, J. Chem. Eng. Data, 2003, 48(3), 472–474 CrossRef CAS.
- K. A. Fletcher and S. Pandey, Surfactant aggregation within room-temperature ionic liquid 1-ethyl-3-methylimidazolium bis(trifluoromethylsulfonyl)imide, Langmuir, 2004, 20(1), 33–36 CrossRef CAS PubMed.
- ASTM E659-78, Standard test method for autoignition temperature of liquid chemicals, West Conshohocken, PA, 2005 Search PubMed.
- C. C. Chen, H. J. Liaw, C. M. Shu and Y. C. Hsieh, Autoignition temperature data for methanol, ethanol, propanol, 2-butanol, 1-butanol, and 2-methyl-2,4-pentanediol, J. Chem. Eng. Data, 2010, 55(11), 5059–5064 CrossRef CAS.
- C. C. Chen, T. H. Han, S. X. Hong and D. J. Hsu, Auto-ignition temperature data for selected ketones, in Advanced Materials Research, Trans Tech Publications Ltd, 2012, vol. 560, pp. 145–151 Search PubMed.
- C. P. Chen, C. C. Chen and T. H. Han, Autoignition Temperature Data for Isopropyl Chloride, Butyl Chloride, Isobutyl Chloride, Pentyl Chloride, Pentyl Bromide, Chlorocyclohexane, and Benzoyl Chloride, Ind. Eng. Chem. Res., 2013, 52(23), 7986–7992 CrossRef CAS.
- ASTM E537-12, Standard test method for the thermal stability of chemicals by differential scanning calorimetry, West Conshohocken, PA, 2012 Search PubMed.
- H. Y. Chen, Investigation of the Ionic Liquid's Flash Point, Master thesis, Department of Occupational Safety and Health, China Medical University, 2013 Search PubMed.
- S. Vyazovkin, A. K. Burnham, J. M. Criado, L. A. Pérez-Maqueda, C. Popescu and N. Sbirrazzuoli, ICTAC Kinetics Committee recommendations for performing kinetic computations on thermal analysis data, Thermochim. Acta, 2011, 520(1–2), 1–19 CrossRef CAS.
- M. J. Starink, A new method for the derivation of activation energies from experiments performed at constant heating rate, Thermochim. Acta, 1996, 288(1–2), 97–104 CrossRef CAS.
- ASTM E698-16, Standard test method for kinetic parameters for thermally unstable materials using differential scanning calorimetry and the Flynn/Wall/Ozawa method, West Conshohocken, PA, 2016 Search PubMed.
- J. Chomiak, Combustion A Study in theory, fact and application, 1990 Search PubMed.
- R. L. Rowley, W. V. Wilding, J. L. Oscarson and N. F. Giles, DIPPR Data Compilation of Pure Chemical Properties, Design Institute for Physical Properties, Brigham Young University, Provo, UT, 2012 Search PubMed.
|
| This journal is © The Royal Society of Chemistry 2020 |
Click here to see how this site uses Cookies. View our privacy policy here. 
 Open Access Article
 This Open Access Article is licensed under a Creative Commons Attribution-Non Commercial 3.0 Unported Licence
 *b,
Bin Zhangc and
Jian-He Wub
*b,
Bin Zhangc and
Jian-He Wub