DOI:
10.1039/D0RA01768J
(Paper)
RSC Adv., 2020,
10, 18434-18439
A simple fluorescent probe for detection of Ag+ and Cd2+ and its Cd2+ complex for sequential recognition of S2−†
Received
24th February 2020
, Accepted 7th May 2020
First published on 14th May 2020
Abstract
In this study, we designed and synthesized a simple probe 2-(8-((8-methoxyquinolin-2-yl)methoxy)quinolin-2-yl)benzo[d]thiazole (DQT) for detection of Ag+ and Cd2+ in a CH3OH/HEPES (9![[thin space (1/6-em)]](https://www.rsc.org/images/entities/char_2009.gif) :1 v/v, pH = 7.30) buffer system. Its structure was characterized by NMR, ESI-HR-MS and DFT calculations, and its fluorescence performance was also investigated. Probe DQT showed fluorescence quenching in response to Ag+ and Cd2+ with low detection limits of 0.42 μM and 0.26 μM, respectively. Importantly, the complexation of the probe with Cd2+ resulted in a red shift from blue to green, making it possible to detect Ag+ and Cd2+ by the naked eye under an ultraviolet lamp. The DQT-Cd2+ complex could be used for sequential recognition of S2−. The recovery response could be repeated 3 times by alternate addition of Cd2+ and S2−. A filter paper strip test further demonstrated the potential of probe DQT as a convenient and rapid assay.
:1 v/v, pH = 7.30) buffer system. Its structure was characterized by NMR, ESI-HR-MS and DFT calculations, and its fluorescence performance was also investigated. Probe DQT showed fluorescence quenching in response to Ag+ and Cd2+ with low detection limits of 0.42 μM and 0.26 μM, respectively. Importantly, the complexation of the probe with Cd2+ resulted in a red shift from blue to green, making it possible to detect Ag+ and Cd2+ by the naked eye under an ultraviolet lamp. The DQT-Cd2+ complex could be used for sequential recognition of S2−. The recovery response could be repeated 3 times by alternate addition of Cd2+ and S2−. A filter paper strip test further demonstrated the potential of probe DQT as a convenient and rapid assay.
Introduction
Cd2+ and Ag+ ions are important transition metal ions involved in various biological and environmental processes.1–4 However, excessive intake of Ag+ can cause serious harm to human health as it can inactivate thiolase and even have a carcinogenic effect.5,6 Cd2+ is one of the most serious air pollutants, and it is also highly toxic, causing serious health problems even at low concentrations.7–10 It is reported that Cd2+ ions are associated with the pathogenesis of many diseases including cancers.11–14 Thus, it is necessary to detect Cd2+ and Ag+ in the environment. However, traditional methods such as capacity analysis,15 ICP-MS16 and atomic absorption method,17 may be greatly limited due to requirement of equipment, high cost, cumbersome operation and low accuracy.18 In comparison, the fluorescence detection method has advantages of high specific recognition ability, high sensitivity and short response time, making it useful for the detection of many metal ions such as Hg2+, Pb2+, Cu2+ and Zn2+.19–23
Two mechanisms namely PET and ICT are inclusively used as the basis for the design of fluorescent probes.24–26 PET refers to the process of fluorescence quenching or enhancement caused by electron transfer between the excited electron donor or electron acceptor after photoexcitation.27 In addition, the recognition groups of ICT probes are usually a part of the push–pull electron system, and thus the combination of these groups with metal ions may affect the push–pull electron effect of the fluorophore and the intramolecular charge transfer, thus leading to changes in fluorescence spectrum.28
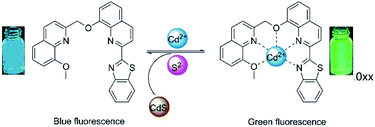
Many fluorescent probes have been developed based on the two mechanisms for the detection of a variety of ions, such as Cu2+/Cd2+,29,30 Zn2+/Cd2+,31–33 and Cu2+/Cd2+/PPi.34 However, there are fewer probes for the detection of Ag+/Cd2+/S2−. In this work, a simple fluorescent probe DQT was successfully synthesized based on quinolone35–38 and benzothiazole,39–41 which showed high selectivity toward Ag+ and Cd2+ in CH3OH/HEPES (9:1 v/v, pH = 7.30), and its Cd2+ complex could be used for sequential recognition of S2−. The paper strip test was carried out to verify its practicability (Scheme 1).
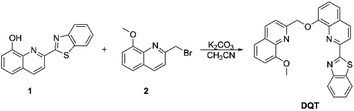 |
| | Scheme 1 Synthesis of probe DQT. | |
Results and discussion
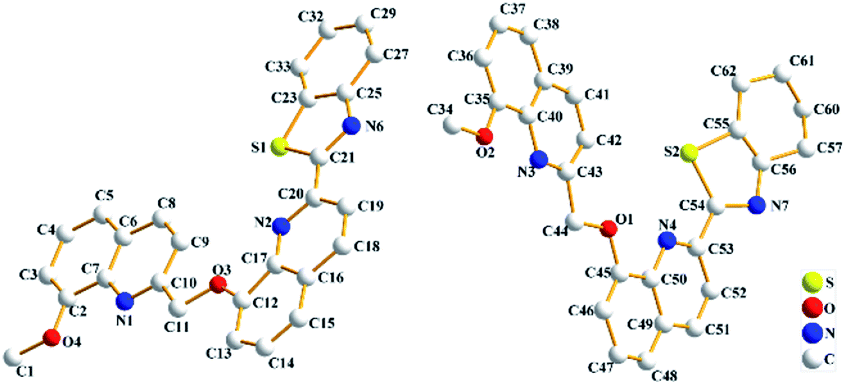
X-ray structural analysis probe DQT
As shown in Fig. 1, the crystal structure without hydrogen atom of probe DQT was given. The cell parameters were a = 21.767(3) Å, α = 90 deg; b = 4.8042(8) Å, β = 103.866(7) deg; c = 42.042(7) Å, γ = 90 deg. The detail crystal data, structure refinement, torsion angles and bond lengths and angles for probe DQT were shown in Tables S1–S3 of Appendix B.† More information has been uploaded to the Cambridge Crystallographic Date Center (CCDC 1975779).
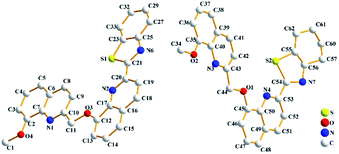 |
| | Fig. 1 The crystal structure without hydrogen atom of probe DQT. | |
The fluorescence response of probe DQT towards Ag+ and Cd2+
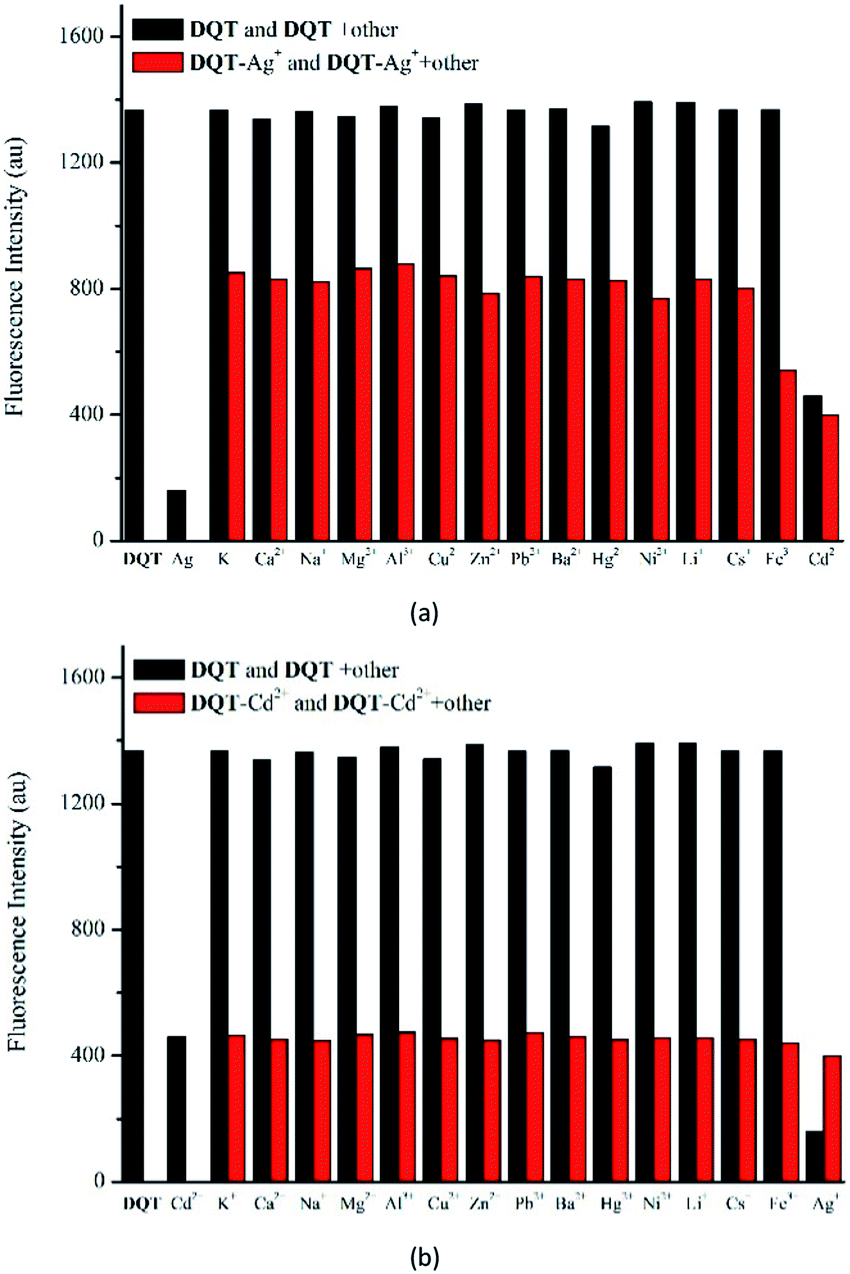
To study the fluorescence selectivity of probe DQT toward metal ions, the fluorescence spectra of probe DQT upon the addition of 20 equiv. of K+, Na+, Zn2+, Cu2+, Hg2+, Pb2+, Ba2+, Cd2+, Cs+, Li+, Ag+, Mg2+, Ca2+, Al3+, Ni2+ and Fe3+ were recorded in CH3OH/HEPES (9:1 v/v, pH = 7.30) (λex = 344 nm). As shown in Fig. 2(a), no distinct changes were observed in fluorescence spectra of probe DQT (Φ = 0.308) upon the containing of metal cations except that with the presence of Ag+ (Φ = 0.002) and Cd2+ (Φ = 0.227). Upon the addition of different metal ions, Ag+ caused a 88% fluorescence quenching and displayed an “on–off” behavior. With Cd2+, probe DQT showed a 33% fluorescence quenching with a spectral red-shift of 25 nm from 465 to 490 nm. This could be attributed to changes in the electronically conjugated structure of the molecule after the combination of the lone pair of electrons of N atoms with Cd2+. In addition, due to the special molecular configuration and electronic structure of the compound, complex DQT-Cd2+ was not interfered by other ions. Apparent color changes were observed, indicating that probe DQT could be used to detect Ag+ and Cd2+ by naked eye (Fig. 2(b) and (c)).
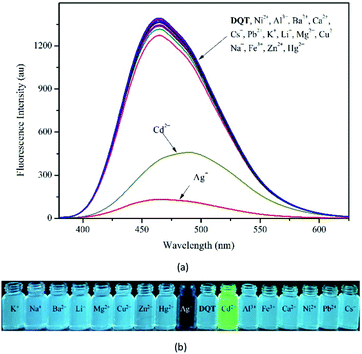 |
| | Fig. 2 (a) Fluorescence spectra of probe DQT upon the addition of various metal cations (2 × 10⁻⁴ mol L−1) and blank. (b) Color changes of probe DQT with various metal cations in CH3OH/HEPES (9:1 v/v, pH = 7.30) buffer system under UV light. | |
Competition experiments were performed to explore the effects of other metal ions on the recognition of Ag+ and Cd2+. It could be seen in Fig. 3(a) that there was significant change in fluorescence intensity after the addition of 20 equiv. of Ag+. Clearly, the recognition of Ag+ was affected by these metal ions. However, the recognition of Cd2+ was not affected especially Ag+ and the fluorescence color was still green under UV light, as shown in Fig. 3(b). Compared to Ag+, probe DQT had higher selectivity for Cd2+.
 |
| | Fig. 3 Competitive selectivity of probe DQT (10 μM) toward Ag+ (a) and Cd2+ (b) (20 equiv.) in the absence (black bars) or presence (red bars) of specified ions (20 equiv.). | |
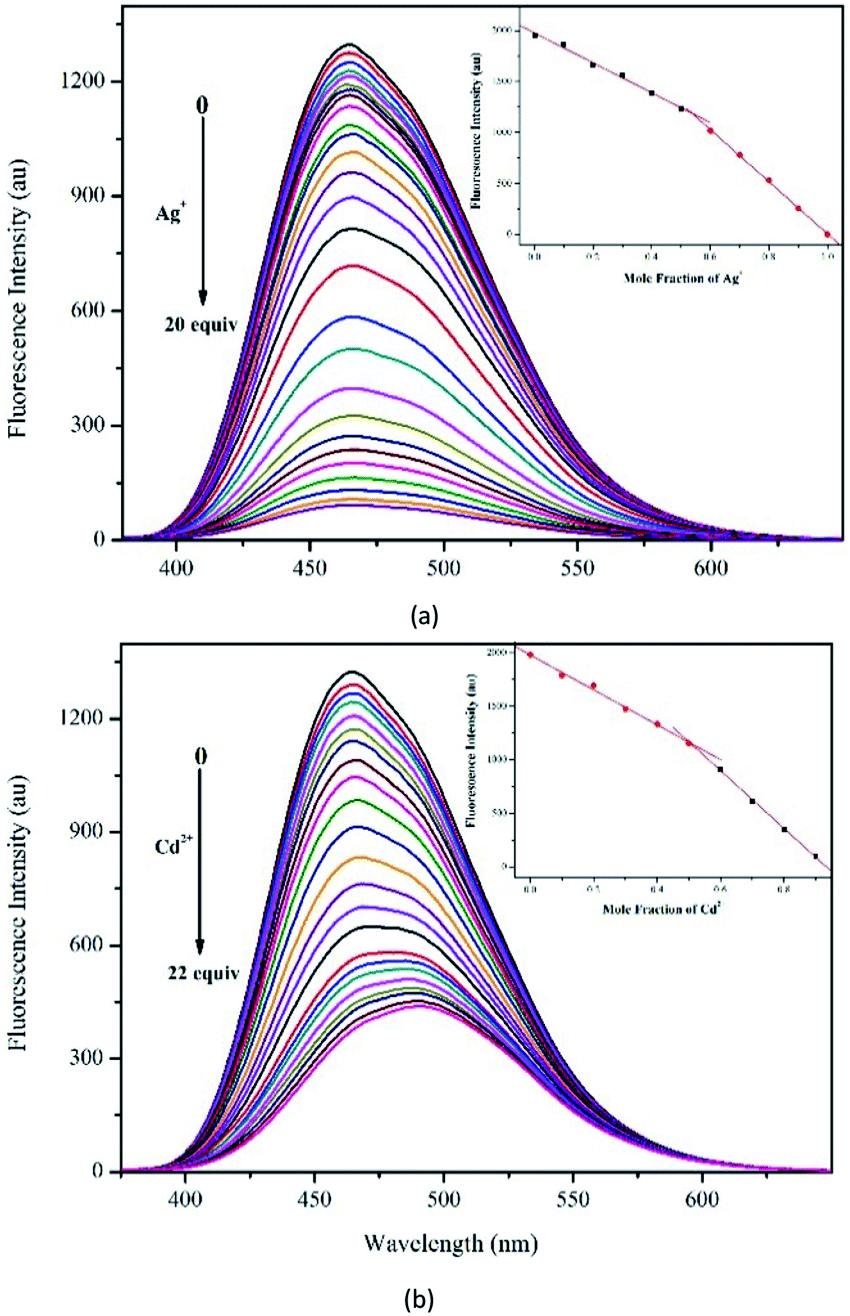
To better understand the sensitivity of probe DQT toward Ag+ and Cd2+, the fluorescent titration of Ag+ and Cd2+ was carried out in CH3OH/HEPES (9:1 v/v, pH = 7.30) buffer system at an excitation wavelength of 344 nm. As shown in Fig. 4(a), probe DQT exhibited an emission at 465 nm with an enormous Stokes shift of 121 nm. Upon incremental addition of Ag+, the fluorescence emission gradually decreased until a plateau was reached at 20 equiv. of Ag+. The limit of detection (LOD) was determined to be 0.42 μM based on LOD = 3σ/m (Fig. S6†). As shown in Fig. 4(b), the addition of Cd2+ resulted in a red shift of the fluorescence emission of probe DQT to 490 nm, and probe DQT showed fluorescence quenching with a LOD of 0.26 μM for Cd2+ (Fig. S7†). The stoichiometry determined by the Job's method was 1:1 for both DQT-Ag+ and DQT-Cd2+ complexes, as shown at the upper right corner of Fig. 4(a) and (b). The complexation constant of probe DQT to Ag+ (Ka = 2.68 × 10³ M−1) (Fig. S4,† Y = 1.75 × 10⁻⁷ × X − 4.69 × 10⁻⁴, R2 = 0.9953) obtained according to the Benesi–Hildebrand plots was lower than that to Cd2+ (Ka = 2.23 × 10⁴ M−1) (Fig. S6,† Y = 3.91 × 10⁻⁸ × X + 8.72 × 10⁻⁴, R2 = 0.9967). The titration results were consistent with the interference results, indicating that probe DQT had a better sensitivity for Cd2+ than Ag+.
 |
| | Fig. 4 The fluorescence intensity of probe DQT (10 μM) in CH3OH/HEPES (9:1 v/v, pH = 7.30) buffer system upon incremental addition of Ag+ (a) and Cd2+ (b). Job's curves were shown at the upper right corner. | |
Fluorescence recognition of DQT-Cd2+ complex to S2−
In the interference test, the detection of Ag+ was easily affected by other metal ions, and thus we focused on the response of Cd2+ and anions, including S2−, HSO3−, SO32−, SO42−, Br−, F−, CO32−, Cl−, OAc−, HCO3−, I−, NO2− and NO3− in CH3OH/HEPES (9:1 v/v, pH = 7.30) buffer system (λex = 344 nm). In Fig. 5, only S2− showed obvious fluorescence recovery with an enhancement efficiency of 64% and a blue shift from 490 to 465 nm. Competition experiments were performed to explore the effects of other anions on the recognition of S2−. As exhibited in Fig. S8,† significant fluorescence recovery was observed upon the addition of 20 equiv. of S2−. Obviously, these anions had no effect on the recognition of S2−, especially sulfur-containing anions. Thus, DQT-Cd2+ showed high specificity for S2−.
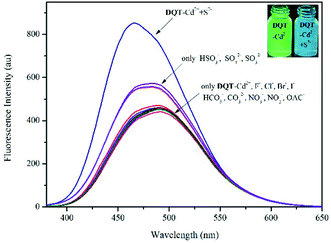 |
| | Fig. 5 Fluorescence spectra of DQT-Cd2+ (1 × 10⁻⁵ mol L−1) with the addition of various anions (20 equiv.) in CH3OH/HEPES (9:1 v/v, pH = 7.30) buffer system. | |
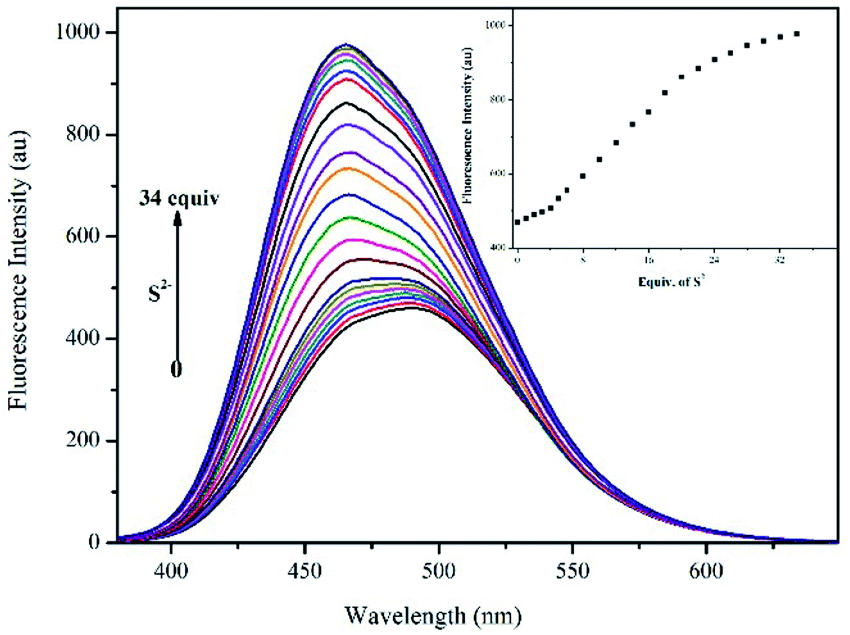
The fluorescence titration with S2− was recorded in CH3OH/HEPES (9:1 v/v, pH = 7.30) buffer system (λex = 344 nm). In Fig. 6, the intensity of the strongest fluorescence emission peak gradually increased and blue-shifted as the S2− concentration was increased to 34 equiv., after which it remained relatively constant. The LOD was calculated to be 11.50 μM by eqn (1) (Fig. S9,† Y = 21.99 × X + 420.56, R2 = 0.9983).
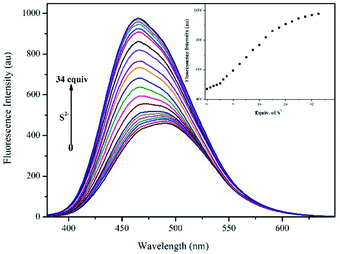 |
| | Fig. 6 Fluorescence spectra of DQT-Cd2+ (10 μM) with S2− (0–34 equiv.) in CH3OH/HEPES (9:1 v/v, pH = 7.30) buffer system (λex = 344 nm). Inset: the plot of fluorescence intensity DQT-Cd2+ versus S2−. | |
Reversibility of probe DQT for Cd2+ and S2-
The reversibility was determined by alternating addition of Cd2+ and S2−. As illustrated in Fig. 7, the fluorescence intensity was quenched to 33% and the fluorescence colour changed from blue to green observed by naked eye with the addition of Cd2+. However, the addition of S2− resulted in the recovery of the fluorescence intensity to about 64% and fluorescence colour change to blue. As the number of cycles increased, the recognition performance decreased gradually but still remained high after 3 cycles.
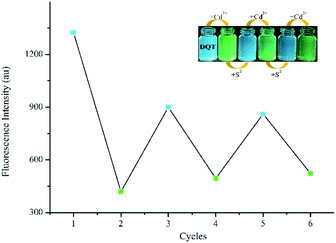 |
| | Fig. 7 Reversible changes in fluorescence intensity of probe DQT (10 μM) in CH3OH/HEPES (9:1 v/v, pH = 7.30) buffer system upon alternate addition of Cd2+ and S2−. | |
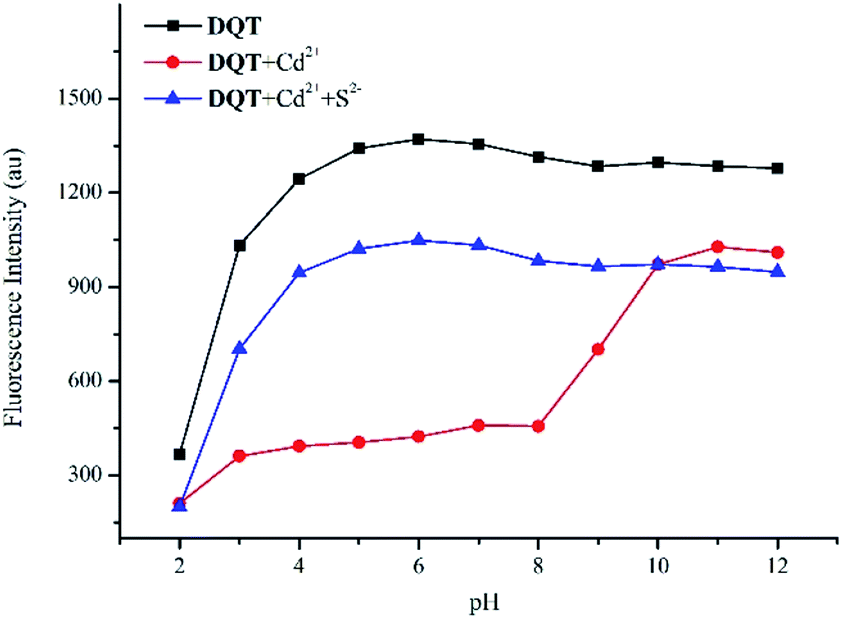
Effect of pH
As shown in Fig. 8, probe DQT exhibited excellent sequence selectivity and a red-shift at pH = 4–8 with the addition of Cd2+, and the fluorescence was replied with the addition of S2−. The selectivity of probe DQT was affected under highly acidic or alkaline conditions, probably due to changes in the structure of the probe and the loss of the coordination with ions.
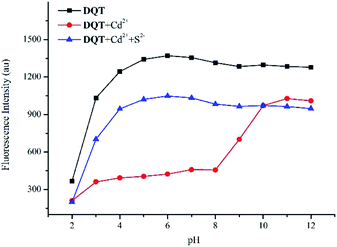 |
| | Fig. 8 Influences of the fluorescence intensity of probe DQT (10 μM) toward Cd2+ (20 equiv.) and S2− (20 equiv.) at pH = 2–12 in CH3OH/HEPES (9:1 v/v) buffer system at room temperature. | |
DFT study
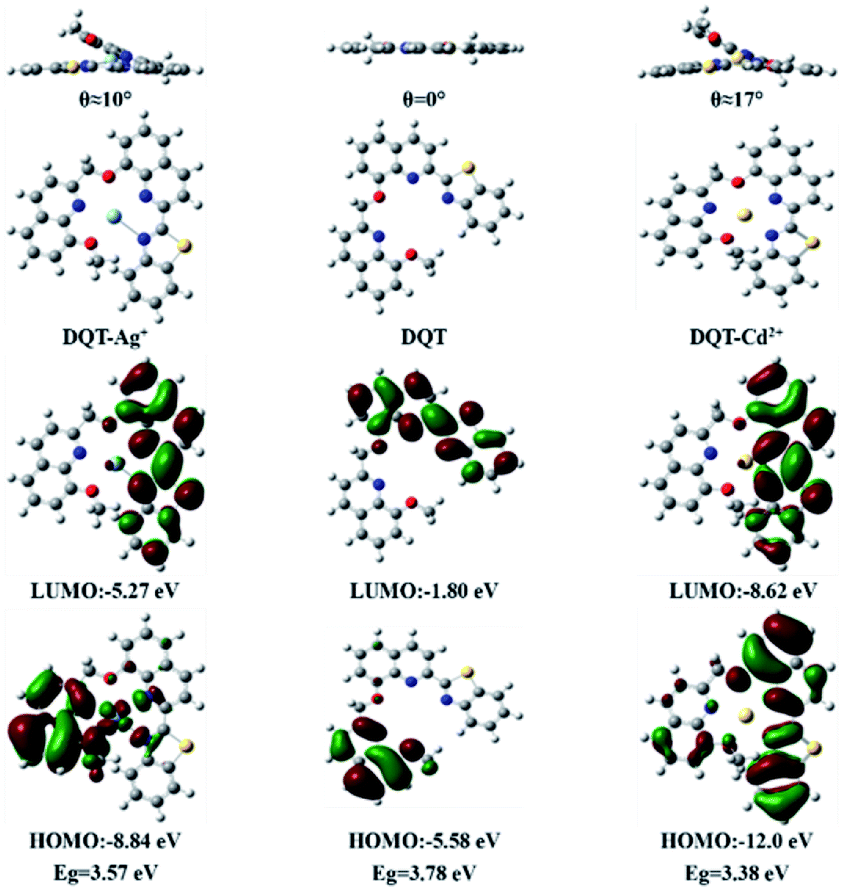
Gaussian 09 program was used for the density functional theory calculation at the level of B3LYP/6-31G (d, p) and B3LYP/LANL2DZ to gain a further insight into the photophysical properties and the nature of optical response of DQT, DQT-Ag+ and DQT-Cd2+. Fig. 9 showed the optimized structures and the electron dispersion of HOMO and LUMO. The molecular structure of probe DQT was planar, and most electrons in HOMO and LUMO were distributed on the 8-methoxyquinoline and quinolinylbenzothiazole groups, respectively. Its planarity was destroyed and the dihedral angles of quinolinobenzothiazole and 8-methoxyquinoline groups were 10° and 17° after coordinating with Ag+ and Cd2+, respectively. The electrons in HOMO were transferred to the binding site with Ag+, which promoted the PET process and quenched the fluorescence. Similarly, the electrons in HOMO and LUMO were mainly concentrated on the quinolinylbenzothiazole group after coordination with Cd2+, resulting in a red shift. The energy gaps of DQT, DQT-Ag+ and DQT-Cd2+ were 3.78 eV, 3.57 eV and 3.38 eV, respectively, indicating that the binding with Cd2+ was more stable.
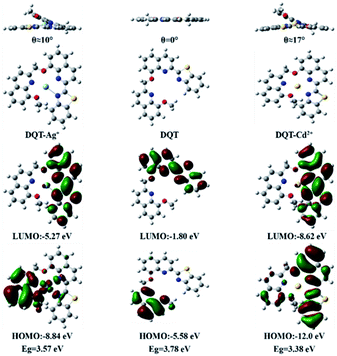 |
| | Fig. 9 Molecular orbital and electronic contributions of the relevant excitations. | |
The possible mechanism
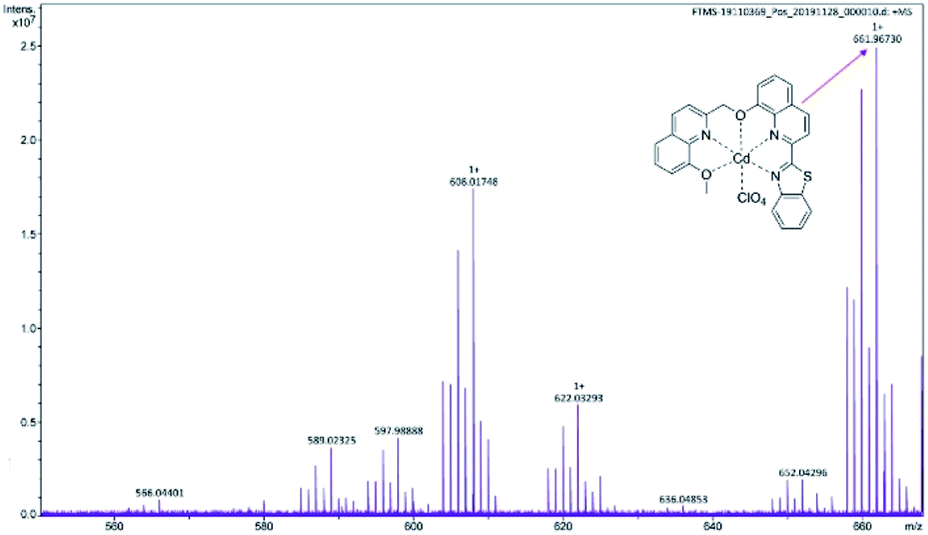
The possible mechanism is proposed as follows. The stoichiometry of the DQT-Ag+ and DQT-Cd2+ complex is determined to be 1:1. Given the fluorescence quenching and no red shift of emission wavelength, the binding mode of probe DQT and Ag+ conforms to the PET process. The coordination mechanism of probe DQT and Cd2+ can be attributed to ICT because the fluorescence emission wavelength is red-shifted after coordination with Cd2+.34,42 Moreover, the molecular ion peak (ESI-MS) at 661.96730 [DQT + Cd2+ + ClO4−; m/z calcd for 661.97167] (Fig. 10) indicates an 1:1 complexation between probe DQT and Cd2+, and thus it can be concluded that all nitrogen and oxygen atoms of the molecule participate in coordination. Due to the strong interaction between S2− and Cd2+, the overall fluorescence is recovered after the addition of S2−, suggesting that S2− can form CdS precipitate with Cd2+ and remove Cd2+ from DQT-Cd2+ complex. In summary, the Scheme 2 manifested the possible coordination mode.
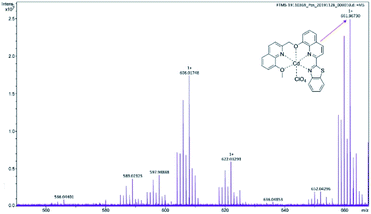 |
| | Fig. 10 ESI-MS spectra of DQT-Cd2+. | |
 |
| | Scheme 2 The possible mechanism. | |
Practical application on test strips
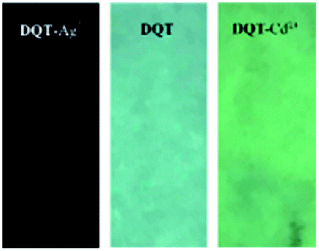
Filter paper strip test was carried out to determine the practicability of probe DQT. Filter paper strips were immersed in CH3OH/HEPES (9:1 v/v, pH = 7.30) buffer system of DQT at a concentration of 1 × 10⁻³ M for 30 min and dried in air, and then smeared with Ag+ and Cd2+ solution respectively. The fluorescence changes were observed under UV light. Fig. 11 showed that the fluorescence color of the test strip which treated with Cd2+ changed from blue (Fig. 11(b)) to green (Fig. 11(c)), while the fluorescence was quenched after treated with Ag+ (Fig. 11(a)), suggesting that probe DQT could be used to distinguish for Ag+ and Cd2+ by naked eye under UV light.
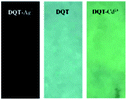 |
| | Fig. 11 Color changes on test paper (a) DQT-Ag+; (b) DQT; (c) DQT-Cd2+ under UV light. | |
Conclusions
Herein, probe DQT was successfully synthesized for recognition of multiple ions. It showed fluorescence quenching towards Ag+ based on the PET mechanism, but the complexation constant was low and the recognition of Ag+ could be interfered by other ions. Probe DQT could also be used to detect Cd2+ based on the ICT mechanism with a red shift of 25 nm of the fluorescence emission wavelength in the same CH3OH/HEPES (9:1 v/v, pH = 7.30) buffer system. The DQT-Cd2+ complex could be used for recognition of S2−. Both Ag+ and Cd2+ could form complexes with probe DQT with a coordination ratio of 1:1. Finally, filter paper strip test verified its practicability.
Conflicts of interest
There are no conflicts to declare.
Acknowledgements
We gratefully acknowledge the financial support from Applied Basic Research Programs of Shanxi Province (Grant No. 201801D221087), the Science Foundation of North University of China (No. 110121) and Program for Young Leaders of Disciplines in North University of China (Grant No. QX201806).
References
- L. N. Xu, X. H. Yang, H. Y. Ding, S. H. Li, M. Li, D. Wang and J. L. Xia, Mater. Sci. Eng., C, 2019, 102, 917 CrossRef CAS PubMed
 .
. - Y. Y. Zhu, Q. Sun, J. W. Shi, H. Y. Xia, J. L. Wang, H. Y. Chen, H. F. He, L. Shen, F. Zhao and J. Zhong, J. Photochem. Photobiol., A, 2019, 389, 112244 CrossRef .
- J. H. Wang, Y. M. Liu, J. B. Chao, H. Wang, Y. Wang and S. M. Shuang, Sens. Actuators, B, 2020, 303, 127216 CrossRef CAS .
- P. Liu, J. Liu, F. Yao, X. M. Zhan and X. P. Qi, J. Photochem. Photobiol., B, 2020, 202, 111717 CrossRef CAS PubMed .
- Z. E. Chen, H. Zhang and Z. Iqbal, Spectrochim. Acta, Part A, 2019, 215, 34 CrossRef CAS PubMed .
- D. K. Dang, S. Chandrasekaran, Y. T. Ngo, J. S. Chung, E. J. Kim and S. H. Hur, Sens. Actuators, B, 2018, 255, 3284 CrossRef CAS .
- P. Ravichandiran, A. Boguszewska-Czubara, M. Masłyk, A. P. Bella, P. M. Johnson, S. A. Subramaniyan, K. S. Shim and D. J. Yoo, Dyes Pigm., 2020, 172, 107828 CrossRef CAS .
- M. X. Huang, C. H. Lv, Q. D. Huang, J. P. Lai and H. Sun, RSC Adv., 2019, 9, 36011 RSC .
- Y. F. Tang, Y. Huang, Y. H. Chen, L. X. Lu, C. Wang, T. Sun, M. Wang, G. H. Zhu, Y. Yang, L. Zhang and J. L. Zhu, Spectrochim. Acta, Part A, 2019, 218, 359 CrossRef CAS PubMed .
- A. Maity, U. Ghosh, D. Giri, D. Mukherjee, T. K. Maiti and S. K. Patra, Dalton Trans., 2019, 48, 2108 RSC .
- L. I. Szekeres, S. Bálint, G. Galbács, I. Kálomista, T. Kiss, F. H. Larsen, L. Hemmingsen and A. Jancsó, Dalton Trans., 2019, 48, 8327 RSC .
- P. Wang, Y. An and Y. W. Liao, Spectrochim. Acta, Part A, 2019, 216, 61 CrossRef CAS PubMed .
- P. Wang, L. P. Duan and Y. W. Liao, Microchem. J., 2019, 146, 818 CrossRef CAS .
- Z. N. Lu, L. Wang, X. Zhang and Z. J. Zhu, Spectrochim. Acta, Part A, 2019, 213, 57 CrossRef CAS PubMed .
- X. K. Li, Q. Y. Ming, R. Cai, T. L. Yue, Y. H. Yuan, Z. P. Gao and Z. L. Wang, Food Control, 2020, 109, 106916 CrossRef CAS .
- N. Zhang and B. Hu, Anal. Chim. Acta, 2012, 723, 54 CrossRef CAS PubMed .
- Y. Y. Liu, H. C. Li, B. Guo, L. J. Wei, B. Chen and Y. Y. Zhang, Biosens. Bioelectron., 2017, 91, 734 CrossRef CAS PubMed .
- W. D. Gao, Y. P. Zhang, H. Li and S. Z. Pu, Tetrahedron, 2018, 74, 6299 CrossRef CAS .
- Y. Wang, X. F. Hou, Z. S. Li, C. H. Liu, S. S. Hu, C. M. Li, Z. H. Xu and Y. Wang, Dyes Pigm., 2020, 173, 107951 CrossRef CAS .
- Y. H. Yuan, L. X. Guo, Z. Z. Chen, Y. J. Zhu, L. H. Feng, W. Hua, M. Z. Tian, H. Y. Wang and F. Feng, Microchem. J., 2019, 147, 615 CrossRef CAS .
- C. L. Li, P. H. Lu, S. Y. Lin and A. T. Wu, J. Photochem. Photobiol., A, 2019, 385, 112088 CrossRef CAS .
- J. Wang, Z. Y. Zhang, X. Gao, X. D. Lin, Y. Q. Liu and S. Wang, Sens. Actuators, B, 2019, 282, 712 CrossRef CAS .
- S. J. Jiang, J. B. Qiu, S. B. Chen, H. Y. Guo and F. K. Yang, Spectrochim. Acta, Part A, 2020, 227, 117568 CrossRef CAS PubMed .
- J. H. Wang, D. R. Gao, X. Y. Wang, Y. M. Lu, W. X. Shen and Y. Y. Lv, Sens. Actuators, B, 2019, 294, 14 CrossRef CAS .
- D. J. Zhu, X. W. Yan, A. S. Ren, W. Cai, Z. H. Duan and Y. H. Luo, Anal. Methods, 2019, 11, 2579 RSC .
- T. Ma, F. J. Huo, Y. Wen, T. E. Glass and C. X. Yin, Spectrochim. Acta, Part A, 2019, 214, 355 CrossRef CAS PubMed .
- C. Y. Zhao, J. Chen, D. L. Cao, J. L. Wang and W. B. Ma, Tetrahedron, 2019, 75, 1997 CrossRef CAS .
- W. Q. Tang, Y. Z. Dai, B. Gu, M. Q. Liu, Z. J. Yi, Z. L. Li, Z. M. Zhang, H. Y. He and R. Y. Zeng, Analyst, 2020, 145, 1427 RSC .
- J. Han, X. Tang, Y. Wang, R. J. Liu, L. Wang and L. Ni, Spectrochim. Acta, Part A, 2018, 205, 597 CrossRef CAS PubMed .
- P. Wang, J. Wu and C. H. Zhao, Spectrochim. Acta, Part A, 2020, 226, 117600 CrossRef CAS PubMed .
- H. H. Song and Z. Zhang, Dyes Pigm., 2019, 165, 172 CrossRef CAS .
- J. F. Lv, G. Liu, C. B. Fan and S. Z. Pu, Spectrochim. Acta, Part A, 2020, 227, 117581 CrossRef CAS PubMed .
- M. Banerjee, M. Ghosh, S. Ta, J. Das and D. Das, J. Photochem. Photobiol., A, 2019, 377, 286 CrossRef CAS .
- Z. Liu, C. N. Peng, Z. X. Lu, X. F. Yang, M. S. Pei and G. Y. Zhang, Dyes Pigm., 2015, 123, 85 CrossRef CAS .
- Z. Liu, G. P. Li, Y. N. Wang, J. L. Li, Y. Mi, D. P. Zou, T. S. Li and Y. J. Wu, Talanta, 2019, 192, 6 CrossRef CAS PubMed .
- L. F. Wang and Y. Qian, J. Photochem. Photobiol., A, 2019, 372, 122 CrossRef CAS .
- T. M. Kawakami, Y. Mizuno, T. Inoue, S. Matsubara and T. Moriuchi, Analyst, 2019, 144, 1140 RSC .
- W. Y. Li, Z. C. Liu, B. Q. Fang, M. Jin and Y. Tian, Biosens. Bioelectron., 2020, 148, 111666 CrossRef CAS PubMed .
- S. Manna, P. Karmakar, S. S. Ali, U. N. Guria, S. K. Samanta, R. Sarkar, P. Dattab and A. K. Mahapatra, Anal. Methods, 2019, 11, 1199 RSC .
- M. Li, H. Chen, X. Liu, Y. L. Wang, N. N. Zhang and K. B. Zheng, Tetrahedron Lett., 2019, 60, 151219 CrossRef CAS .
- W. S. Na, P. Raj, N. Singh and D. O. Jang, Tetrahedron Lett., 2019, 60, 151075 CrossRef .
- Q. L. Liu, L. X. Feng, C. X. Yuan, L. Zhang, S. M. Shuang, C. Dong, Q. Hu and M. M. Choi, Chem. Commun., 2014, 50, 2498 RSC .
Footnote |
| † Electronic supplementary information (ESI) available: Appendix A includes the Experimental section, 1H NMR spectra, 13C NMR spectra, ESI-MS spectra and part of spectrums of probe DQT; Appendix B includes the detail crystal data, structure refinement, torsion angles and bond lengths and angles of probe DQT. CCDC 1975779. For ESI and crystallographic data in CIF or other electronic format see DOI: 10.1039/d0ra01768j |
|
| This journal is © The Royal Society of Chemistry 2020 |
Click here to see how this site uses Cookies. View our privacy policy here. 
 Open Access Article
 This Open Access Article is licensed under a Creative Commons Attribution-Non Commercial 3.0 Unported Licence
 *ab,
Zhiyong Huab,
Xianjiao Mengc,
Zhichun Lia,
Changchun Yuan
*ab,
Zhiyong Huab,
Xianjiao Mengc,
Zhichun Lia,
Changchun Yuan