 Open Access Article
Molecular mechanism of the skin permeation enhancing effect of ethanol: a molecular dynamics study†
Rakesh Gupta *a,
Yogesh Badhe
 a,
Beena Rai
 a and
Samir Mitragotri
 b
b
aPhysical Science Research Area, Tata Research Development and Design Centre, TCS Research, Tata Consultancy Services, 54B, Hadapsar Industrial Estate, Pune – 411013, India. E-mail: gupta.rakesh2@tcs.com; Fax: +91-20-66086399; Tel: +91-20-66086422
bSchool of Engineering and Applied Sciences, Wyss Institute, Harvard University, USA
First published on 24th March 2020
Abstract
Ethanol is widely used in various pharmaceutical and cosmetic formulations in order to enhance skin penetration of active ingredients. While it is well known that ethanol partitions into the skin and enhances the permeation of both polar and nonpolar molecules, the exact mechanisms by which it enhances skin permeability are not fully understood. Several mechanisms have been proposed including lipid extraction from the stratum corneum (SC), fluidisation of SC lipid bilayer, alteration of SC protein conformation and enhancement of the drug solubility in the SC lipids. In this study, we performed molecular dynamics (MD) simulations of SC lipid bilayers comprised of an equimolar mixture of ceramides, cholesterol and free fatty acid in the presence of aqueous mixtures of ethanol. Various unrestrained MD simulations were performed in the presence of aqueous ethanol solution at molar ratios (x) ranging from x = 0 to x = 1. It was found that ethanol enhances bilayer permeability by dual actions (a) extraction of the skin lipids and (b) enhancing the mobility of lipid chains. Ethanol's permeation enhancing effect arises from its superior ability to form hydrogen bonds with headgroup atoms of skin lipids. Further, the free energy of extraction of ceramides (CER) and fatty acids (FFA) from the lipid bilayer was studied using umbrella sampling simulations. The free energy of extraction of CER was found to be much higher compared to FFA for all ethanol concentrations which shows that CER are difficult to extract as compared to FFA. Finally, the permeation of benzoic acid drug molecules through the skin lipid bilayer is shown in presence of ethanol molecules. It was found that ethanol selectively targets the FFA of the skin lipid bilayer and extracts it out of the lipid bilayer within few microseconds. Further, ethanol penetrates inside the lipid layer and creates the channels from which drug molecules can easily cross the lipid layer. Our observations (both in unrestrained and umbrella sampling simulations) are consistent with the experimental findings reported in the literature. The simulation methodology could be used for design and testing of permeation enhancers (acting on skin SC lipid lamella) for topical and transdermal drug delivery applications.
1. Introduction
The primary challenge in the design of transdermal and topical formulation is to breach the barrier provided by skin. Most hydrophilic and macromolecular actives possess low or no permeability across the skin. The skin's permeation resistance arises primarily from its 15–20 μm thick outermost layer, the stratum corneum (SC), which comprises corneocytes and various types of lipids.1 This layer is highly selective and only small and relatively lipophilic molecules can cross it in appreciable quantities.2 The corneocytes and lipid matrix in the SC are arranged in a brick and mortar-like structure respectively, where spaces in between the corneocytes are filled with the lipid matrix.1,2 The lipid matrix is made up of several types of ceramides (CER), free fatty acids (FFA) and cholesterol (CHOL).In order to deliver active ingredients into and across the skin, the SC barrier has to be overcome. Several permeation enhancers have been synthesized and tested either on human or animal skin, and have shown to enhance the permeability of actives. Permeation enhancers can act via a number of different mechanisms such as membrane thinning, phase separation and fluidisation.3 Among various permeation enhancers, ethanol is widely used in cosmetic (hairsprays, mouthwashes) and medicinal products (hand disinfectants), pharmaceutical formulations and many household products.4 Skin is directly exposed to these products and the use of ethanol in these products has been shown to be safe.5,6 Ethanol also increases the permeation of drugs through the skin from topical formulations. For example, estradiol and fentanyl dermal patches have been developed using ethanol to enhance their transdermal deliveries.7–9
While it is well known that ethanol partitions into the skin and enhances the permeation of both polar and nonpolar molecules, the exact mechanism by which it enhances the permeation is still not fully explained. Earlier studies led to several proposed mechanisms ranging from lipid extraction from the lipid bilayer matrix,10–15 fluidisation of the lipid bilayer,16,17 alteration of SC protein conformation,12,17 co-permeation of drug with alcohol (pull effect)18,19 and enhancement of the drug solubility in the SC lipids.20,21 The relative occurrence of each mechanism depends highly upon the concentration of the ethanol used in the donor solution/formulation and on the lipophilicity of drug/actives. The higher permeation of drug in the presence of ethanol may occur due to multiple mechanisms. However, recent FTIR spectroscopy experiments did not detect lipid fluidisation in pure ceramide layers,22 synthetic skin lipid mixtures23 and in actual skin samples.24
In order to capture the exact effect of ethanol on the SC, molecular level assessment of the interaction of ethanol with skin SC is needed. In this study, the interaction of ethanol with skin lipid bilayer model is studied at various concentrations of aqueous ethanol solution ranging from x = 0 to x = 1 mole fraction. At first, unrestrained simulations are carried out at various ethanol concentrations. The structural changes induced by ethanol in the bilayer structure are discussed. Further, to strengthen the findings from unrestrained simulations, additional free energy simulation of extraction of lipids (CER and FFA) out of lipid bilayer is carried out using umbrella sampling simulations. The effect of ethanol on skin lipid bilayers is explained in terms of changes in both structural properties and free energy of lipid extraction. In the end, permeation of drug molecules in presence of ethanol is studied via microsecond time scale unrestrained MD simulation.
2. Methods, model and interaction parameters
2.1 Unrestrained simulation
The skin lipid bilayer model is adopted from our earlier studies.25,26 The skin lipid bilayer is made-up of various types of ceramides, which are categorised based on the headgroup structure.27 The equimolar skin lipid bilayer model, comprising only CER-NS, has yielded good results in our previous studies.25,26,28 The lignoceric acid is used to represent the whole free fatty acid class. Hereafter, lignoceric acid and CER-NS will be represented as FFA and CER respectively.The skin lipid bilayers are being modelled either by using combination of GROMOS29 and Berger force field30 or by CHARMM force field.31 In this study we have used former one. In the GROMOS force field, methyl groups of the CER and FFA tails are treated as a united atom carbon with a zero-net charge. The LJ parameters for the methyl group are taken from the Berger force field.30 For studying polar effects, CERs head groups are expressed in the fully atomistic way and the partial charges on the molecule are taken from the previous study.26,28 The force field data of CHOL and FFA is taken from previous simulation study.26,32 The ethanol and benzoic acid are modelled based on GROMOS parameters. Water is simulated using an SPC model.33
All simulations were performed using GROMACS software.34–36 The equilibrated skin lipid bilayer obtained from an earlier simulation study25 was used as a template to generate the initial configuration of the bilayer system with various ethanol concentrations. The number of water and ethanol molecules used for each system are shown in Table 1. The water molecules were randomly replaced by respective number of ethanol molecules (based on the molar ratio) and simulation box size was increased in Z direction accordingly. The systems were energy minimized using steepest decent method. For proper solvation of bilayer, each system was simulated under NVT condition for 5 ns by keeping the lipids fixed. The restraint on the lipids were removed gradually and simulations were run for 5 ns in NVT condition. The systems were further equilibrated in NPT (T = 305 K, P = 1 bar) condition for 20 ns without restraints. Finally, obtained structures were used for the 1.0 μs NPT production run. In the equilibration move, the temperature and pressure were controlled using the Berendsen thermostat and barostat with a time constant of 1 ps and 5 ps respectively. The pressure was coupled separately in normal and lateral direction with the isothermal compressibility of 4.5 × 10⁻⁵ bar−1. In the production run, temperature and pressure were controlled by Nosé37,38–Hoover39 thermostat and Parrinello–Rahman40 barostat with a time constant of 2 ps and 5 ps, respectively. The simulation trajectory was saved after every 50 ps. In each simulation, electrostatic and van der Waals cut-off was set to 1.2 nm. The Particle Mesh Ewald (PME) sum was used for the treatment of the long range electrostatic interactions. The neighbour list cut off was set to 1.2 nm and updated every tenth step. All bonds of the lipids and water were constrained using LINCS41 and SETTLE algorithm42 respectively.
| Mole fraction (x) | Number of water | Number of ethanol |
|---|---|---|
| 0.1 | 4608 | 512 |
| 0.2 | 4096 | 1024 |
| 0.3 | 3584 | 1536 |
| 0.4 | 3072 | 2048 |
| 0.5 | 2560 | 2560 |
| 0.6 | 2048 | 3072 |
| 0.8 | 1024 | 4096 |
| 1.0 | 0 | 5120 |
2.2 Umbrella sampling simulation
The lipid layer structure equilibrated for 20 ns without restraint was used as an initial template for umbrella sampling simulation. The initial configurations were generated by pulling out either CER or FFA, one from each leaflet. These molecules were pulled out slowly at a constant speed of 0.02 nm ps−1. Whenever the distance between the centre of mass of bilayer and constrained molecule changed by 0.2 nm, that configuration was stored for further simulations. The generated configurations (20–25) were then equilibrated for 5 ns followed by 20 ns of production run with given CER or FFA molecule restrained in Z direction using a harmonic force constant of 1000 kJ mol−1 nm−2. However, the constrained CER or FFA molecules were allowed to freely move in the lateral direction. The simulation trajectories were saved after every 20 ps. The forces were saved at every 5 steps.3. Results & discussion
3.1 Unrestrained simulation
As mentioned earlier, researchers have used either CHARMM or GROMOS force field to simulate the skin lipids.25,31,32,43 Here, we have used GROMOS based force field to capture the effect of ethanol concentration on skin lipid layer. The number of water and ethanol molecules for a particular ethanol mole fraction is given in Table 1. Two replicas of each system were simulated and average of these two replicas are reported here. The snapshots of each system, at the end of simulation run (1 μs), are shown in Fig. 1. For clarity, water and ethanol molecules are not shown here, and only lipid molecules are shown. Three different phenomena can be observed based on the concentration regime. At lower concentration (x < 0.2), the lipid bilayer remains mostly intact and very few lipids (especially FFAs) are disturbed by ethanol. At moderate concentrations (0.2 < x < 0.6), the lipids are significantly disturbed, and many lipids are extracted from the lipid bilayer. The lipid extraction effects of ethanol are seen more on FFA compared to CER. Finally, at higher concentration range (x > 0.6), bilayer starts to change its shape and formed non-bilayer type structure and significant amount of lipids are extracted. These lipid extraction observations are in line with various experimental studies reported earlier.10,11,13,23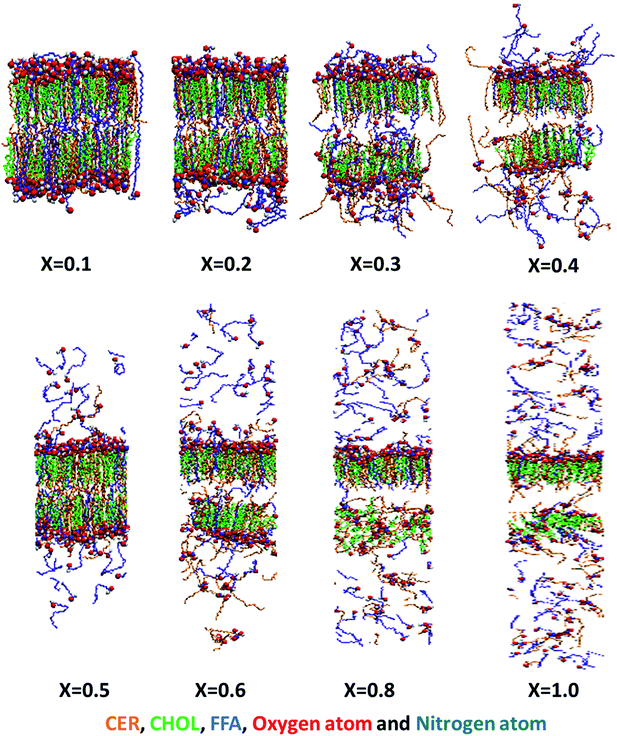 | ||
| Fig. 1 Effect of ethanol concentration over bilayer structure: the snapshot of each system in the end of 1.0 μs simulation run. The water and ethanol are not shown here. The CER, CHOL and FFA are shown in orange, green and blue colour respectively. The headgroup atoms of all three lipids are shown in vdw representation of VMD visualization software.57 At lower or moderate concentration (x < 0.6) ethanol extracts out FFA selectively, while at higher concentration CER also extracted but in lesser amount. | ||
Bommannan et al.10 used attenuated total reflectance infrared spectroscopy to determine the action of ethanol (100%) on human stratum corneum (in vivo). It was observed that the intensity and frequency of C–H asymmetric vibrations decreased after application of ethanol and appreciable amount of lipids were extracted from the stratum corneum. Merwe et al.15 exposed the SC to aqueous ethanol ranging from 0% to 100% v/v ethanol and used FTIR to obtain an index of lipid disorder. It was shown that the ethanol and ethanol/water mixtures altered the stratum corneum through lipid extraction, rather than through disruption of lipid order. Kai et al.11 performed experiments on hairless mouse skin in presence of ethanol and analysed the skin samples using FTIR technique. It was reported that ethanol-treated skin lost considerable amount of intercellular lipids. Levang et al.13 carried out experiments on epidermis in presence of ethanol and propylene glycol and studied the biophysical changes in the SC lipids using FTIR spectroscopy. It was reported that 80% ethanol/20% propylene glycol showed a maximum decrease in the absorbance of the asymmetric and symmetric C–H peaks, which resulted due to a greater loss of lipids in the SC layers. Kwak et al.23 used infrared and deuterium NMR spectroscopy and calorimetry techniques to investigate the effect of ethanol on a model membrane composed of lipids representing the three classes of SC lipids, an equimolar mixture of CER, palmitic acid and CHOL. It was shown that ethanol perturbed the packing and extracted the lipids and the influence was dose dependent. Ethanol concentrations of up to 10% (v/v) had no significant effect, but at 30% (v/v) significant changes occurred in the model membrane. In our simulations, we also observed that the ethanol extracts the skin lipid and selectively targets the FFA molecule (Fig. 1).
To see the effect of ethanol on structure of individual lipids, readers are requested to refer Fig. S1–S8 (see ESI†). At lower concentrations, ethanol mostly remained near the polar head group of the lipids. At moderate and high concentrations, it entered inside the lipid bilayer and carried some of the water molecules along itself (ESI, Fig. S1–S8†). This could explain the increase in the flux of hydrophilic drugs in the presence of ethanol, as observed experimentally.17,18 We have manually visualized trajectories of each CER and FFA present in the system and figured out various events which are shown in ESI (Section S2†). These events are (a) transformation of CER molecule conformation from V shape to extended form and back to V shape (Movie S1†), (b) translation of FFA from the lipid bilayer to solvent (ethanol/water) and back to lipid bilayer (Movie S2†) and (c) translation of CER from the lipid bilayer to solvent and back to lipid bilayer (Movie S3†). The event (a) was observed only in x > 0.3 systems and frequency of this event increased with increase in ethanol concentration. The event (b) was seen even at low concentration x = 0.2 system as well, this event was more frequent and increased with increase in ethanol concentration. The event (c) was rare and only seen at higher concentration of the ethanol (x > 0.6). The CER molecules which were extracted, irrespective of ethanol concentration, has gone through the conformational change (V to extended form). Whereas, no such conformational changes exists for FFA molecule. Also, many of the CER molecules had translated back to the V shape configuration and these events (a) are more frequent. This could also explain why it is difficult to pull out CER molecule from the lipid bilayer as compared to the FFA molecule.
To gain more insight on mentioned events and to represent them quantitatively, we have analysed the time evolution of the distance between the headgroup and tail group atoms of each CER and FFA in each system (Fig. S9†). Based on these patterns various events are recognized and discussed in the Section S3 of the ESI.† Two quantities (i) number of lipids which came out of the lipid bilayer and (ii) total number of extracted lipids were calculated which are shown in Fig. 2. In the former one all the events are included whereas in latter one events where lipids were extracted and reached in the bulk are considered.
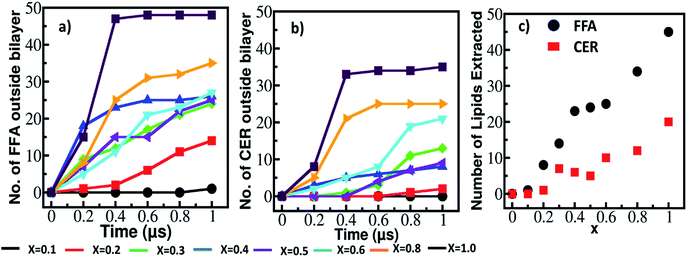 | ||
| Fig. 2 Number of lipids came out of the lipid bilayer (a) FFA and (b) CER with simulation time and (c) total number of lipids extracted from the lipid bilayer at various ethanol concentration. Here, number of lipids outside the bilayer and number of lipids extracted are calculated based on various patterns and events shown in Fig. S9 and Section S2 (please see ESI†). | ||
As it can be seen from Fig. 2a and b, at concentration below x < 0.6 the lipids which are coming out of the bilayer have increased slowly with time, whereas at higher concentration these number increased significantly within 0.2 μs time interval. These could be due to severe disruption of bilayer caused by ethanol at higher concentration as shown in Fig. 1, S7 and S8.† The total number of CER extracted by ethanol are much lower as compared to FFA as shown in Fig. 2c. Significant amount of FFA extracted even at lower concentration (x = 0.2) of the ethanol, whereas ceramides were not.
As shown in Fig. 1 and S1–S8,† ethanol changes the bilayer structure significantly. The structural properties such as order parameter and density distribution are calculated. The density of CER, FFA, ethanol and water along the bilayer normal are calculated in the time interval of 0.2 μs and are plotted in Fig. S10† (x = 0.1 to 0.4) and Fig. S11† (x = 0.5 to 1.0). These profiles depict the shape and size (thickness) of the bilayer. A reduction in the peak of the lipid profile without changing the shape infer that some of the lipids have come out of the bilayer but their amount is so less that they had not affected the bilayer structure. A shape change in the density profile depicts the deformation in the bilayer structure. For example, at x = 0.1, each of the constituent profile did not change with time as no lipids were extracted (Fig. 1 and 2). At higher concentration, x = 0.8 and 1.0, the density profile shape changed significantly as many of the lipids were extracted (Fig. 2) and severe deformation of bilayer happened as can be seen from Fig. 1, S7 and S8.†
The density profiles of the ethanol, water, CER and FFA along the bilayer normal calculated in the last 0.2 μs of simulation time are shown in Fig. 3. At concentrations above x > 0.1, ethanol penetrated in the lipid interior as peaks are observed in the density profile at the center of the bilayer. Ethanol also moved some water molecules along with itself inside the bilayer (Fig. S2–S8, ESI†). The amount of water penetrated inside the lipid layer is however less as compared to ethanol. In some of the experimental studies17,18 it was reported that ethanol had increased the flux of hydrophilic drugs. The above observations of taking water molecules inside the bilayer interior could explain these experimental results. Thind et al.43 performed MD simulation of CER bilayer in presence of ethanol at various concentration and reported that water permeable defects were generated at higher ethanol concentration. Same researchers also reported the extraction of lipids from the CER lipid bilayer at very high concentration of ethanol. The peaks of the CER and FFA profiles decreased with increase in ethanol concentration as lipids were extracted out. The effect of ethanol concentration was more on FFA and compared to CER as can be seen from the density profile. At higher concentration, x – 0.8 and 1.0, almost whole free fatty acid came out of the lipid bilayer whereas CER still had maintained the shape of the bilayer with the help of cholesterol. The cholesterol extraction was not seen in any of the simulated systems (Fig. S1–S8†).
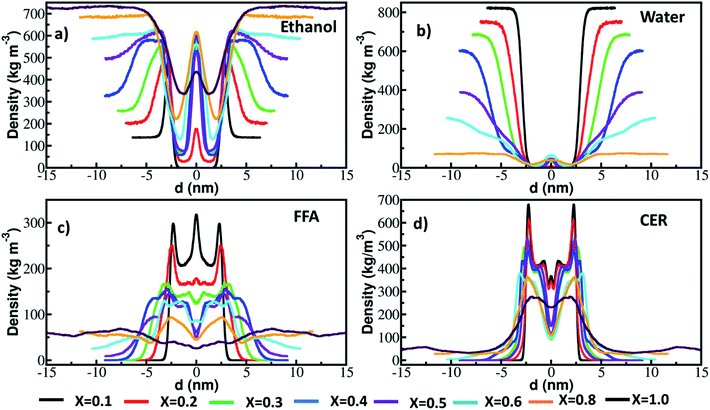 | ||
| Fig. 3 Density of (a) ethanol, (b) water, (c) FFA and (d) CER and along the bilayer normal calculated in last 0.2 μs run. | ||
The second rank order parameter for the bilayer, which has normal in z direction, is defined as follows:
 | (1) |
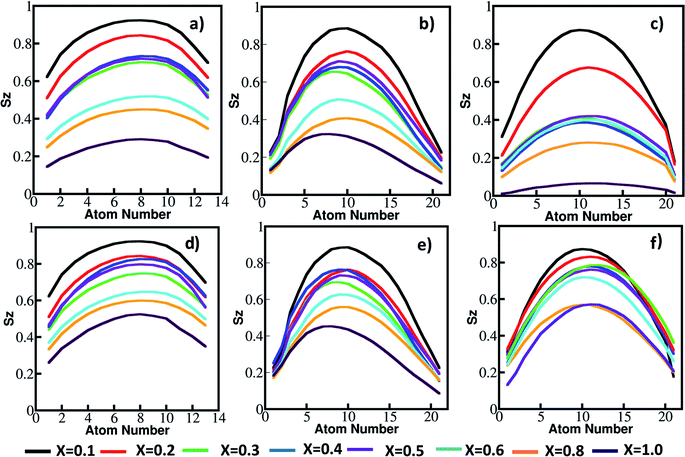
The order parameter of CER and FFA chains are shown in Fig. 4. We have calculated order parameters for two cases, in first case (a, b and c) all the lipids were taken into consideration and in second case (d, e, and f) only lipids which remained inside the lipid bilayer were considered. The order parameter is changed by two events, one – extraction of lipid component and other – permeation of ethanol in the lipid interior. The former one can be captured in first case and later one in second case. The order parameter (first case) for CER sphingo and fatty acid chain and FFA chain decreased with increase in the concentration of the ethanol. A lipid which would come out of the lipid bilayer would not have any order and it will reduce the overall order parameter, which can be seen in Fig. 4a–c. One thing to note that, the order parameter for FFA chain decreased rapidly as compared to CER chains, as more number of FFA's were extracted even at lower concentration of the ethanol (Fig. 2). For any given concentration, the order parameter for FFA chain was lower compared to CER chains. This again implies that ethanol selectively targets the FFA molecules.
The order parameter of CER chains and FFA chain for second case are plotted in Fig. 4d–f. It is interesting to note that the order parameter, irrespective of lipid type or ethanol concentration, is higher in second case as compared to respective order parameter in second case. It shows that although some lipids have been extracted but remaining lipids are still arranged in bilayer form. The order parameter (second case) also decreased with increase in ethanol concentration. Up to ethanol concentration (x = 0.6), CER chains and FFA chain were arranged in some order respect to bilayer normal, above that concentration no order can be seen from the profile. Hence, at higher concentration ethanol not only extracting the lipids out of the bilayer but also fluidising the bilayer interior as well.
Ethanol affects the skin lipid bilayer packing due to its polarity and ability to make hydrogen bonds with the head group. The CHOL (due to its small head group) cannot form hydrogen bonds with ethanol while both CER and FFA efficiently form hydrogen bonds. At moderate concentrations, ethanol only disturbs CER and FFA, while CHOL packing is not changed (ESI, Fig. S1–S8†). The hydrogen bonds formed between CER, FFA and solvents (ethanol and water) are shown in Fig. 5. The hydrogen bond is defined based on the geometric criteria. The bond forms if the donor–acceptor distance is less than 0.35 nm or if donor–acceptor–hydrogen angle is less than 60°. The presence of the –OH group and amide group facilitates CER to act as hydrogen bond donor and acceptor. The number of hydrogen bonds between CER–CER remain constant irrespective of the ethanol concentration. The important factor which determines the packing disruption of the bilayer is the hydrogen bonding within solvents and within lipids (CER and FFA). If hydrogen bonding is higher within the lipids compared to lipid–solvent, they would be tightly packed. Whereas if the solvent–lipid hydrogen bonding is more than lipid–lipid and solvent–solvent hydrogen bonding, the solvent will try to change the packing of the lipid bilayer in order to make hydrogen bond with lipid head group. The hydrogen bonding between lipids (CER and FFA) and ethanol increases with ethanol concentration. It implies that ethanol seeks to bond with both CER and FFA and try to take them out of lipid bilayer. The ample number of CER–CER hydrogen bonds keep them tightly packed in the interior while FFA due to their weaker hydrogen bonding are taken away by the ethanol. Experimentally, Guillard et al.22 reported the effect of ethanol on various model CER lamellar films using FTIR. It was shown that ethanol forms hydrogen bond with CERs and changes the headgroup orientation. The effect of ethanol on the CER film was found to be highly structure dependent. The skin model used in this study only comprises of CER-NS, while presence of other polar CERs (such as AP, NP etc.) may change the hydrogen bonding capability between CERs and ethanol and subsequently the packing.
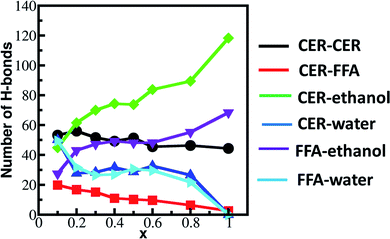 | ||
| Fig. 5 Number of hydrogen bonds formed between lipids and solvents (water & ethanol) calculated in last 0.2 μs simulation run. | ||
In summary, the ethanol has selectively targeted the FFA at lower concentration, whereas at higher concentration both CER and FFA were extracted. The amount of extraction of FFA was much higher as compared to CER. Further to confirm these findings, free energy of extraction of lipids (CER and FFA) from the intact lipid bilayer and deformed lipid bilayer is calculated at various ethanol concentrations using umbrella sampling simulations and are discussed in further section.
3.2 Free energy/potential of mean force of lipid extraction
Earlier experimental studies10–15 and unrestrained simulations have shown that ethanol extracts the lipids from the skin at moderate and high concentrations. To gain more insight we further studied the energetics of lipid extraction from the skin lipid bilayers (both intact and deformed). In order to get a quantitative measure of free energy of extraction, umbrella sampling simulations were carried out at concentrations of x = 0, 0.2, 0.5, 0.8 and 1.0. The procedure to generate initial configuration for the umbrella sampling has been given in method section. The PMF was generated using the weighted histogram analysis method (WHAM),44 implemented as gmx wham tool in the GROMACS.The potential of mean force (PMF) for extracting a CER and FFA out of ordered lipid bilayer were calculated. In this method, molecules were constrained along the bilayer normal using a harmonic potential. The bilayer interior is highly inhomogeneous in terms of local structure and system is in a gel phase, thus making it very complex to sample the whole phase space of the bilayer interior properly. Hence, we constrained two molecules at a time in each of the bilayer leaflet at various z location as shown in Fig. 6a. For a given concentration, a total of 4 different initial XY positions of constrained molecules were used. This makes total 8 separate simulations (2 molecules × 4 positions) for a given concentration. The averages of these 8 simulations are reported here. The free energy in the interior of the bilayer is set at 0. The free energy profiles of CER and FFA extraction from the intact lipid layer at various ethanol concentration are shown in Fig. S12 and S13 (see ESI†).
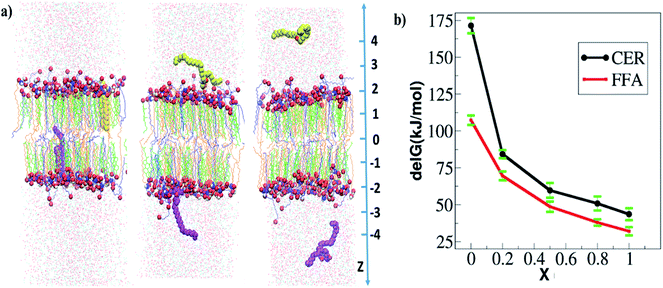 | ||
| Fig. 6 Free energy of extraction of CER and FFA from skin lipid bilayer: (a) snapshot of system in the end of the constrained simulation at three different z positions from the center of the bilayer. In each window, two molecules (either CER or FFA) are restrained. Here constrained CER molecules are shown in vdw mode of VMD software.57 The CER, CHOL and FFA are shown in orange, green and blue color respectively. (b) Free energy profiles of CER and FFA extraction from the skin lipid bilayer at various ethanol concentrations. The averages of four separate simulations are reported here. | ||
The free energy profile shows that external work must be done in order to take out either CER or FFA from the bilayer interior to the surrounding water layer. These simulations were run for 20 ns production run in each window and since each system was in gel phase, so it became necessary to check the convergence of free energy profile and sufficient overlap of histogram in umbrella sampling windows. The overlap of histograms in various cases are shown in Fig. S14 and S15 (see ESI†). The convergence of the free energy profiles in various cases is also shown in Fig. S16 (see ESI†). The free energy of extraction is defined as the difference in the PMF value in the bulk to that in the bilayer interior. The free energies of extraction of individual CER and FFA molecules from the skin lipid bilayer in presence of ethanol are plotted in Fig. 6b. At x = 0, the energy barrier for both FFA and CER are more than 110 kJ mol−1 (∼43.36 RT). Hence, none of the CER and FFA can exit the bilayer. At x = 0.2, the barrier is reduced compared to that at x = 0, but still more than 75 kJ mol−1 (∼29.6 RT), which again is difficult to breach at simulation temperatures. At concentrations higher than 0.2, the barrier decreases and reduces to 48 kJ mol−1 (∼18.66 RT) and 60 kJ mol−1 (∼23.74 RT) for FFA and CER respectively. At higher concentration x = 0.8 and 1.0, it reduces to 35–45 kJ mol−1 (∼13.45 to 17.81 RT) for both CER and FFA, and at this point FFA is more prone to be extracted from the skin lipid bilayer as compared to CER. One thing has to be noted, the free energies are still very high as compared to the thermal energy (RT) because the CER and FFA were pulled from the intact/compact bilayer (initial configuration generated from the bilayer which is equilibrated for 20 ns). Based only on energetic obtained from the intact bilayer, it cannot be claimed that the lipid extraction could be possible, however, it can be concluded that the FFA is easy to pull out of the skin lipid bilayer as compared to the CER, which is also observed in experiments and unrestrained simulations (Fig. 1). In unrestrained simulations, the lipid extraction was observed after 0.2 μs of simulation run, whereas in restrained simulations the intact bilayer is used, where re-orientation of ethanol near the headgroup has not happened on the given time scale of simulation run.
Another point worth noting is that the bilayer environment is heterogeneous, and the obtained PMF profiles (in terms of magnitude) in each of 8 simulations are different as shown in Fig. S12 and S13.† In four cases (2 each for CER and FFA) local environment of the constrained CER and FFA and their corresponding free energy profiles are shown in Fig. 7. It is interesting to note that when either of the constrained CER or FFA are in the vicinity of other ceramides, the free energy of extraction is much higher as compared to those in the vicinity of FFA or CHOL. It implies that CER's capability of making hydrogen bonds with neighbour CER and FFA affects the free energy of extraction. A more penalty has to be given in order to extract a lipid situated in the close vicinity of CER as compared to FFA.
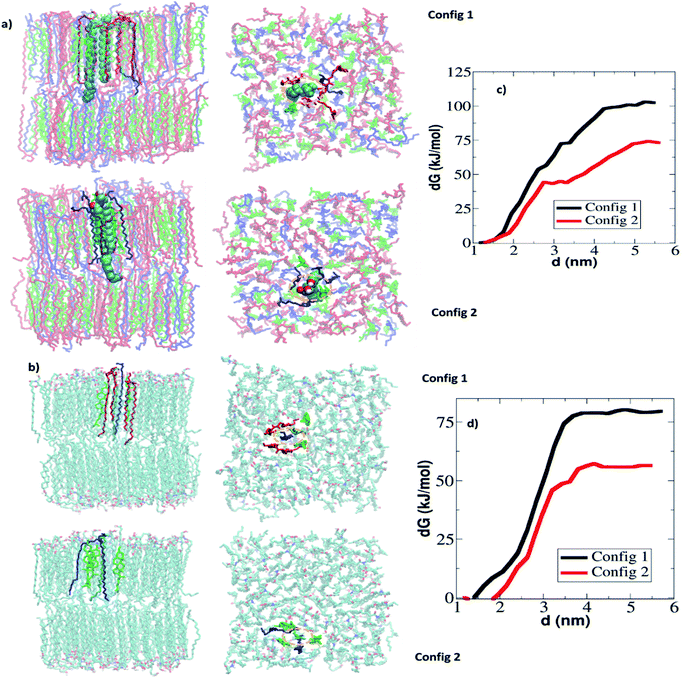
As discussed above, the free energies of extraction from the intact bilayer are higher as compared to room temperature molecular energy (RT), indicating that lipids cannot be extracted, however lipids were seen to be extracted in unrestrained simulation. The main reason for obtaining such high free energy could be the re-orientation of ethanol molecules (around the lipid head group atoms) did not happen within the time scale of constrained simulations. To get more insight, constrained simulation of a deformed bilayer (taken from the unrestrained simulation at x = 0.6) is performed. The systems are generated using the methodology discussed in Section 3.2. The final structure of the systems and corresponding free energy profiles are shown in Fig. 9. In total 8 simulations were performed for each CER and FFA extraction as shown in Fig. 8a and b. As observed earlier, the free energy of extraction of CER and FFA varied with the position as shown in Fig. 8c and d respectively. The free energy of extraction of CER and FFA from the deformed bilayer was 39.25 ± 7.06 kJ mol−1 and 25.16 ± 5.62 kJ mol−1 respectively, which is less compared to free energy obtained from the intact bilayer. It implies that, lipid extraction becomes easy as the ethanol concentration increases as deformation in the bilayer increases.
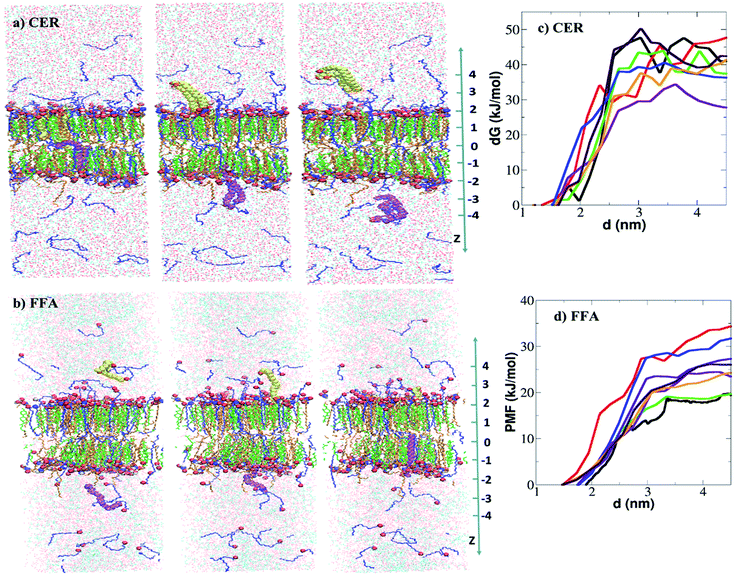 | ||
| Fig. 8 Free energy of extraction of CER and FFA from deformed skin lipid bilayer: snapshot of system in the end of the constrained simulation at three different z positions from the center of the bilayer. In each window, two molecules either (a) CER or (b) are constrained. Here constrained CER and FFA molecules are shown in vdw mode of VMD software.57 The CER, CHOL and FFA are shown in orange, green and blue colour respectively. Free energy profiles of (c) CER and (d) FFA extraction from the deformed skin lipid bilayer. | ||
For any given concentration, free energy of extraction either from an intact or deformed bilayer is higher for CER as compared to FFA, thus implying that CERs are more difficult to extract as compared to FFA, which is consistent with reported experiments.15,23 Merwe et al.15 carried out experiments on SC in presence of aqueous ethanol ranging from 0% to 100% v/v ethanol and studied lipid compositions using Fourier transform infrared spectroscopy (FTIR). Ethanol extracted the lipids, mostly FFA, as confirmed by lowered intensity of infrared absorption in the 1740 cm−1 range (associated with –COOH group). Similarly, Kwak et al.23 reported extraction of lipids out of mixed model bilayer system of CER, CHOL and palmitic acid in presence of ethanol at various concentration. Based on NMR profile it was concluded that the presence of ethanol affects palmitic acid most significantly while CER is affected to a lesser extent. At higher concentration regime (0.6 < x < 1.0) the change in the free energy of permeation is not significant. It implies that both CER and FFA can be extracted, although the amount of extraction may be different.
3.3 Permeation of drug molecule in presence of ethanol
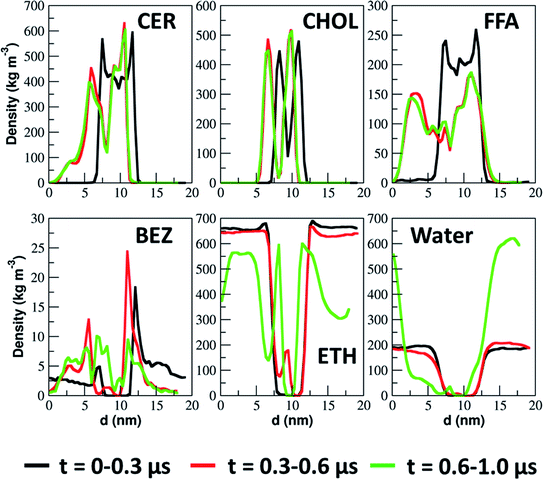
So far, we have shown from both unrestrained and constrained simulations that ethanol extracts the lipid from skin lipid layer and enhance the skin permeation. In this section, we discuss how drug molecules permeate in presence of ethanol molecules across the skin lipid layer. The ethanol concentration of x = 0.6 was chosen for this case. The benzoic acid was chosen as a drug molecule. In total, 8 drug molecules in the top solvent layer was inserted randomly. This system was energy minimized and subjected to NVT and NPT run as mentioned in method section of the manuscript. The simulation was run for 1 μs for this case. The snapshots of simulated system at various time steps are shown in Fig. 9. The lipid layer and solvent layer are shown separately and side by side for clarity. The ethanol molecule first re-oriented themselves near to the headgroup of lipid layer, and extracted the FFA selectively with in first 0.3 μs of simulation run. Once the FFAs were extracted, ethanol started penetrating inside the skin lipid layer and created a channel. The drug molecules penetrated inside the lipid bilayer through the channel. After 0.5 μs simulation run, some of CER molecules were also extracted. The phenomena of increase of drug permeation in the presence of ethanol are in line with several experimental studies.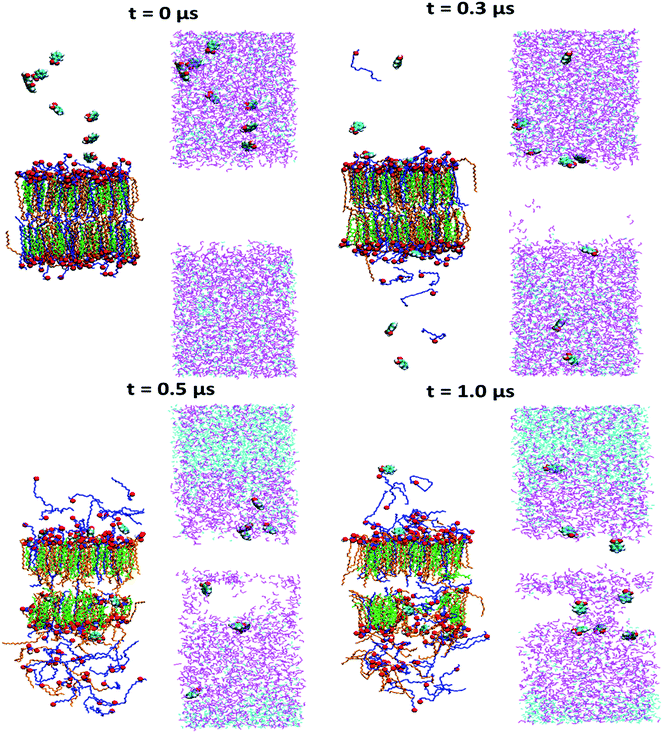 | ||
| Fig. 9 Effect of ethanol on drug permeation: the snapshots of time evolution of skin lipid bilayer system in presence of ethanol (x = 0.6). The CER, CHOL, FFA, ethanol and water are shown in orange, green and blue, magenta and cyan color respectively. The headgroup atoms of all three lipids are shown in vdw representation of VMD visualization software.57 | ||
Goates et al.45 carried out experiments on mannitol permeation through human epidermis in the presence of 75% (v/v) alcohol–saline mixtures. The permeability of mannitol increased with increase in ethanol concentration and based on FTIR spectra it was concluded that permeation increased due to extraction of the lipids from the skin SC in presence of ethanol. Krishnaiah et al.14 carried out permeation experiments of nimodipine through rat skin using ethanol–water as solvent. FTIR studies showed that ethanol solution increased the transdermal permeability of nimodipine across the rat abdominal skin by partial extraction of lipids in the stratum corneum. Manabe et al.17 carried out drug permeation experiments in the presence of ethanol–water solvent at different concentration range (0–100%). It was reported that at lower ethanol concentration (<60%), the lipids are extracted and the mobility of lipid chain increased which resulted in higher flux of the drugs. While, at higher concentration (>80%), other than extracting lipids, ethanol denatured the SC protein, which created larger pores and resulted in higher drug permeation irrespective of drug polarity. In our simulations, we also observed a drastic effect of ethanol at higher concentrations where it has distorted the bilayer structure (Fig. 2 and 7). Kim et al.18 performed simultaneous rat skin permeation of dideoxynucleoside-type anti-HIV drugs in presence of various volume fractions of ethanol aqueous solution. It was shown that the flux of the drug increased with increase in ethanol concentration up to 80% ethanol volume fraction. Sakdiset et al.46 carried out permeation experiments of caffeine through skin in presence of various concentrations of ethanol aqueous solution. The enhancement ratio of caffeine flux increased ∼4 times with ethanol concentration of x = 0.1 to x = 0.7. After x = 0.7, the enhancement did not change significantly. In our simulations also we have observed that at concentration of x = 0.8 and x = 1.0, bilayer has almost disrupted (Fig. 1), and both the cases shows fully disordered bilayer structure (Fig. 4). Panchagnula et al.16 carried out permeation of drug naloxone through rat skin at various concentration of ethanol in presence of water and ethylene glycol. It was shown that the flux of the drug increased with increase in ethanol concentration in water up to 66%.
The extraction and permeation of skin lipids and ethanol are quantified in terms of their density profiles calculated in three different simulation time intervals. The density profiles of each of the constituents of the simulated system are shown in Fig. 10. The peak position and intensity are changed with time due to extraction of the lipid, which led to change in the thickness of the lipid layer. In skin lipids, the FFA density reduced significantly as compared to CER and CHOL. The CHOL peak positions changed slightly, but their peaks intensity was not changed, as they were not being extracted. It is also clear from the density profile that, at first skin lipids (specifically FFA) were extracted and after that ethanol permeated inside the lipid bilayer taking few of water molecules along with them. Finally drug molecules pass through the channels created by ethanol molecules inside the lipid layer.
Our observation such as interaction of ethanol with headgroup of CER and FFA and making hydrogen bonds with them at lower concentration and creating defects inside the lipid layer at higher concentration are also in line with some of simulation studies on phospholipid bilayer in presence of ethanol. Chanda and Bandyopadhyay47 reported that at a low concentration (12.5 mol%), ethanol sits near the headgroup interface. Patra et al.48 reported that ethanol forms hydrogen bonds with phospholipids and decreases the ordering of the hydrocarbon chains. Gurtovenko et al.49 reported that at lower concentration (<26%), ethanol induces small changes in the bilayer structure but at higher concentration (∼58%) it makes pores inside the bilayer and induces formation of non-bilayer structure. In our simulation, we have not observed non-bilayer domain formation at such ethanol concentration (x ≤ 0.6) likely due to the differences in the phases of the bilayer in these two simulations. Specifically, the phospholipid bilayers in simulation of Gurtovenko et al.49 were in fluid phase whereas those in our simulations were in a gel phase. Another reason could be the presence of CHOL is the lipid layer which reduces the likelihood of forming of non-bilayer domains (Fig. S5–S8†). CHOL renders rigidity to the lipid layer which has been shown in earlier simulation studies.28,50
Based on unrestrained simulations, we can conclude that at concentration (x < 0.2), the lipid extraction is highly unlikely, at moderate concentration (0.2 < x < 0.6), extraction is feasible for FFA and at higher concentration (x > 0.6), both FFA and CER can be extracted from the SC lipids. The constrained simulations of both intact and deformed bilayer shows that for any given concentration of ethanol, the free energy of extraction of FFA is much lower as compared to CER. Hence, unrestrained and umbrella sampling simulations confirm that ethanol extracts the lipids from the skin SC layer and amount of lipid extraction depends upon the concentration of the ethanol and most importantly FFA are being target more by ethanol as compared to CER. The drug molecules penetrates inside the lipid layer through the channels created by the ethanol molecules after extracting the lipid from the skin lipid bilayers. In summary, ethanol interacts with skin lipids in a concentration-dependent manner. At lower concentrations, it interacts only with the headgroup and leads to lipid extraction. At higher concentrations, it not only extracts the lipids, but also uses the created vacancy and permeation inside the skin lipids layer for transport of water and increases the chain mobility. The drug permeation generally happens through the channels created by the ethanol inside the lipid layer.
4. Conclusion
In this study, we provide the mechanistic basis for the permeation enhancing mechanism of ethanol on skin lipid bilayer. A realistic skin lipid bilayer model comprising of CER, CHOL and FFA is used and results show that the ethanol selectively extracts out the FFA molecule out of lipid bilayer. The lipid extraction was found to be controlled by a trade-off between inter and intra molecule hydrogen bonding capabilities of lipids (CER & FFA) and solvents (ethanol and water). Ethanol changes the bilayer structure or permeability through two mechanisms, first by interaction and extraction of lipids and second by permeating inside the interior of the bilayer and increasing lipid chains movements. Quantification of lipid extraction capabilities of ethanol is carried out by calculating free energies of permeation. It was found that FFA has a lower free energy of extraction as compared to CER, and similar observations are made in unconstrained simulation as well. The co-delivery mechanism of drug permeation in the presence of ethanol is also discussed. The ethanol first extracts the skin lipid, and then penetrate inside the lipid layer by creating the channels which facilitate the permeation of the drug molecules.Overall, our study shows that ethanol extracts the lipids from lipid bilayer due to competition between inter and intra-atomic hydrogen bonding between lipids (CER–CER, CER–FFA and FFA–FFA) and solvents (ethanol and water). The unrestrained simulations have confirmed that lipid extraction is the mechanism by which ethanol perturbs the skin barrier function. The umbrella sampling simulations confirmed that FFA are more prone to be extracted as compared to CER.
Our simulations have shown concurrence with various experimentally observed phenomena. However, our studies have uncovered certain questions that need to be further explored. The model used here is a comprehensive model with three classes of lipids, however, representing the entire CERs family with one CER-NS is somewhat of a simplification. Also, the effect of fatty acid chain length of both FFA and CER have not been taken into account. Earlier studies have shown significant effects of CER type and FFA chain length on skin permeation properties.51–56,58 As seen in simulations, ethanol interacts with headgroup atoms of skin lipids and makes hydrogen bonds with them, i.e., it reduces hydrogen bonding capabilities of lipid headgroup with each other and reduces the barrier function of skin SC. The skin SC possesses various types of ceramides and ethanol interacts with each one very differently due to their headgroup structure (number and position of –OH groups).22 Thus, a skin model with various CERs and FFAs along with their analogues of different chain length should be used to arrive at conclusive mechanisms. In spite of these limitation, our model was able to predict various experimentally observed phenomena. The model and methodology further could be used to design or test the active molecules which are used as permeation enhancers in various drug and cosmetic formulations.
Funding & resources
This research was funded by Tata Consultancy Services (TCS), CTO organization under SWON number 1009292.Conflicts of interest
There are no conflicts of interest.Acknowledgements
Authors would like to thank High Performance Computing facilities at Tata Consultancy Services (TCS) for access to EKA Supercomputer and K Ananth Krishnan, VP and CTO, TCS for his guidance and fruitful discussions.References
- A. Naik, Y. Kalia and R. Guy, Transdermal Drug Delivery: Overcoming the Skin's Barrier Function, Pharm. Sci. Technol. Today, 2000, 3, 318–326 CrossRef CAS PubMed.
- P. M. Elias, Epidermal Lipids, Barrier Function and Desquamation, J. Invest. Dermatol., 1983, 80, 44–49 CrossRef CAS PubMed.
- A. C. Williams and B. W. Barry, Penetration Enhancers, Adv. Drug Delivery Rev., 2004, 56, 603–618 CrossRef CAS PubMed.
- R. Pendlington, E. Whittle, J. Robinson and D. Howes, Fate of Ethanol Topically Applied to Skin, Food Chem. Toxicol., 2001, 39, 169–174 CrossRef CAS PubMed.
- A. Kramer, H. Below, N. Bieber, G. Kampf, C. Toma, N. Huebner and O. Assadian, Quantity of Ethanol Absorption after Excessive Hand Disinfection using Three Commercially Available Hand Rubs is Minimal and Below Toxic Levels for Humans, BMC Infect. Dis., 2007, 7, 117 CrossRef PubMed.
- M. Kirschner, R. Lang, B. Breuer, M. Breuer, C. Gronover, T. Zwingers, J. Böttrich, A. Arndt, U. Brauer, M. Hintzpeter and M. A. Burmeister, Transdermal Resorption of an Ethanol- and 2-Propanol-containing Skin Disinfectant, Langenbeck's Arch. Surg., 2007, 394, 151–157 CrossRef PubMed.
- L. K. Pershing, L. D. Lambert and K. Knutson, Mechanism of Ethanol-enhanced Estradiol Permeation across Human Skin In vivo, Pharm. Res., 1990, 7, 170–175 CrossRef CAS PubMed.
- W. R. Good, M. S. Powers, P. Campbell and L. Schenkel, A New Transdermal Delivery System for Estradiol, J. Controlled Release, 1985, 2, 89–97 CrossRef CAS.
- B. Berner, G. C. Mazzenga, J. H. Otte, R. J. Steffens, R. H. Juang and C. D. Ebert, Ethanol: Water Mutually Enhanced Transdermal Therapeutic System II: Skin Permeation of Ethanol and Nitroglycerin, J. Pharm. Sci., 1989, 78, 402–407 CrossRef CAS PubMed.
- D. Bommannan, R. O. Potts and R. H. Guy, Examination of the Effect of Ethanol on Human Stratum Corneum In vivo using Infrared Spectroscopy, J. Controlled Release, 1991, 16, 299–304 CrossRef CAS.
- T. Kai, V. H. Mak, R. O. Potts and R. H. Guy, Mechanism of Percutaneous Penetration Enhancement: Effect of n-alkanols on the Permeability Barrier of Hairless Mouse Skin, J. Controlled Release, 1990, 12, 103–112 CrossRef CAS.
- T. Kurihara-Bergstrom, K. Knutson, L. J. DeNoble and C. Y. Goates, Percutaneous Absorption Enhancement of an Ionic Molecule by Ethanol–water Systems in Human Skin, Pharm. Res., 1990, 7, 762–766 CrossRef CAS PubMed.
- A. K. Levang, K. Zhao and J. Singh, Effect of Ethanol/Propylene Glycol on the In vitro Percutaneous Absorption of Aspirin, Biophysical Changes and Macroscopic Barrier Properties of the Skin, Int. J. Pharm., 1999, 181, 255–263 CrossRef CAS PubMed.
- Y. S. R. Krishnaiah, P. Bhaskar and V. Satyanarayana, Penetration-Enhancing Effect of Ethanol–Water Solvent System and Ethanolic Solution of Carvone on Transdermal Permeability of Nimodipine from HPMC Gel Across Rat Abdominal Skin, Pharm. Dev. Technol., 2004, 9, 63–74 CrossRef CAS PubMed.
- D. Van der Merwe and J. E. Riviere, Comparative Studies on the Effects of Water, Ethanol and Water/Ethanol Mixtures on Chemical Partitioning into Porcine Stratum Sorneum and Silastic Membrane, Toxicol. In Vitro, 2005, 19, 69–77 CrossRef CAS PubMed.
- R. Panchagnula, P. S. Salve, N. S. Thomas, A. K. Jain and P. Ramarao, Transdermal Delivery of Naloxone: Effect of Water, Propylene Glycol, Ethanol and their Binary Combinations on Permeation through Rat Skin, Int. J. Pharm., 2001, 219, 95–105 CrossRef CAS PubMed.
- E. Manabe, K. Sugibayashi and Y. Morimoto, Analysis of Skin Penetration Enhancing Effect of Drugs by Ethanol-water Mixed Systems with Hydrodynamic Pore Theory, Int. J. Pharm., 1996, 129, 211–221 CrossRef CAS.
- D. D. Kim and Y. W. Chien, Simultaneous Skin Permeation of Dideoxynucleoside-type Anti-HIV Drugs, J. Controlled Release, 1996, 40, 67–76 CrossRef CAS.
- C. M. Heard, D. Kung and C. P. Thomas, Skin Penetration Enhancement of Mefenamic Acid by Ethanol and 1, 8-Cineole Can be Explained by the ‘Pull'Effect, Int. J. Pharm., 2006, 321, 167–170 CrossRef CAS PubMed.
- C. K. Lee, T. Uchida, E. Noguchi, N. S. Kim and S. Goto, Skin Permeation Enhancement of Tegafur by Ethanol/Panasate 800 or Ethanol/Water Binary Vehicle and Combined Effect of Fatty Acids and Fatty Alcohols, J. Pharm. Sci., 1993, 82, 1155–1159 CrossRef CAS PubMed.
- N. A. Megrab, A. C. Williams and B. W. Barry, Oestradiol Permeation across Human Skin, Silastic and Snake Skin Membranes: The Effects of Ethanol/Water Co-solvent Systems, Int. J. Pharm., 1995, 116, 101–112 CrossRef CAS.
- E. C. Guillard, A. Tfayli, C. Laugel and A. Baillet-Guffroy, Molecular Interactions of Penetration Enhancers within Ceramides Organization: a FTIR approach, Eur. J. Pharm. Sci., 2009, 36, 192–199 CrossRef CAS PubMed.
- S. Kwak, E. Brief, D. Langlais, N. Kitson, M. Lafleur and J. Thewalt, Ethanol Perturbs Lipid Organization in Models of Stratum Corneum Membranes: An Investigation Combining Differential Scanning Calorimetry, Infrared and 2 H NMR Spectroscopy, Biochim. Biophys. Acta, Biomembr., 2012, 1818, 1410–1419 CrossRef CAS PubMed.
- S. L. Krill, K. Knutson and W. I. Higuchi, Ethanol Effects on the Stratum Corneum Lipid Phase Behavior, Biochim. Biophys. Acta, Biomembr., 1992, 1112, 273–280 CrossRef CAS.
- R. Gupta, D. Sridhar and B. Rai, Molecular Dynamics Simulation Study of Permeation of Molecules through Skin Lipid Bilayer, J. Phys. Chem. B, 2016, 120, 8987–8996 CrossRef CAS PubMed.
- K. Gajula, R. Gupta, D. B. Sridhar and B. Rai, In-Silico Skin Model: A Multiscale Simulation Study of Drug Transport, J. Chem. Inf. Model., 2017, 57, 2027–2034 CrossRef CAS PubMed.
- Y. Masukawa, H. Narita, H. Sato, A. Naoe, N. Kondo, Y. Sugai, T. Oba, R. Homma, J. Ishikawa, Y. Takagi and T. Kitahara, Comprehensive Quantification of Ceramide Species in Human Stratum Corneum, J. lipid Res., 2009, 50, 1708–1719 CrossRef CAS PubMed.
- R. Gupta and B. Rai, Molecular Dynamics Simulation Study of Skin Lipids: Effects of the Molar Ratio of Individual Components over a Wide Temperature Range, J. Phys. Chem. B, 2015, 119, 11643–11655 CrossRef CAS PubMed.
- W. F. van Gunsteren and H. J. Berendsen, Groningen molecular simulation (GROMOS) Library Manual, Biomos, Groningen, 1987, vol. 24, p. 13 Search PubMed.
- O. Berger, O. Edholm and F. Jähnig, Molecular Dynamics Simulations of a Fluid Bilayer of Dipalmitoylphosphatidylcholine at Full Hydration, Constant Pressure, and Constant Temperature, Biophys. J., 1997, 72, 2002–2013 CrossRef CAS PubMed.
- S. Guo, T. C. Moore, C. R. Iacovella, L. A. Strickland and C. McCabe, Simulation Study of the Structure and Phase Behavior of Ceramide Bilayers and the Role of Lipid Headgroup Chemistry, J. Chem. Theory Comput., 2013, 9, 5116–5126 CrossRef CAS PubMed.
- M. Höltje, T. Förster, B. Brandt, T. Engels, W. von Rybinski and H. D. Höltje, Molecular Dynamics Simulations of Stratum Corneum Lipid Models: Fatty Acids and Cholesterol, Biochim. Biophys. Acta, Biomembr., 2001, 1511, 156–167 CrossRef.
- H. J. Berendsen, J. P. Postma, W. F. Gunsteren and H. J. van, Interaction Models for Water in Relation to Protein Hydration, Intermol. Forces, 1981, 331–342 CAS.
- B. Hess, C. Kutzner, D. Van Der Spoel and E. Lindahl, GROMACS 4: Algorithms for Highly Efficient, Load-balanced, and Scalable Molecular Simulation, J. Chem. Theory Comput., 2008, 4, 435–447 CrossRef CAS PubMed.
- S. Pronk, S. Páll, R. Schulz, P. Larsson, P. Bjelkmar, R. Apostolov, M. R. Shirts, J. C. Smith, P. M. Kasson, D. Van Der Spoel and B. Hess, GROMACS 4.5: A High-Throughput and Highly Parallel Open Source Molecular Simulation Toolkit, Bioinformatics, 2013, 29, 845–854 CrossRef CAS PubMed.
- M. J. Abraham, T. Murtola, R. Schulz, S. Páll, J. C. Smith, B. Hess and E. Lindahl, GROMACS: High Performance Molecular Simulations Through Multi-level Parallelism from Laptops to Supercomputers, SoftwareX, 2015, 1, 19–25 CrossRef.
- S. Nosé, A molecular dynamics method for simulations in the canonical ensemble, Mol. Phys., 1984, 52(2), 255–268 CrossRef.
- S. Nosé and M. L. Klein, Constant pressure molecular dynamics for molecular systems, Mol. Phys., 1983, 50(5), 1055–1076 CrossRef.
- W. G. Hoover, Canonical dynamics: Equilibrium phase-space distributions, Phys. Rev. A: At., Mol., Opt. Phys., 1985, 31(3), 1695 CrossRef PubMed.
- M. Parrinello and A. Rahman, Polymorphic transitions in single crystals: A new molecular dynamics method, J. Appl. Phys., 1981, 52(12), 7182–7190 CrossRef CAS.
- B. Hess, H. Bekker, H. J. Berendsen and J. G. Fraaije, LINCS: A Linear Constraint Solver for Molecular Simulations, J. Comput. Chem., 1997, 18, 1463–1472 CrossRef CAS.
- S. Miyamoto and P. A. Kollman, SETTLE: An Analytical Version of the Shake and Rattle Algorithm for Rigid Water Models, J. Comput. Chem., 1992, 13, 952–962 CrossRef CAS.
- R. Thind, D. W. O'Neill, A. Del Regno and R. Notman, Ethanol Induces the Formation of Water-permeable Defects in Model Bilayers of Skin Lipids, Chem. Commun., 2015, 51, 5406–5409 RSC.
- S. Kumar, J. M. Rosenberg, D. Bouzida, R. H. Swendsen and P. A. Kollman, The Weighted Histogram Analysis Method for Free-energy Calculations on Biomolecules. I. The Method, J. Comput. Chem., 1992, 13, 1011–1021 CrossRef CAS.
- C. Y. Goates and K. Knutson, Enhanced permeation of polar compounds through human epidermis. I. Permeability and membrane structural changes in the presence of short chain alcohols, Biochim. Biophys. Acta, Biomembr., 1994, 1195(1), 169–179 CrossRef CAS.
- P. Sakdiset, Y. Kitao, H. Todo and K. Sugibayashi, High-Throughput Screening of Potential Skin Penetration-Enhancers Using Stratum Corneum Lipid Liposomes: Preliminary Evaluation for Different Concentrations of Ethanol, J. Pharm., 2017, 7409420 Search PubMed.
- J. Chanda and S. Bandyopadhyay, Distribution of Ethanol in a Model Membrane: A Computer Simulation Study, Chem. Phys. Lett., 2004, 392, 249–254 CrossRef CAS.
- M. Patra, E. Salonen, E. Terama, I. Vattulainen, R. Faller, B. W. Lee, J. Holopainen and M. Karttunen, Under the Influence of Alcohol: The Effect of Ethanol and Methanol on Lipid Bilayers, Biophys. J., 2006, 90, 1121–1135 CrossRef CAS PubMed.
- A. A. Gurtovenko and J. Anwar, Interaction of Ethanol with Biological Membranes: The Formation of Non-bilayer Structures within the Membrane Interior and Their Significance, J. Phys. Chem. B, 2009, 113, 1983–1992 CrossRef CAS PubMed.
- A. Polley and S. Vemparala, Partitioning of Ethanol in Multi-component Membranes: Effects on Membrane Structure, Chem. Phys. Lipids, 2013, 166, 1–11 CrossRef CAS PubMed.
- P. Pullmannová, L. Pavlíková, A. Kováčik, M. Sochorová, B. Školová, P. Slepička, J. Maixner, J. Zbytovská and K. Vávrová, Permeability and Microstructure of Model Stratum Corneum Lipid Membranes Containing Ceramides with Long (C16) and Very Long (C24) Acyl Chains, Biophys. Chem., 2017, 224, 20–31 CrossRef PubMed.
- B. Školová, A. Kováčik, O. Tesař, L. Opálka and K. Vávrová, Phytosphingosine, Sphingosine and Dihydrosphingosine Ceramides in Model Skin Lipid Membranes: Permeability and Biophysics, Biochim. Biophys. Acta, Biomembr., 2017, 1859, 824–834 CrossRef PubMed.
- T. Engelbrecht, B. Deme, B. Dobner and R. Neubert, Study of the Influence of the Penetration Enhancer Isopropyl Myristate on the Nanostructure of Stratum Corneum Lipid Model Membranes Using Neutron Diffraction and Deuterium Labelling, Skin Pharmacol. Physiol., 2012, 25, 200–207 CrossRef CAS PubMed.
- J. Smeden, M. Janssens, E. C. Kaye, P. J. Caspers, A. P. Lavrijsen, R. J. Vreeken and J. A. Bouwstra, The Importance of Free Fatty Acid Chain Length for the Skin Barrier Function in Atopic Eczema Patients, Exp. Dermatol., 2014, 23, 45–52 CrossRef PubMed.
- R. Gupta, B. S. Dwadasi and B. Rai, Molecular Dynamics Simulation of Skin Lipids: Effect of Ceramide Chain Lengths on Bilayer Properties, J. Phys. Chem. B, 2016, 120, 12536–12546 CrossRef CAS PubMed.
- E. Wang and J. B. Klauda, Simulations of Pure Ceramide and Ternary Lipid Mixtures as Simple Interior Stratum Corneum Models, J. Phys. Chem. B, 2018, 122, 2757–2768 CrossRef CAS PubMed.
- W. Humphrey, A. Dalke and K. Schulten, VMD: Visual Molecular Dynamics, J. Mol. Graphics, 1996, 14, 33–38 CrossRef CAS PubMed.
- Y. Badhe, R. Gupta and B. Rai, Structural and barrier properties of the skin ceramide lipid bilayer: a molecular dynamics simulation study, J. Mol. Model., 2019, 25, 140 CrossRef PubMed.
Footnote |
| † Electronic supplementary information (ESI) available: S1. Interaction of ethanol with CER, CHOL, FFA and water at various ethanol concentration. S2. Interaction of FFA and CER with ethanol and various extraction mechanism. S3. Time evolution of distance between head and tail group atoms of CER and FFA. S4. Evolution of density of bilayer constituents along the bilayer normal. S5. Free energy profile of individual simulations at various ethanol concentrations. S6. Convergence of free energy profile and umbrella sampling simulations. See DOI: 10.1039/d0ra01692f |
| This journal is © The Royal Society of Chemistry 2020 |

